Pendo vs Amplitude: Which is the Better Product Analytics Tool?


Pendo vs Amplitude? Which of them should you choose to generate growth insights for your product? This is a serious dilemma.
In our article, we aim to help you make the decision. We also have a quick look at Userpilot as an alternative for each of the tools.
How does this sound? Ready to dive in?
Pendo is an established product adoption platform for enterprise clients.
It’s best known for its in-depth analytics features, but it also allows you to collect user feedback and offers a range of in-app onboarding features, which you can use for both web and mobile products.

What’s your primary goal with a product analytics tool?
Understanding your main objective helps in choosing between robust analytics platforms like Pendo or Amplitude, or an all-in-one solution.
How important is it to act on analytics *within the same tool*?
Consider if you prefer an analytics-only tool like Amplitude, which requires other software for engagement, or a platform like Pendo that includes guidance features, though sometimes at a high cost and complexity.
Which potential challenge are you most concerned about?
Both Pendo and Amplitude are powerful but come with trade-offs. Pendo can have a steep learning curve and fragmented UI, while Amplitude is purely focused on analytics, lacking built-in engagement features.
You need a solution that combines powerful analytics with user-friendly engagement tools.
Stop choosing between just Pendo and Amplitude. Userpilot offers robust analytics, no-code in-app experiences, and transparent pricing to help you understand your users and guide them to success—all in one platform.
Pendo analytics features
The tool supports a whole host of analytics features:
- Paths for mapping out every possible sequence of events leading up to or following a user action.
- Reports, including page views, feature clicks, track events, and guide views.
- NPS tracking and analytics (not available in the free plan).
- Product Engagement Score (PES) tracking and analysis.
Let’s have a more detailed look at these four:
- User segmentation.
- User retention analysis.
- Funnels.
- User feedback module.
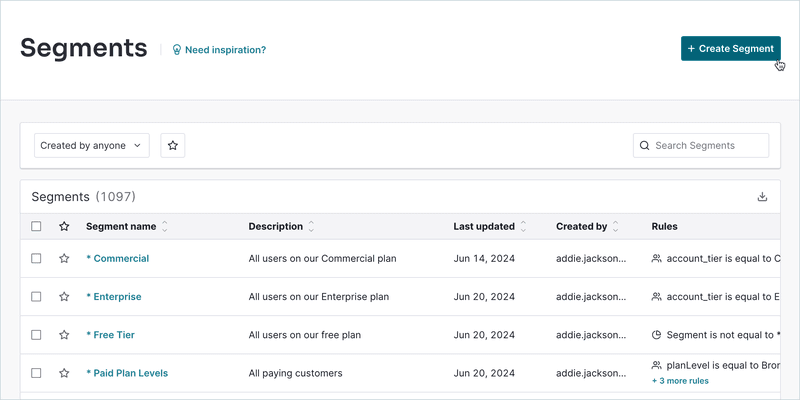
Pendo Segments
The Pendo Segments functionality allows you to group users by a wide range of behavior, usage, and metadata criteria, enabling highly targeted in-app experiences.
- Product usage and user behavior data, like tagged feature clicks, tagged page views, guide views, poll responses, and resource center views.
- Visitor and account data, including demographic and systems data.
- Mobile-specific data, like app or OS version.
You can use it to target specific segments with Pendo Guides (building in-app messages using Guides).
For example, you could trigger them for users who have completed a certain event without using a specific feature that’s relevant to their use case.
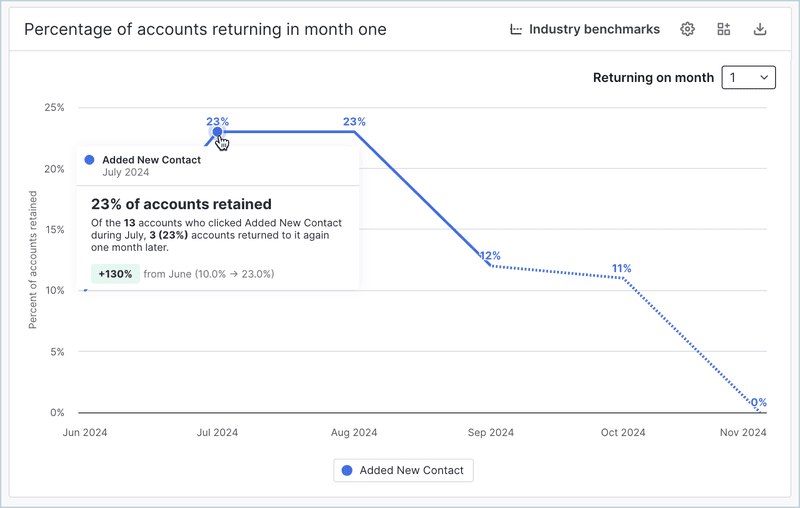
Pendo Retention Analysis
Retention Analysis in Pendo helps teams understand whether users continue engaging with the product over time.
Pendo’s cohort-based retention chart visualizes how often users return after a specific starting action. You can filter the data by app, segment, start and return events, and time range to uncover patterns across different user groups.
The chart is interactive: clicking on each square reveals details about retained and dropped visitors within that cohort. These insights can inform your strategy in several ways:
- Create targeted segments based on usage drop-offs and re-engage them with in-app messages using Pendo Guides.
- Export user data or sync it with your CRM (like HubSpot or Salesforce) to trigger personalized email outreach.
- Deploy surveys to specific segments to understand the reasons behind churn or engagement gaps.
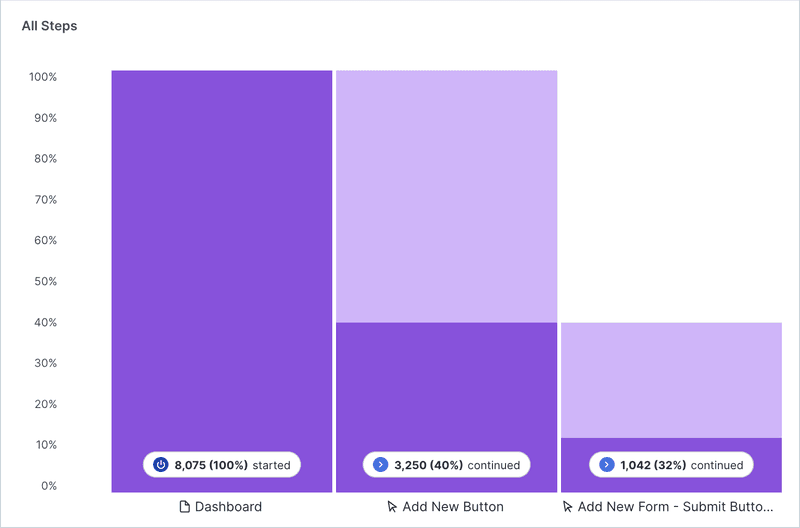
Pendo Funnels
A user funnel is a sequence of actions completed by a user in-app leading up to a specific objective.
For example, this could be 1) logging in 2) inviting a teammate, and 3) sending them a message.
Using a user funnel in your SaaS helps you identify friction points and make data-driven decisions to boost conversions.
In Pendo, you can customize funnels by:
- Funnel steps
- Date range
- Segments
- Time out period
Once configured, your funnel can be viewed instantly and optionally saved as a widget in a custom dashboard.
Pendo Feedback module
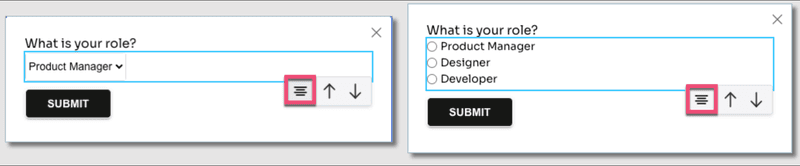
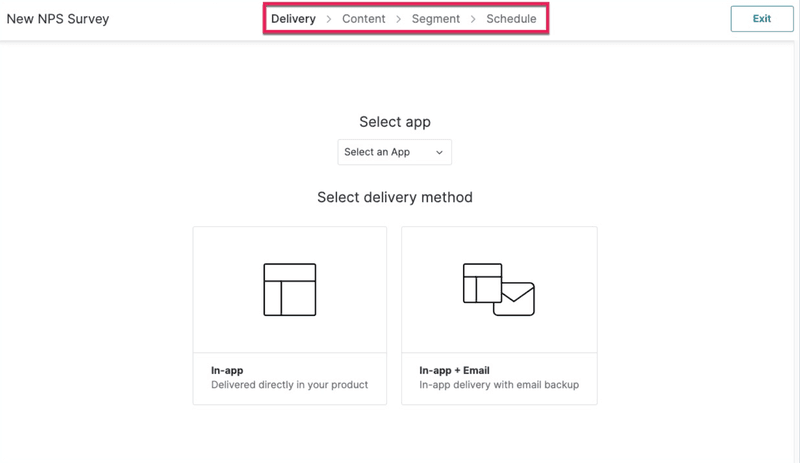
Pendo offers two primary methods for collecting user feedback: Pendo Polls and Pendo Feedback.
- Pendo Polls, created via the Guides module, let you collect in-app user sentiment through lightweight microsurveys. They are ideal for quick questions like CSAT, feature validation, or usability feedback.
- Pendo Feedback (included in Pulse and Ultimate plans) allows you to capture and organize customer feature requests, tag responses, analyze trends, and update customers on status changes like “Planned” or “Released.”
NPS surveys are only available starting with the Pulse plan (they’re not included in Free or Base plans and must be purchased as an add-on if not on Pulse or above). CSAT data can be gathered through Polls or third-party integrations.
Pros and cons of Pendo
What are Pendo’s greatest strengths and weaknesses when it comes to product analytics?
✅ Pros of Pendo
- Works on mobile apps as well as web apps.
- In-depth analytics that are easy to set up and use.
- Proprietary Product Engagement Score (PES).
🟡 Cons of Pendo
- High complexity & steep learning curve: Complex setup (metadata, tagging, segments) and a confusing UI often overwhelm new users. The extensive feature set leads to underutilization.
- High technical overhead: Requires developer support for CSS/JS hooks, metadata setup, and segment building.
- Modular licensing complexity: Core features (NPS analytics, branching logic, AI, Resource Center) are only available as add-ons or in higher tiers.
- Fragmented analytics UI: Reporting is split across Data Explorer, Guides, Listen, and Dashboards—slowing time to insights. Surveys and NPS also live in separate modules.
- In-app guides limitations: Basic features (Spotlights, Mobile Push Notifications) are missing or locked in the Guides Pro add-on. AI features like automatic translation and copywriting require another add-on. RTL languages aren’t fully supported.
- Dependency on integrations and add-ons: Longer setup times, higher package costs, and frequent data discrepancies.
- Expensive & non-transparent pricing: Costs escalate quickly with opaque MAU-based pricing, undisclosed add-on fees, and 5–20% uplifts at renewal. Multi-year commitments are required to cap pricing.
What do users say about Pendo?
Users rate Pendo highly as a tool for product training and documentation.
I like the abilitiy to leverage Pendo as another communication tool for customers. Sometimes email communication can be overwhelming or become stale. Pendo allows for us to switch up how we onboard, educate and introduce new features to our customers.
What do you dislike about Pendo?
Tagging features can be complicated when using dynamic CSS, so some work is needed to set up static attributes in the applications to utilize them effectively.
Companies that switched from Pendo to Userpilot have also shared their opinions:
“Switching from Pendo to Userpilot made our customer communication more effective and reduced our support workload significantly.”
— Matthew Brown, Senior Customer Solutions Manager at Shelterluv
💰Pendo pricing
Pendo offers a free plan, but its usefulness is quite limited. While Pendo’s free plan includes basic, Pendo-branded NPS, Pendo offers a free plan, but its usefulness is quite limited.
Here are Pendo pricing tiers:
- Free
- Base
- Core
- Pulse
- Ultimate
All pricing tiers require you to contact them to request pricing. Pendo’s users on Vendr report a typical pricing range between $25,000 and $141,000.
While Pendo’s free plan includes basic product analytics (behavioral & retroactive), in-app guides (web & mobile), and roadmaps for up to 500 MAUs, it does not include branded NPS surveys; you must upgrade to Pulse or purchase NPS as an add-on.
Advanced NPS (white-label email), Product Engagement Score (PES), and other key features require higher-tier plans.
Cuvama, an ex-Pendo customer, found better value for money and usability with Userpilot:
“With Pendo, I could not do, or at least I didn’t know how to easily do, specific flows for specific companies. With Userpilot, I can do it very easily without needing developer assistance.”
— Leyre Iniguez, Customer Experience Lead at Cuvama
Amplitude for product analytics
Amplitude is one of the most sophisticated analytics tools around at the moment.
As a dedicated analytics tool, it offers a wide range of features that SaaS product teams can deploy to identify areas to add value to their digital products and make data-driven decisions. Amplitude Analytics can be used on both mobile and web apps.
Amplitude analytics features
Amplitude analytics functionality includes:
- Milestone analysis.
- Retention analysis.
- Custom dashboards.
- Predictions.
- User segmentation.
- Pathfinder.
- Funnel analysis.
We’ll be focusing on the main features in detail below.
Amplitude event segmentation
Just like Pendo, Amplitude allows you to group your users into segments using a whole host of criteria.
Event segmentation is one of the key Amplitude charts because that is where you can see what your users are doing inside the product. The segmentation chart allows you to:
- Identify and evaluate the key events performed by a user segment over a specific period of time.
- Determine the total number of (unique) users completing events inside the product.
- Determine the frequency of event occurrence.
- Identify users who fire specific events on a regular basis.
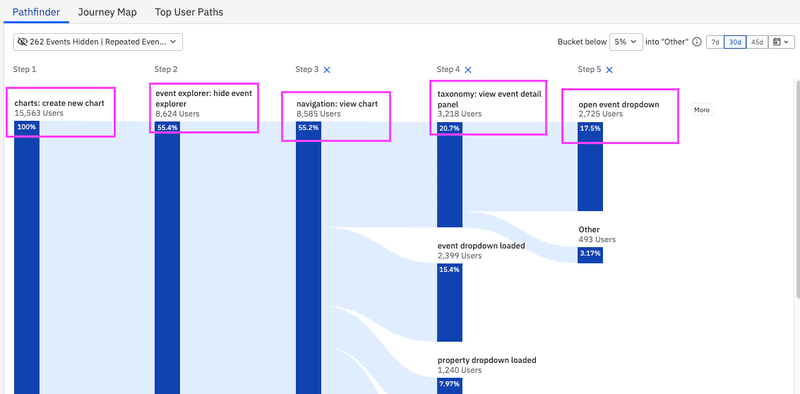
Amplitude Pathfinder (soon merged into the new Journeys experience)
Pathfinder enables visualization and analysis of all the actions that users complete while interacting with the product.
Most importantly, pathfinder helps you identify the sequences of events, called paths, that users fire over a specified period of time. This includes outgoing and incoming paths up to 50 steps deep.
What’s the use of Pathfinder? It allows you to:
- Uncover the most common event paths leading up to conversion/activation.
- Determine the happy path to conversion/activation.
- Build funnel charts.
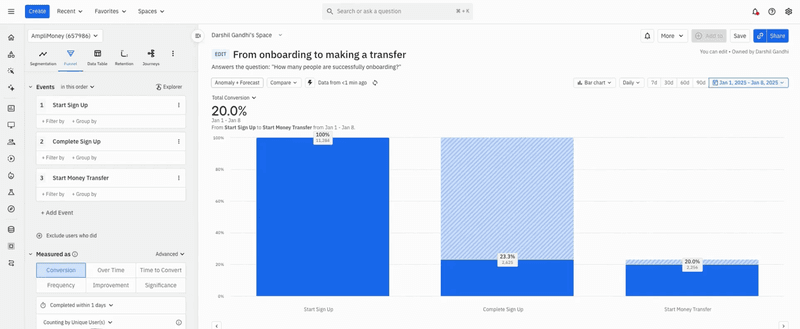
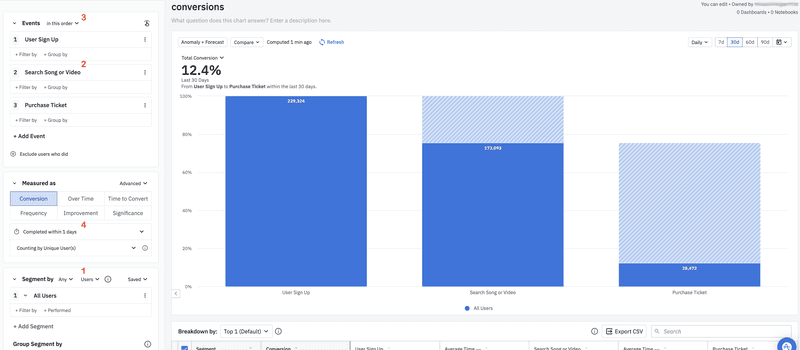
Amplitude funnel analysis
Once you’ve identified the happy path to conversion or activation with Pathfinder, you can now use funnel analysis to analyze and assess how users navigate it.
Thanks to conversion drivers, Amplitude provides insights into user behavior leading up to conversion or drop-off. This allows you to identify obstacles and friction points. As a result, you can:
- Reduce churn and improve retention.
- Improve user onboarding experiences.
- Turn your users into your product advocates.
- Drive freemium and trial conversion to paid plans.
Pros and cons of Amplitude Analytics
What are the biggest advantages and limitations of Amplitude Analytics?
✅ Pros of Amplitude Analytics
- Real-time analytics.
- Cross-platform analytics that allows you to track as your users move between your native apps, mobile apps, and webpages.
- Wide range of reports and analyses.
- Ability to integrate data from various sources, for example, marketing automation systems or CRM systems.
🟡 Cons of Amplitude Analytics
- No user engagement features.
- It’s an analytics-only tool, so you need additional software to act on the insights to drive growth.
- High level of customization which makes set-up difficult.
What do users say about Amplitude?
With an average rating of 4.5 on G2, Amplitude is another highly-rated tool.
Customers value Amplitude mostly for its product analysis capabilities and ease of data exploration.
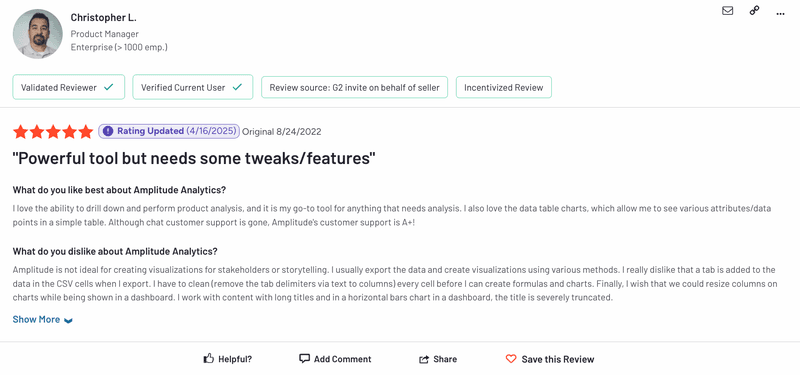
For example, Christopher L., a product manager at an enterprise company, writes:
I love the ability to drill down and perform product analysis, and it is my go-to tool for anything that needs analysis. I also love the data table charts, which allow me to see various attributes/data points in a simple table. Although chat customer support is gone, Amplitude’s customer support is A+!
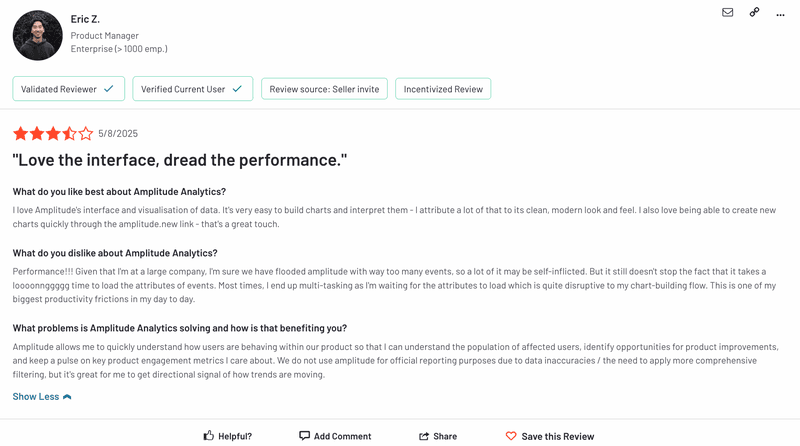
However, some users report performance challenges, especially in large enterprise environments.
Eric Z., another product manager, notes:
It takes a loooonnggggg time to load the attributes of events… Most times, I end up multi-tasking as I’m waiting, which is quite disruptive to my chart-building flow.
💰 Amplitude pricing
Just like Pendo, Amplitude offers a free trial. However, this one is way more generous than Pendo’s. How much do the other plans cost? Unfortunately, this is available only on request.
- Starter: Free
- Plus: $49 per month
- Growth plans: Price available only on request
- Enterprise: Price available only on request
Userpilot for product analytics: An alternative to Pendo and Amplitude Analytics
Userpilot is a powerful product adoption platform. It enables product managers, product marketers, and customer success teams to track product usage and user in-app behavior.
On top of that, they can collect feedback and trigger personalized onboarding experiences to enhance user experience and drive product adoption.
When should you consider Userpilot as an alternative to Pendo or Amplitude Analytics?
- Even though Userpilot has no free plan, it offers better value for money compared to Pendo.
- It enables you to collect data and act on it in real time, e.g., by triggering in-app experiences contextually in response to specific events. In contrast, Pendo has a 1-hour delay, whereas Amplitude has a very basic engagement layer (called Guides & Survey) that’s not as comprehensive as Userpilot.
Userpilot product analytics features
For a user onboarding tool, Userpilot offers incredible analytics functionality, including:
- Native analytics for all created experiences, i.e., flows, onboarding checklists, resource centers, etc.
- Comprehensive event-tracking (autocapture for web apps and event-tracking for mobile apps).
- Session replays.
- Analytics reports (funnel, path, trend, and retention reports).
- Analytics dashboards (4 available by default – Product Usage, New Users Activation, Core Feature Engagement, User Retention, and other customizable templates).
- Mobile and email analytics.
- Analytics integrations.
How Userpilot tracks in-app experiences natively
When you build flows, onboarding checklists, or resource centers in Userpilot, we automatically track how users interact with them.
You’ll know how many users saw, started, and completed each experience with no setup required. Want to improve your onboarding flow? Just check the drop-off steps and iterate.
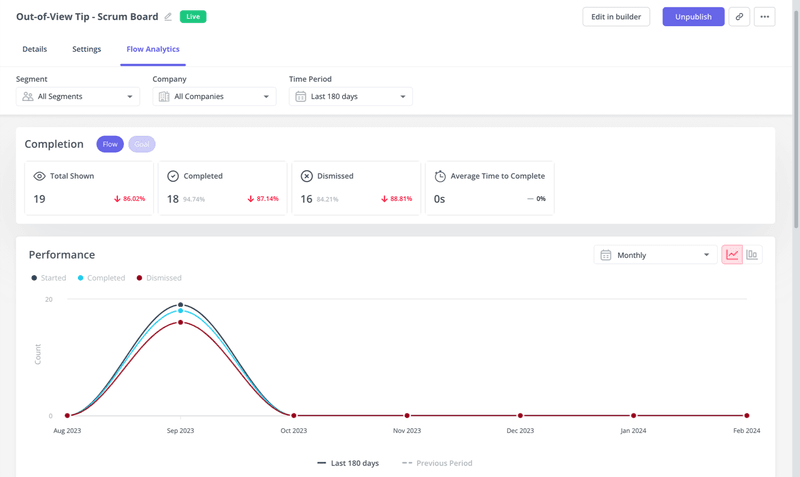
Because this tracking is built into our UI patterns, you don’t need to configure separate goals or events. Everything is tied directly to what you’ve launched, so you get instant feedback on what’s helping users succeed.
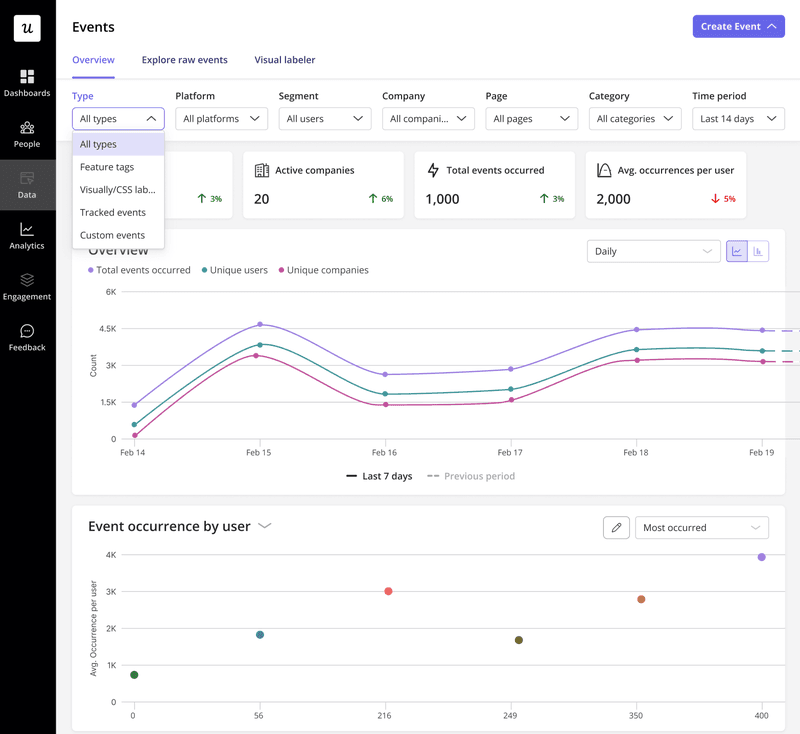
How Userpilot tracks user behavior across web and mobile
We’ve built event tracking in Userpilot to work right out of the box, so you don’t waste time manually tagging everything.
On web, our autocapture tracks key user interactions like clicks, hovers, form fills, and text inputs automatically from the moment the script is installed. It even pulls in historical data retroactively, so you don’t miss anything.
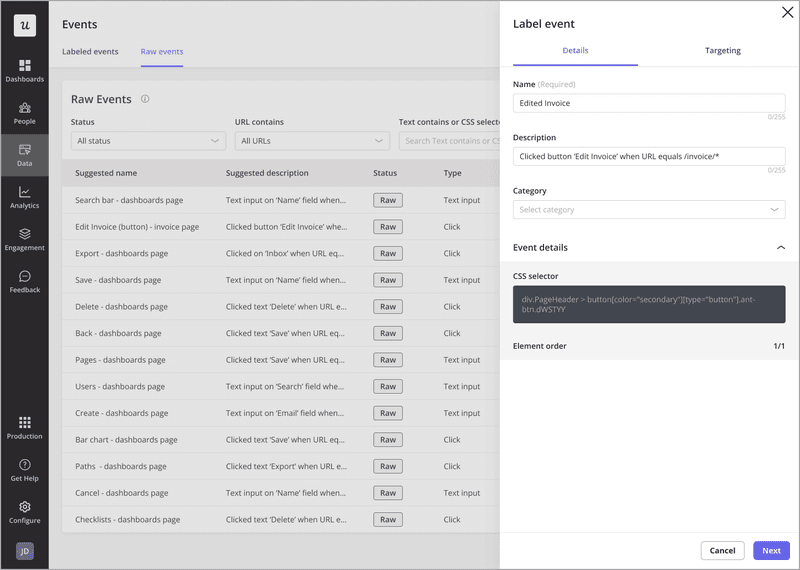
For mobile analytics, you can track custom events via the SDK. Whether you want to track screen views, feature usage, or onboarding flows on iOS or Android, you’ll get the full picture of how users interact with your app.
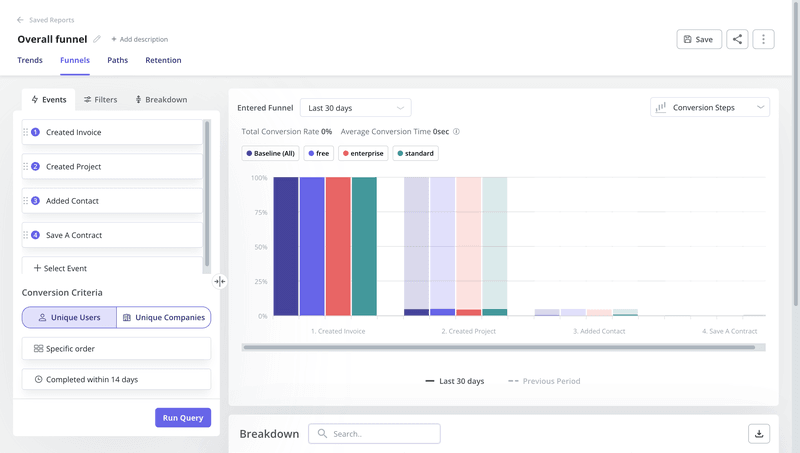
How Userpilot does product analytics: Funnels, paths, retention & more
Userpilot gives you four core types of analytics reports to uncover what’s working and what’s not:
- Funnels: See where users drop off in key flows.
- Paths: Uncover unexpected user journeys.
- Trends: Track changes in behavior over time.
- Retention: Measure how well you’re keeping users engaged.
These aren’t just raw numbers either. You can slice data by segments, timeframes, or user attributes to answer your questions fast.
We also make it easy to bring these insights into your own dashboards. Just drag and drop pre-built widgets or build fully custom dashboards to monitor product usage, activation, core feature adoption, and retention – all in one place.
Pros and cons of Userpilot
Here’s what makes Userpilot stand out from Pendo and Amplitude, and what still needs fine-tuning to deliver an even more outstanding user experience.
Pros of Userpilot
Here’s where Userpilot stands out compared to tools like Pendo and Amplitude:
✅ No-code Chrome extension: Build, preview, and launch in-app experiences directly on your live product, without needing engineers.
✅ Plays well with your existing analytics stack: Integrates with Amplitude, Mixpanel, Segment, Heap, and Google Analytics. Bring your event data in or sync insights out.
✅ A/B testing built into the editor: Experiment with flows, checklists, or modals to see what drives activation or feature adoption.
✅ Session replays + product analytics: Get both the what (quantitative) and the why (qualitative) in one platform, without switching tools.
✅ SOC 2 Type II certified: Userpilot meets enterprise-grade security and data handling standards.
✅ Mobile-ready: Create onboarding experiences and analyze user behavior on both web and native mobile apps.
Cons of Userpilot
🟡 Not ideal for early-stage startups: Userpilot’s pricing is better suited to scale-ups and established product teams than solo founders or very small teams.
What do users say about Userpilot?
At 4.6, Userpilot’s rating on G2 beats those of Pendo or Amplitude. Reviewers consistently highlight Userpilot’s ease of use, strong analytics, responsive support, and rich onboarding capabilities.
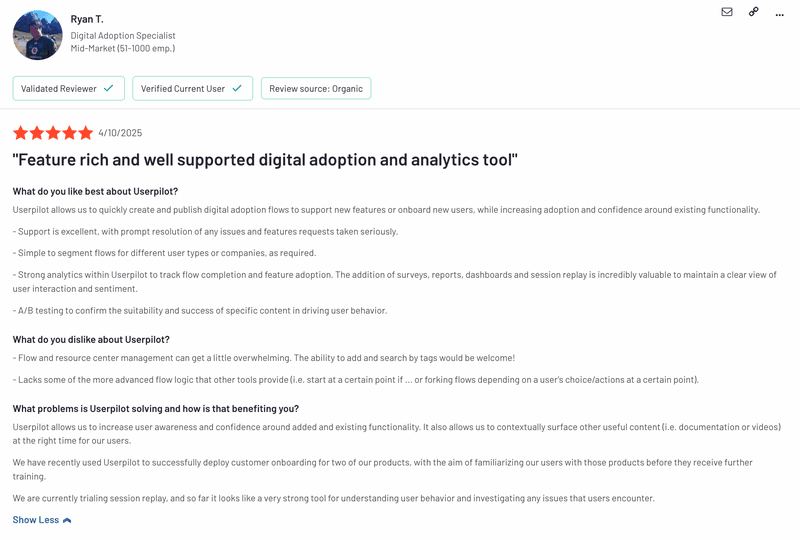
For example, Ryan T., a Digital Adoption Specialist in a mid-market company, writes:
Userpilot allows us to quickly create and publish digital adoption flows to support new features or onboard new users, while increasing adoption and confidence around existing functionality.
Another complimentary review reads:
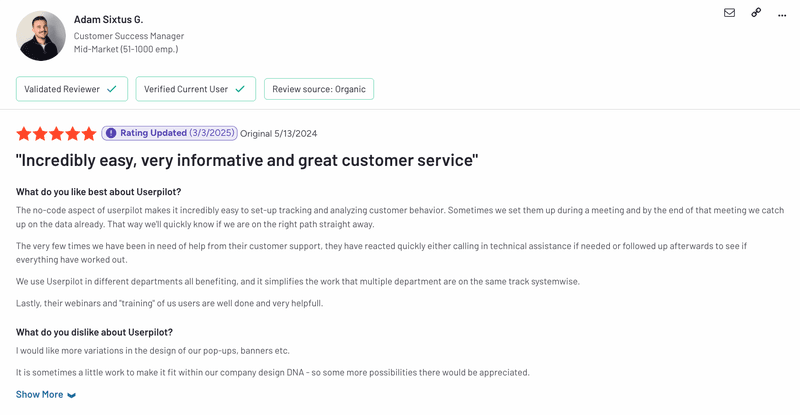
The no-code aspect of userpilot makes it incredibly easy to set-up tracking and analyzing customer behavior. Sometimes we set them up during a meeting and by the end of that meeting we catch up on the data already. That way we’ll quickly know if we are on the right path straight away.
(…)
We use Userpilot in different departments all benefiting, and it simplifies the work that multiple department are on the same track systemwise.
💰 Userpilot pricing
Unlike the other products, Userpilot doesn’t offer any free plans. There’s a 14-day free trial, after which you can choose from 3 main pricing plans:
Traction: From $299/month (billed annually)
Growth:Contact sales
Enterprise: Contact sales
So, Pendo or Amplitude for product analytics?
Who wins the Pendo vs. Amplitude contest? Both of them are robust analytics tools. While Amplitude has more advanced and highly customizable features, Pendo allows you to trigger in-app experiences to drive engagement.
Despite free plans, both products work out to be quite expensive if you want to use the more advanced features, so it might be a good idea to consider alternatives like Userpilot.
If you want to see how Userpilot can help you make data-driven decisions to improve your product, book the demo!
Userpilot strives to provide accurate information to help businesses determine the best solution for their particular needs. Due to the dynamic nature of the industry, the features offered by Userpilot and others often change over time. The statements made in this article are accurate to the best of Userpilot’s knowledge as of its publication/most recent update on August 20, 2025.
FAQ
What is product analytics?
Product analytics is the process of collecting, organizing, and analyzing data about users’ engagement with a product.
Its key objective is to develop a deeper understanding of who your users are and how they interact with the product. It helps product managers find where customer value comes from and where they encounter friction that stops them from achieving their goals.
How can a product analytics tool help you drive product growth?
If used well, product analytics tools help you obtain actionable insights that you can use to add value to your product and create delightful user experiences.
Without them, product teams would have to rely on anecdotal data, hunches, and guesses, which isn’t exactly the most reliable way to make product decisions.
Modern analytics tools allow teams to:
- Track and analyze user behavior in-app.
- Track product engagement.
- Build and track custom events.
- Set and track goals.
- Map out the user journey in flow diagrams and track user progress.
- Segment users based on their behavior, survey results, and demographic data.
- Visualize data through custom dashboards and funnels for ease of analysis.
About the author