The 7 Best SaaS Analytics Software of 2026


Harnessing the power of product analytics is pivotal for SaaS businesses seeking actionable insights from the data they collect.
But what data should you analyze and how?
In this post, we will break down the analytics software each SaaS business needs to understand its buyer and user personas, prospects, users, revenue metrics, and company health.
We’ll also tell you which data points and metrics you should pay particular attention to and how to track them using the SaaS analytics software listed here!
What is SaaS analytics?
SaaS companies use SaaS analytics to track customer data across the entire customer journey and make smarter, data-driven decisions.
SaaS analytics helps companies understand user behavior, reduce churn by understanding the reasons behind customer churn, increase user engagement at every touchpoint, and ultimately grow retention rates.
What it measures:
- Monthly recurring revenue (how much money comes in each month)
- Customer lifetime value (total money a customer will pay over time)
- Churn rate (how many customers cancel)
- Customer acquisition cost (how much it costs to get a new customer)
Why it matters:
SaaS analytics helps companies figure out which customers are most valuable, predict when customers might cancel, and make smart decisions about pricing and product features. It’s essential for growing a healthy subscription business.
What types of SaaS analytics software do SaaS companies need?
There is no one-size-fits-all SaaS analytics software. Selecting the right SaaS analytics tool depends on your specific business needs and the insights you’re seeking.
You can find specific software specialized for uncovering specific data points in the subscription business, including:
- Product analytics tools.
- User behavior analytics tools.
- Growth analytics tools for tracking growth and financial metrics.
SaaS companies need product and user behavior analytics tools to track user journeys, UX issues, and more.
In addition, if you need to measure the financial impact and feasibility of your SaaS business decisions, revenue analytics tools come in handy.
Let’s explore different SaaS analytics tools in more detail:
| Feature | Userpilot | Heap | Amplitude | Mixpanel | FullStory | Coupler.io | ChartMogul |
|---|---|---|---|---|---|---|---|
| Primary Focus | Product analytics + User engagement | User behavior insights | User journey tracking | Product analytics | Qualitative data + Session recordings | Automated reporting | Revenue analytics |
| Auto-Capture | ✅ Automatic event tracking | ✅ Yes | ✅ Yes | ✅ Yes | ✅ Yes | ❌ N/A | ❌ N/A |
| Session Recordings | ✅ Standard feature | ✅ Yes | ✅ Yes | ✅ Yes | ✅ Core feature | ❌ N/A | ❌ N/A |
| Funnel Analysis | ✅ Built-in | ✅ Yes | ✅ Yes | ✅ Yes | ✅ Yes | ❌ N/A | ❌ N/A |
| Cohort Analysis | ✅ Yes | ✅ Yes | ✅ Yes | ✅ Yes | ❌ No | ❌ N/A | ✅ Yes |
| User Segmentation | ✅ Behavior-based | ✅ Advanced | ✅ Yes | ✅ Yes | ✅ Basic | ❌ N/A | ✅ Yes |
| Path Analysis | ✅ Yes | ✅ Journey mapping | ✅ Pathfinder | ✅ Yes | ❌ No | ❌ N/A | ❌ N/A |
| Heatmaps | ❌ No | ✅ Clickmaps, Scroll depth | ✅ Yes | ✅ Yes | ✅ Yes | ❌ N/A | ❌ N/A |
| A/B Testing | ✅ Built-in | ❌ No | ✅ Yes | ❌ No | ❌ No | ❌ N/A | ❌ N/A |
| Custom Dashboards | ✅ Yes | ✅ Yes | ✅ Yes | ✅ Yes | ✅ Limited | ✅ Yes | ✅ Yes |
| Mobile Analytics | ✅ Cross-channel | ✅ Yes | ✅ Yes | ✅ Yes | ✅ Limited | ❌ No | ❌ No |
| Email Analytics | ✅ Unified cross-channel | ❌ No | ❌ No | ❌ No | ❌ No | ❌ No | ❌ No |
| In-App Messaging | ✅ Core feature | ❌ No | ❌ No | ❌ No | ❌ No | ❌ N/A | ❌ N/A |
| Predictive Analytics | ❌ No | ❌ No | ✅ Yes | ❌ No | ✅ AI-powered | ❌ No | ❌ No |
| Retention Analysis | ✅ Yes | ✅ Yes | ✅ Yes | ✅ Yes | ❌ No | ❌ N/A | ✅ Yes |
| Revenue Tracking | ❌ Basic | ❌ No | ❌ No | ❌ No | ❌ No | ✅ Basic | ✅ Core feature |
| Data Integrations | ✅ Amplitude, Mixpanel, GA, HubSpot | ✅ Multiple | ✅ Extensive | ✅ Extensive | ✅ Slack + others | ✅ 50+ sources | ✅ Multiple |
| Learning Curve | 🟢 Easy | 🟡 Moderate (technical) | 🟡 Moderate | 🟢 Easy | 🟢 Easy | 🟡 Moderate | 🟢 Easy |
| Best For | Product-led companies | Technical teams | Advanced analytics | Product teams | UX optimization | Reporting automation | Revenue tracking |
| Target Company Size | SMB to Enterprise | Mid-market+ | Enterprise | All sizes | Mid-market+ | SMB to Mid-market | All sizes |
| Pricing | $299/month+ | Custom (est. $3,600/year) | Free – Custom | Starts at $0 (usage-based) | Custom pricing | $49/month+ | Free (<$10K MRR) – Custom |
| Free Plan | ❌ No | ✅ 10K sessions/month | ✅ Starter plan | ✅ 1M events/month | ✅ Free plan | ✅ Free plan | ✅ Free (<$10K MRR) |
| Implementation Time | 🟢 1 day | 🟡 Few days | 🟡 1-2 weeks | 🟡 Few days | 🟡 Few days | 🟢 Quick | 🟢 Quick |
| Technical Expertise Required | 🟢 Low | 🔴 High | 🟡 Medium | 🟢 Low | 🟢 Low | 🟡 Medium | 🟢 Low |
Product and user behavior SaaS analytics software for SaaS
Product and user behavior SaaS analytics tools provide you with insights that can help you monitor a user’s journey to conversion, identify bottlenecks and disengaged users, and track the customer experience and health scores for each of the segments.
To help you decide which one is the right fit for your business, we’ll go into each SaaS analytics software’s main analytics features and pricing.
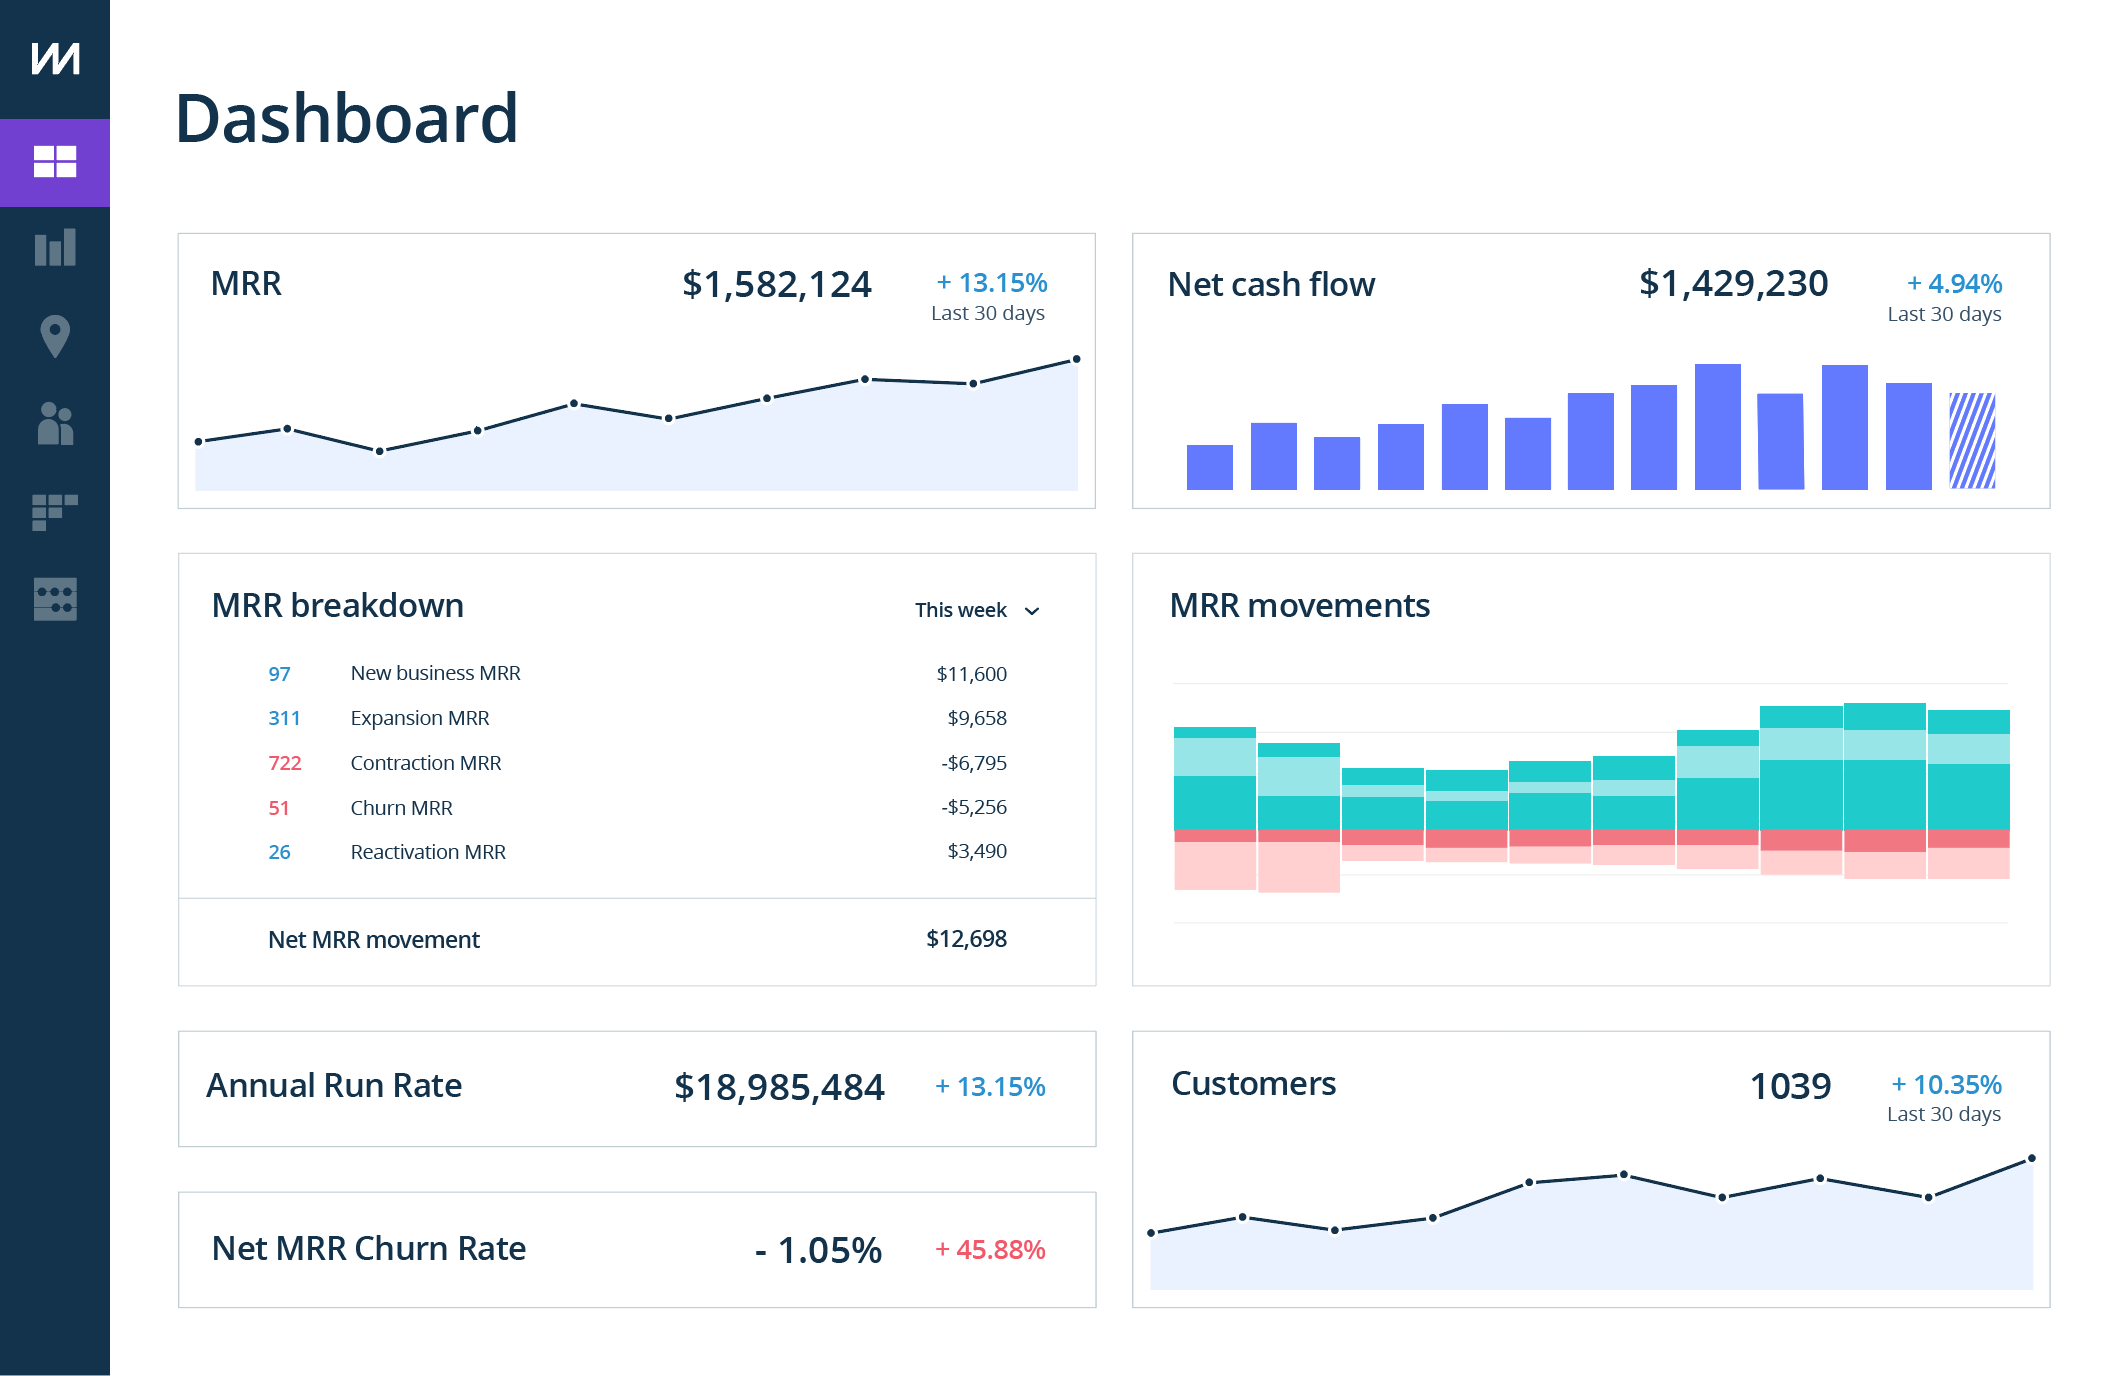
1. Userpilot: SaaS analytics tool for advanced analytics and product adoption
Userpilot is a SaaS analytics platform that drives user activation, feature adoption, and expansion revenue. It also helps product teams collect user feedback, streamline onboarding, and gather actionable insights from analytics.
With Userpilot, you can track product usage and collect user behavior data to get a holistic view of how customers use your product, which will guide future development, improve the user experience, and inform your growth efforts.
How Userpilot helps your teams as a SaaS analytics software
When teams evaluate analytics software, the real question isn’t about features; it’s how fast you can move from data to decisions.
Here’s how we built Userpilot to help you do that:
- Cross-platform analytics. We built Userpilot to track behavior across platforms so you don’t lose context when users switch devices or environments. Instead of fragmented data streams, you get a single, continuous view of each user’s journey. For example, you will know if your re-engagement emails help bring back churn or inactive users.
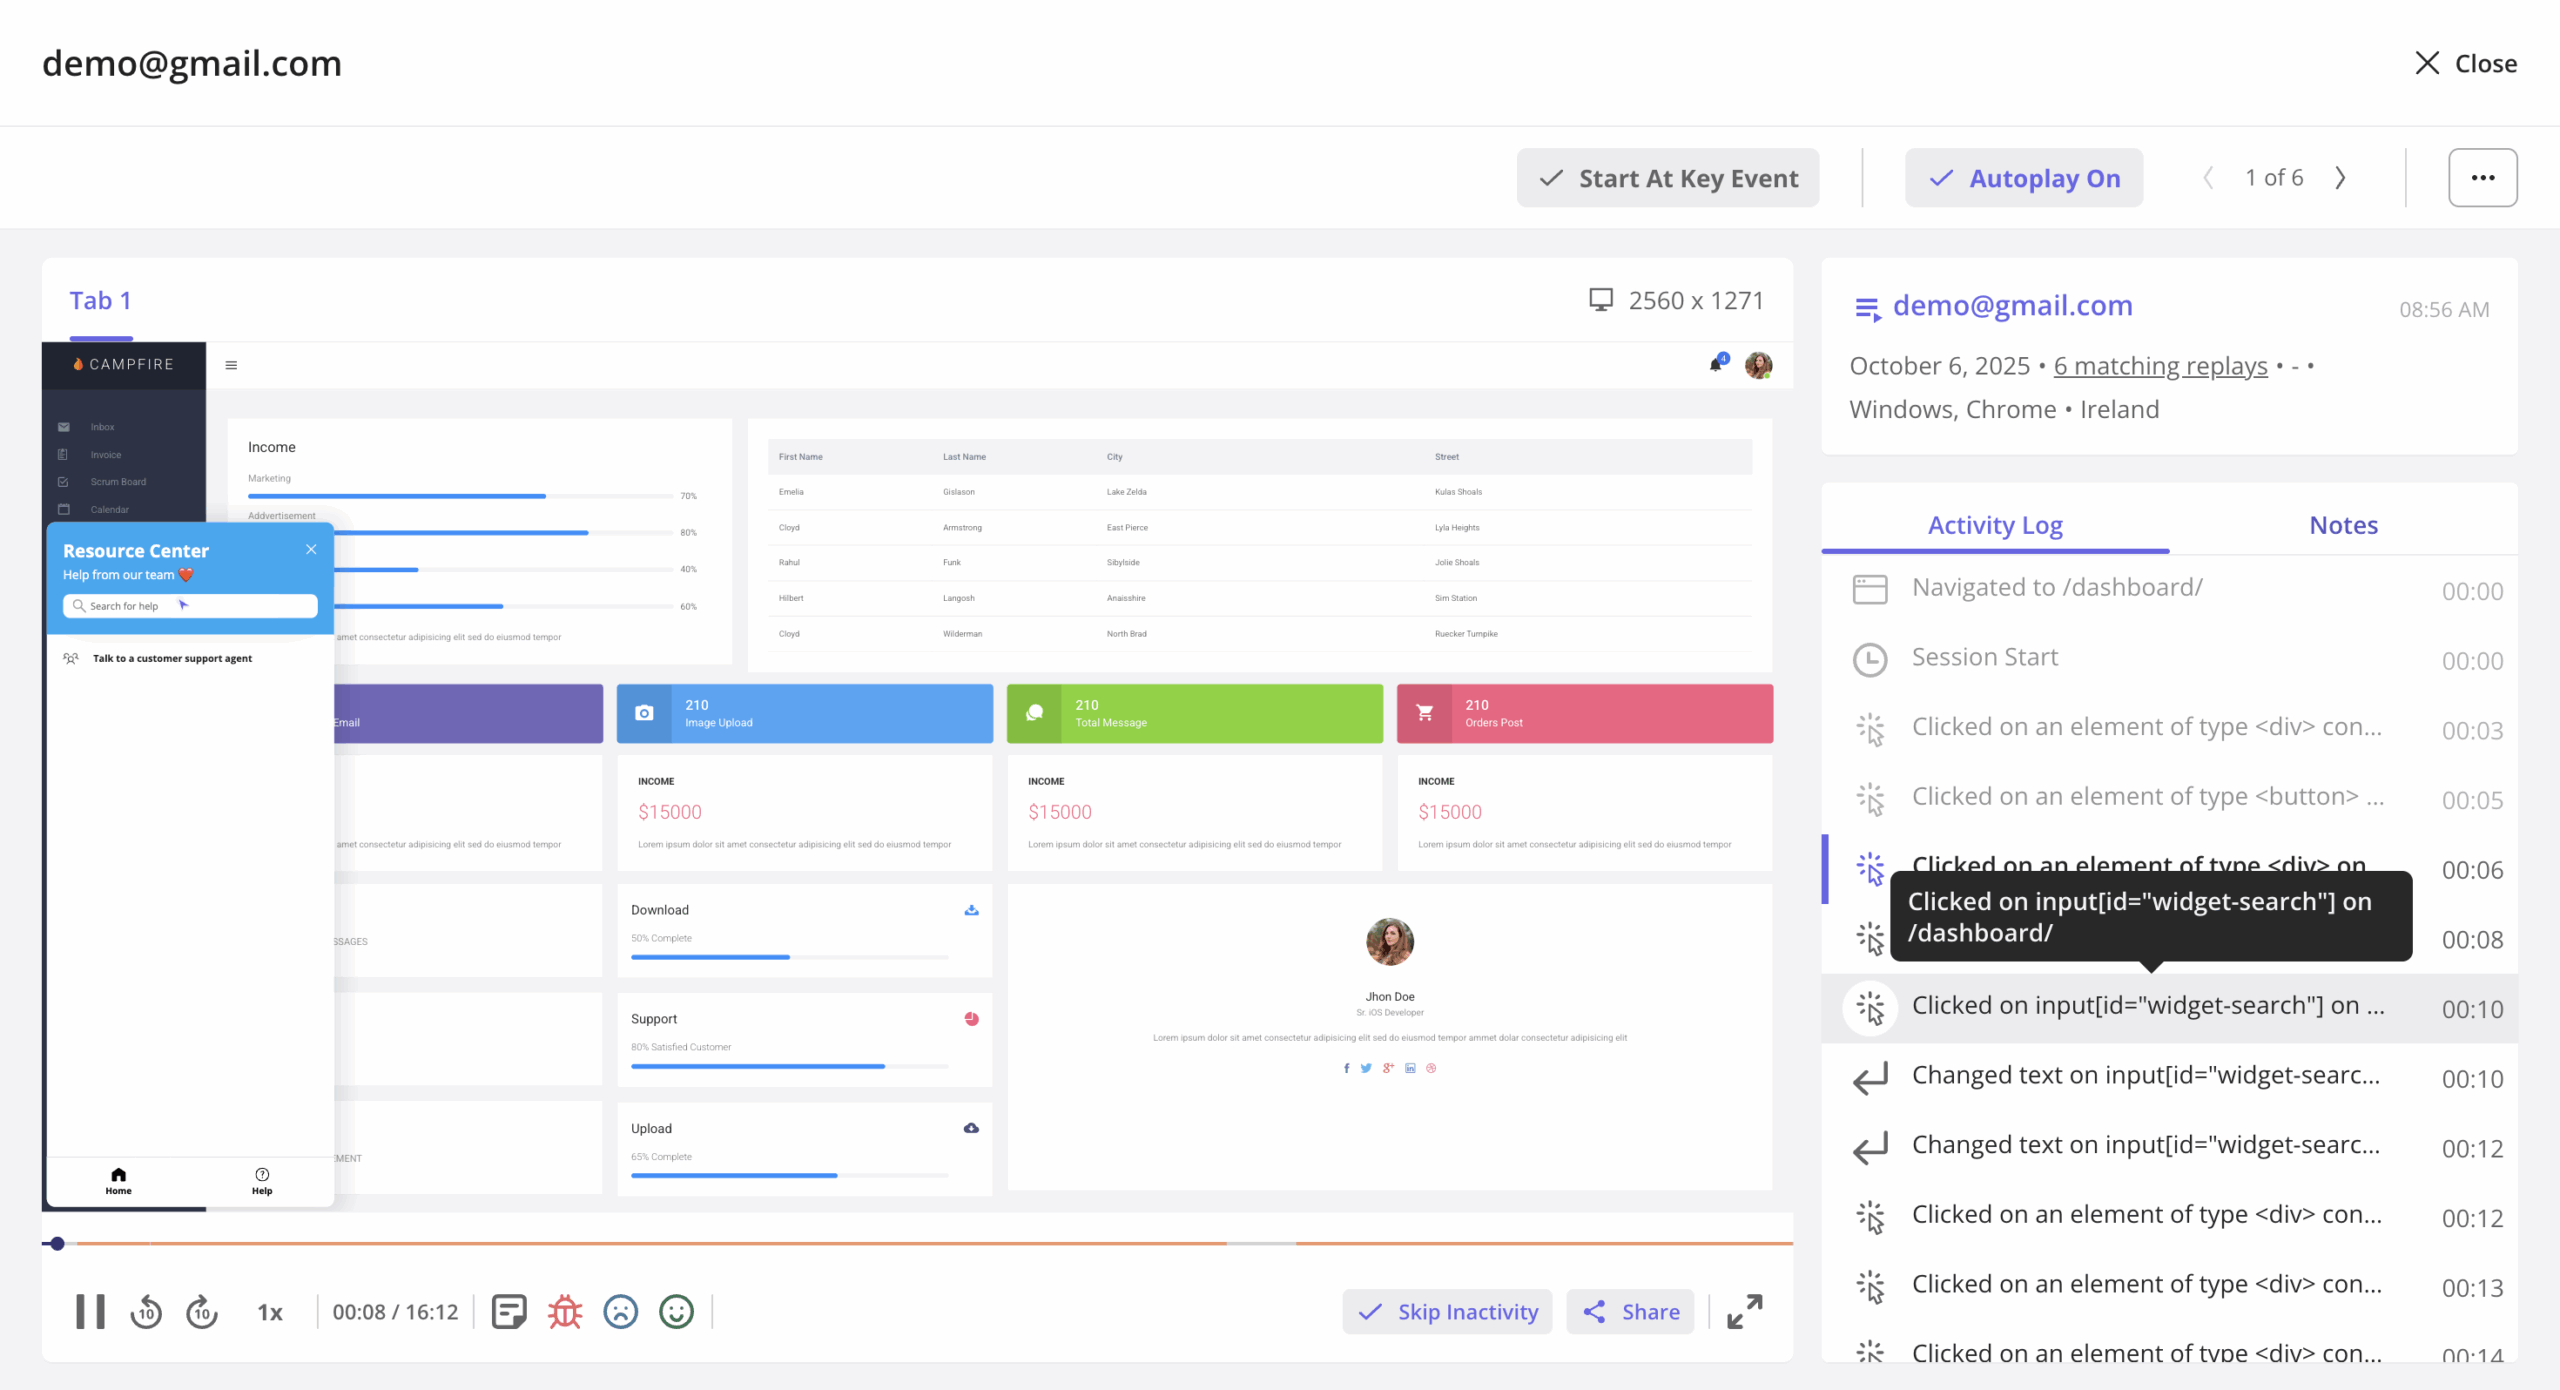
- Understand users at a granular level. Every data point ties back to a user, so you can keep tabs on your users, especially the high-value ones. Autocapture collects interaction data with minimal setup, user profiles give you behavioral context, and session replay shows you how those moments actually unfolded.
This structure exists so you can:
-
- Go from a metric drop to the specific users behind it
- Understand behavior patterns and feature usage by role, plan, lifecycle stage, or segment
- Validate assumptions by watching how users experience your product
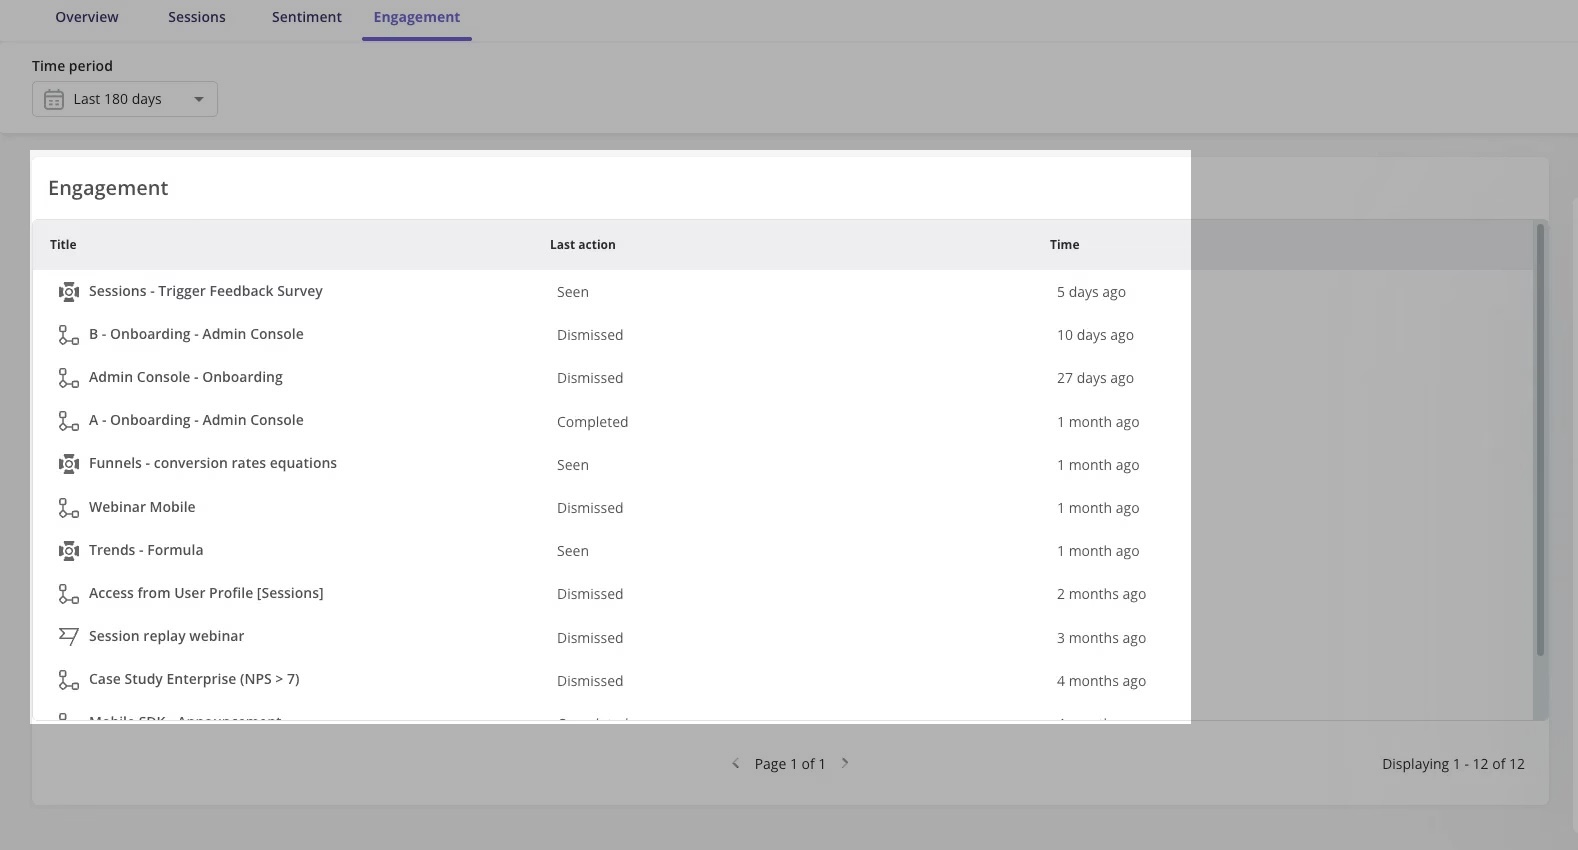
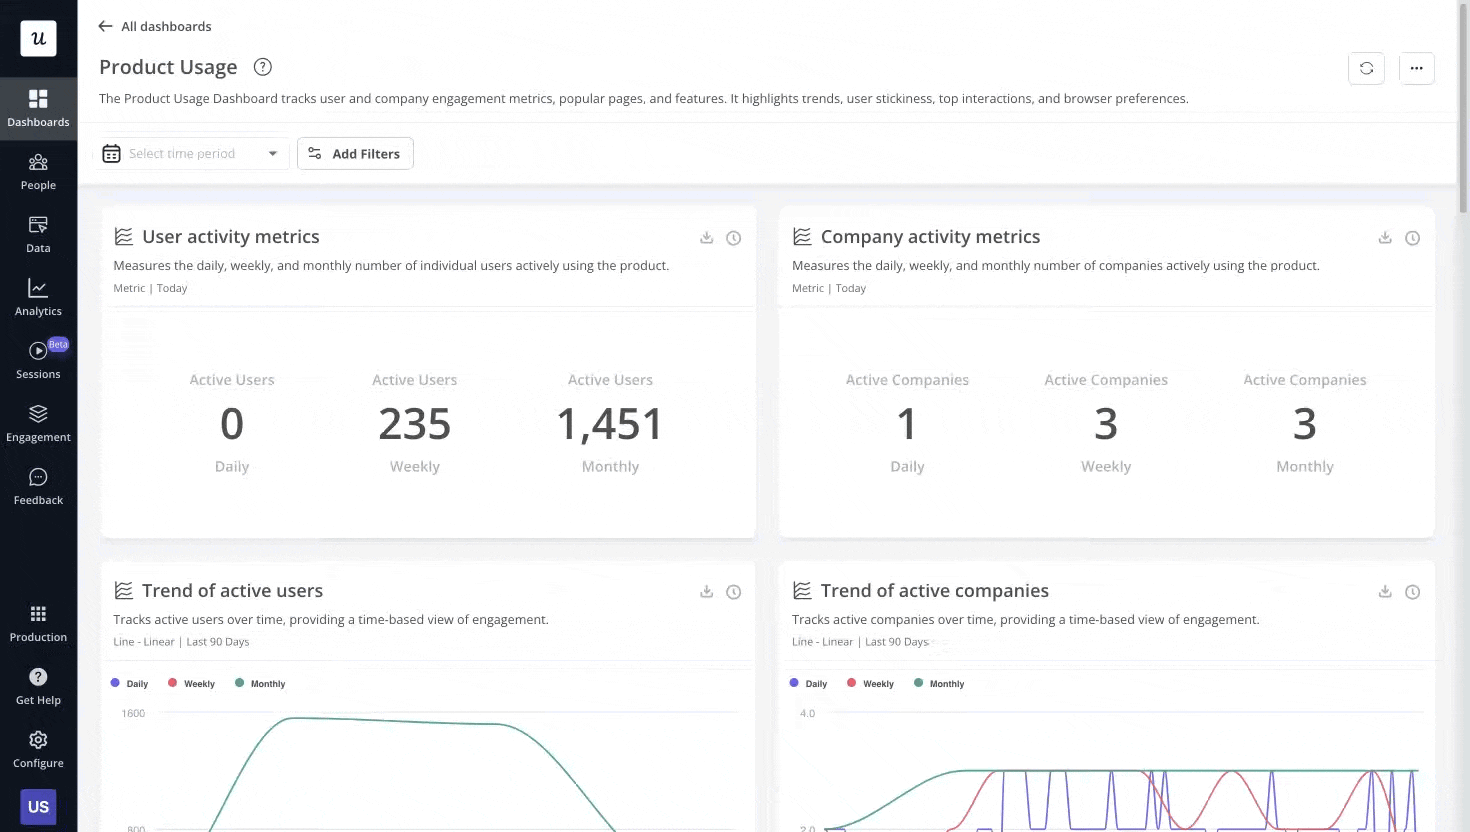
- Track all SaaS metrics in one place. We provide 4 pre-built dashboards covering product usage, feature adoption, activation, and retention. You can also build custom dashboards with our funnel, path, trend, and cohort analysis tools. Everything updates in real-time without needing SQL or engineering support.
- Debug UX issues with a complete workflow. You can investigate UX issues without leaving your analytics workflow. Reports, user lists, session replay, and surveys all work together by design.For example, you want to understand why new users drop off. You can start by running a path analysis.
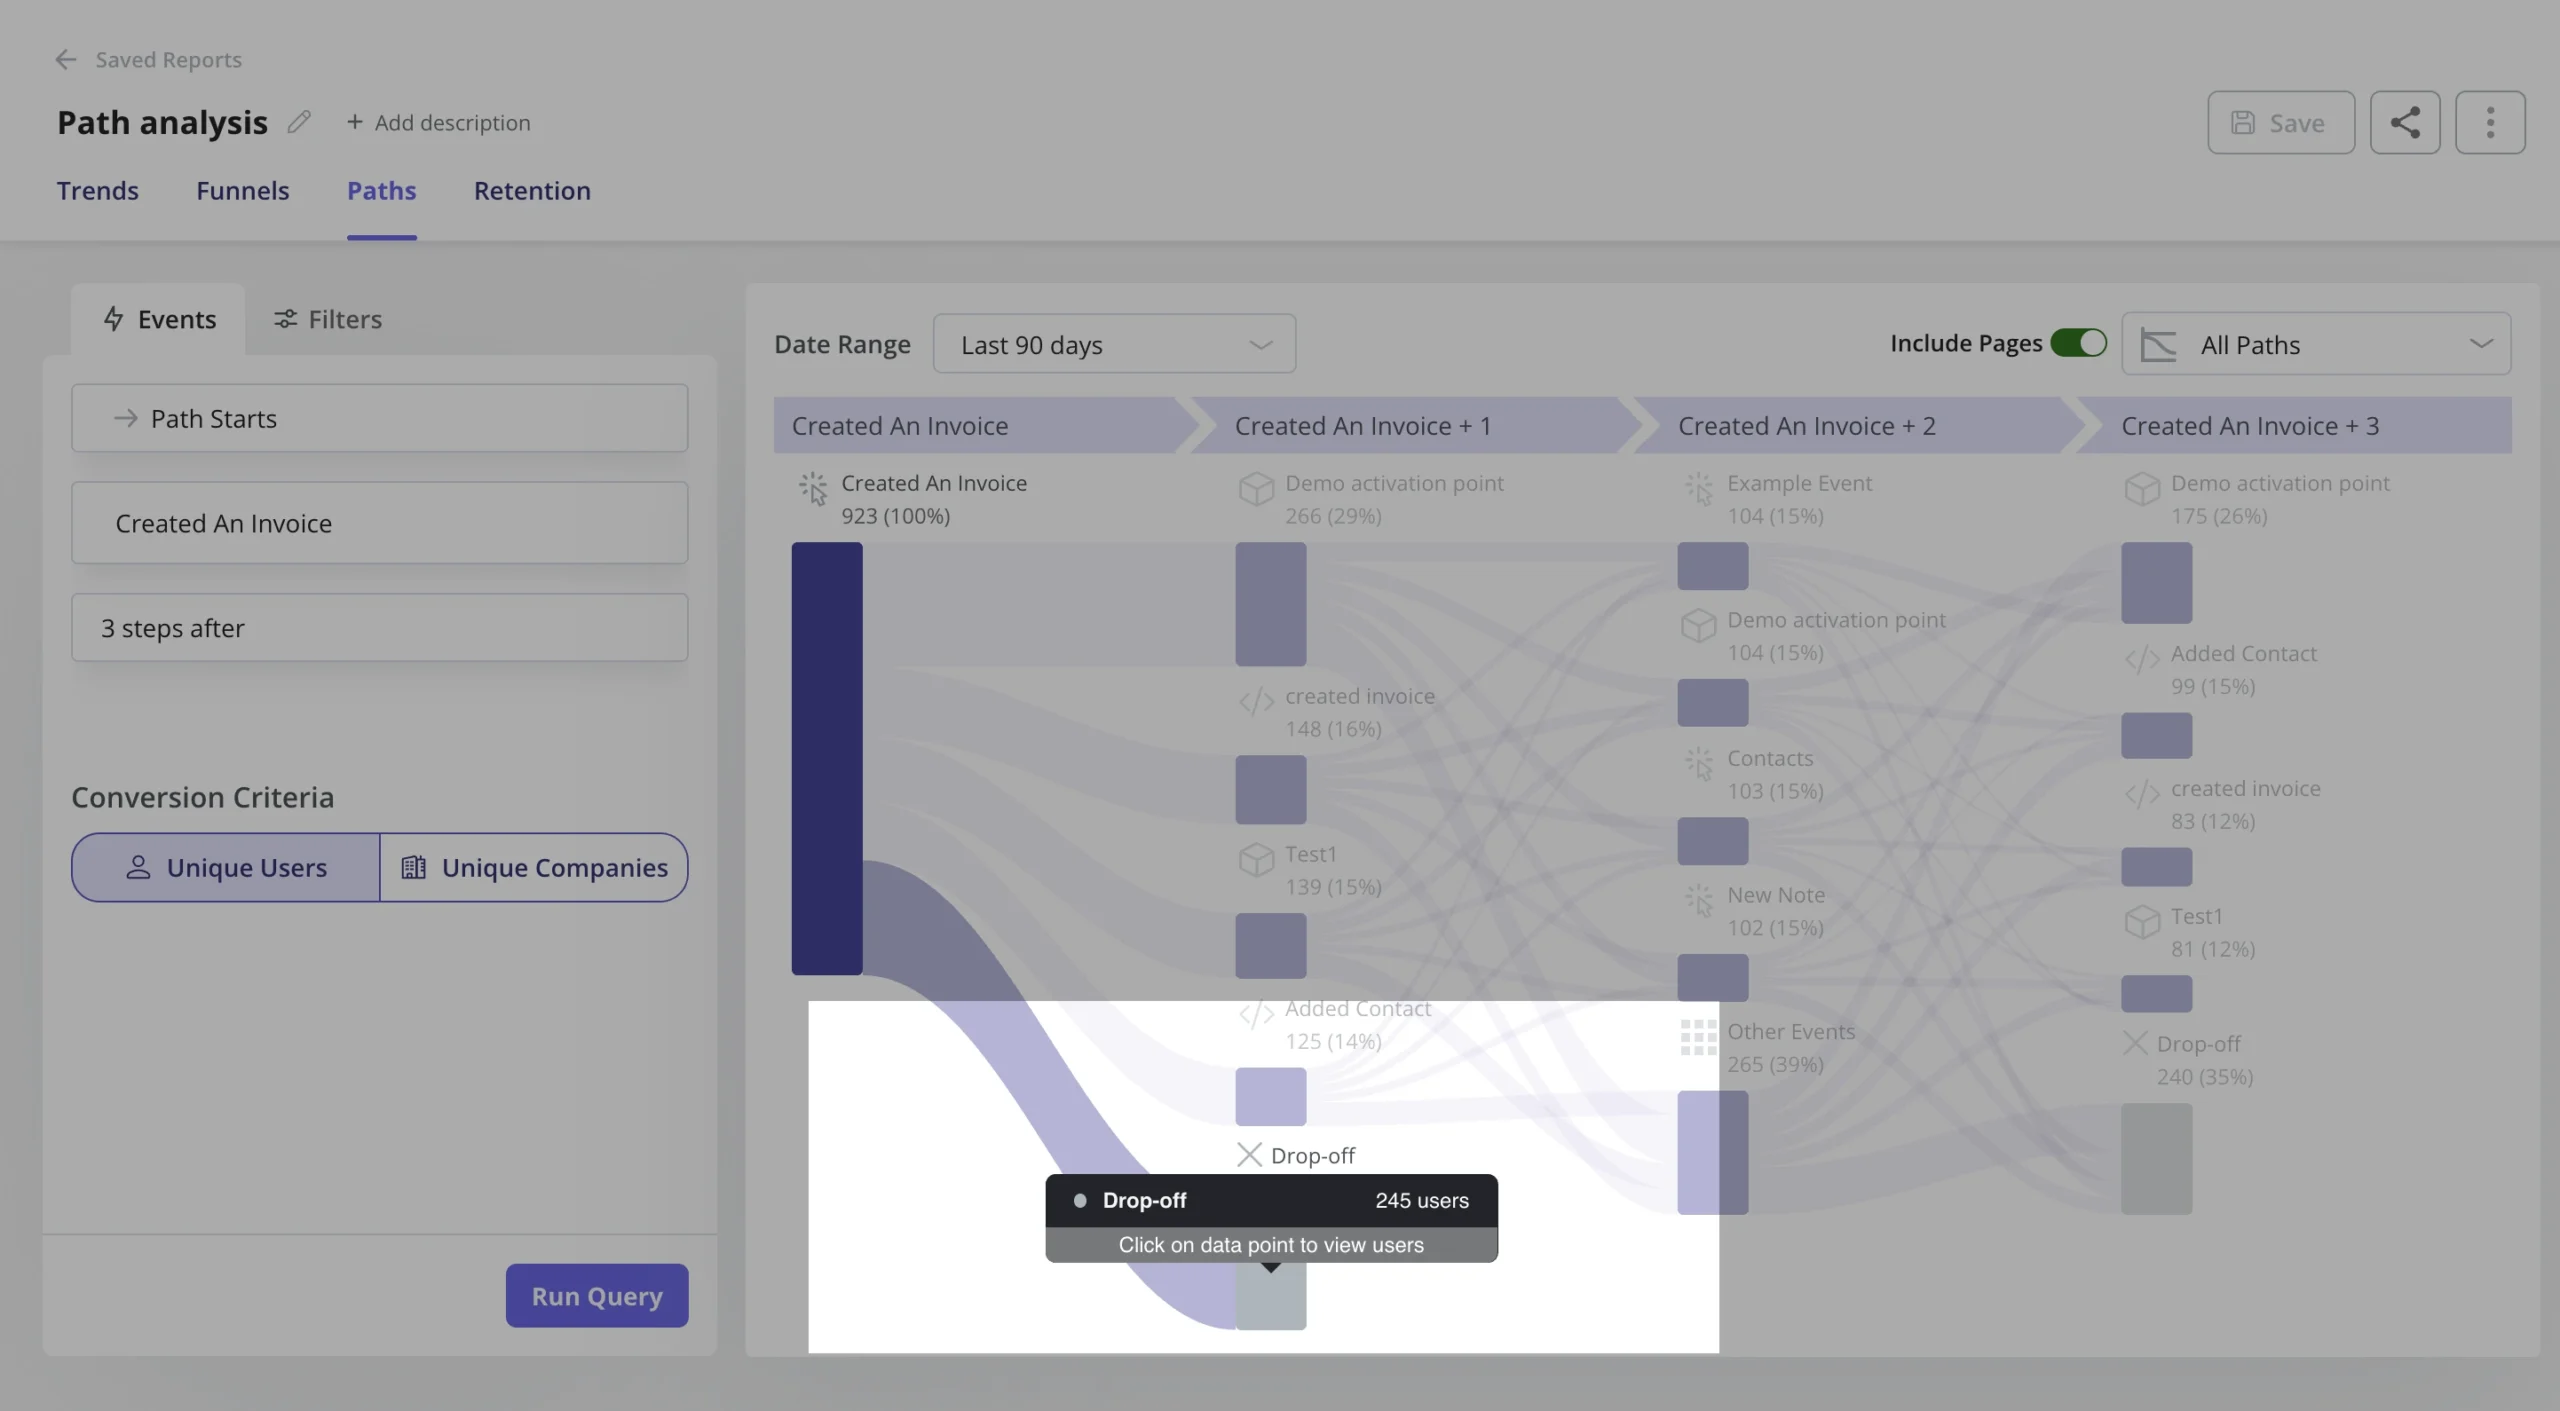
As you spot the drop-off path, you can pull up the user list, watch 5-10 session recordings to identify common friction points. Then, you can even go as far as triggering a targeted microsurvey at that exact step, asking other users for more insights.
Why SaaS product teams choose Userpilot
You choose Userpilot for analytics when you’re tired of seeing product data split across tools, teams, and dashboards that never agree.
We built Userpilot to be an all-in-one product insights hub, so you can centralize product behavior data, reduce guesswork, and move faster without depending on engineering for every tracking request.
For example, before switching to Userpilot, teams at Amplemarket dealt with fragmented tooling and slow, unscalable tracking, where “it took at least two weeks” to get event tracking delivered by engineering. Now, it just takes 5-10 minutes.
“The no-code event tracking was a huge “aha! moment” for the whole product team. It was almost unbelievable how we could have a new event live in 5-10 minutes without a single line of code.” — Awni Shamah, Staff Product Manager at Amplemarket
The benefit also comes from how Userpilot helps you uncover insights that numbers alone can’t explain.
That’s how Amplemarket uses Userpilot after every launch. Their team pairs adoption data with session replays to validate whether new features work as intended.
“We release a lot of new features and improvements every week. Without a way to see what’s happening with the product, things simply break. Session replays are a huge lifesaver. Whenever a new feature is released, we watch 10-15 session replays to understand how it works. It made our product designers 80-90% more confident in developing new solutions.” — Awni Shamah, Staff Product Manager at Amplemarket
Pricing
Userpilot’s pricing ranges from $299/month (billed annually) on the entry-level end to an Enterprise tier for larger companies.
Furthermore, Userpilot’s entry-level plan includes access to all UI patterns and everything that most mid-market SaaS businesses need to get started.
Userpilot has three paid plans to choose from:

2. Heap: SaaS analytics tool for user behavior insights
Heap is a robust SaaS analytics software that provides users with a plethora of in-depth insights into customer behavior and needs. Insights from Heap help you dig deeper into the paths users take when navigating your product and identify precise points of friction.
Main features for SaaS analytics
Heap offers several features to help you track user actions, behavior, and properties. It lets you dig deeper into how users navigate your product and interact with different elements on a page.
The particularly useful features include:
- Tracking various user sessions and filtering the data based on date range and other parameters. It’s also possible to export the data into a CSV file or Google Sheets.
- Heatmaps (Clickmaps, Scroll Depth, and Attention Maps) to understand user intent, identify points of friction, and improve UI.
- Funnels, Journey Maps, Engagement, and Retention analysis features for a more detailed look at user behavior.
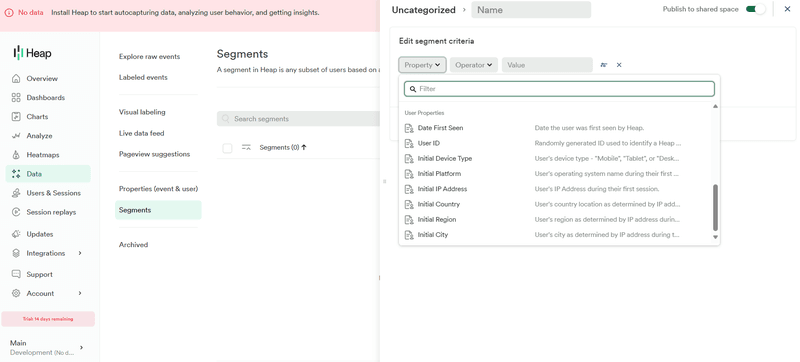
- Segmenting users into different groups and filtering all kinds of data for each segment. Loads of segment criteria are offered by Heap too.
However, while it’s easy to install the tracking code and configure Heap, navigating its features requires a bit of technical expertise. If your team members come from non-technical backgrounds, they might struggle to use Heap to the fullest.
Unlike Userpilot, Heap doesn’t have features that allow you to act on data, i.e., triggering in-app help for churning users.
Pricing
Pricing for Heap is available on request. You’ll have to contact the sales team for a quote. The final price will depend on various factors, including the number of sessions and integrations you need.
That said, Heap offers a free plan that lets you track up to 10,000 user sessions per month and stores your data for 6 months. Review platforms like G2 say that paid plans start at $3,600 per year. All paid plans come with a 14-day free trial, too.
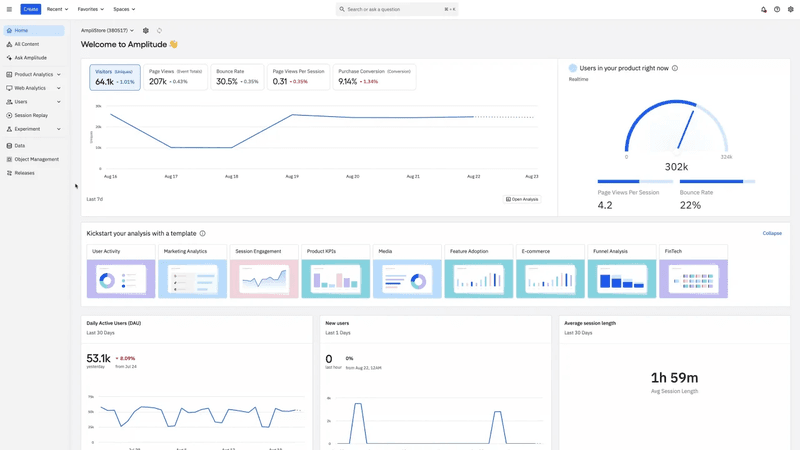
3. Amplitude: SaaS analytics tool for user journey behavior tracking
With Amplitude, you can take a deep dive into user activity and behavior. You can generate relevant reports to identify patterns and actionable insights based on user data.
Main features for SaaS analytics
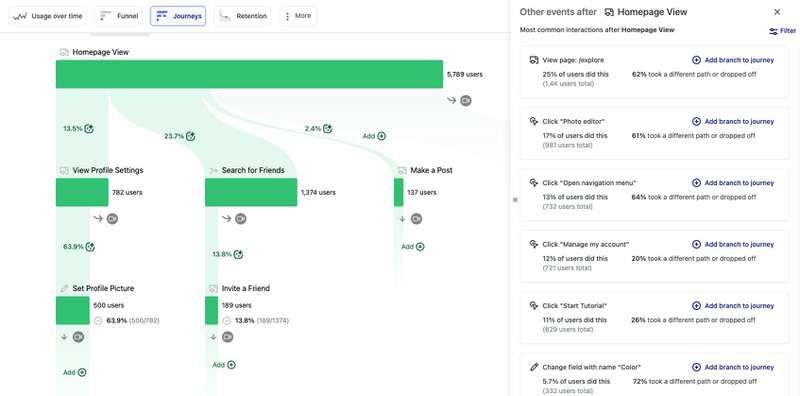
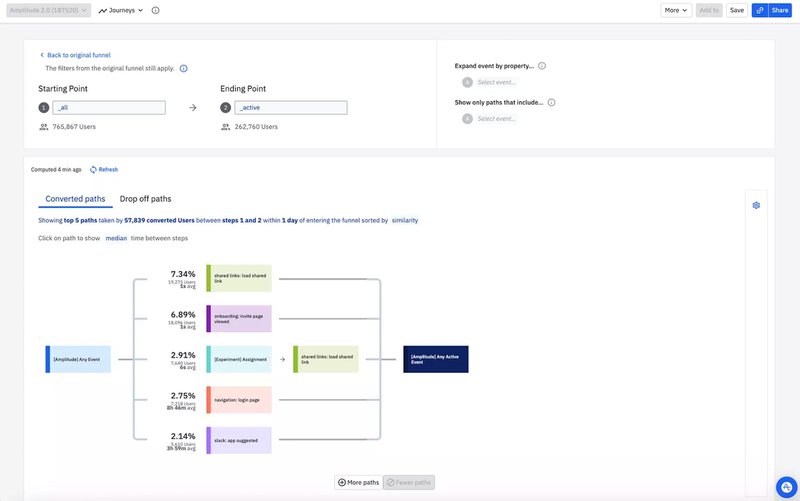
The Journeys dashboard on Amplitude packs a few useful features that facilitate conversion path analysis. These include:
- Pathfinder – It provides a glimpse of the paths users take within your product leading up to a conversion.
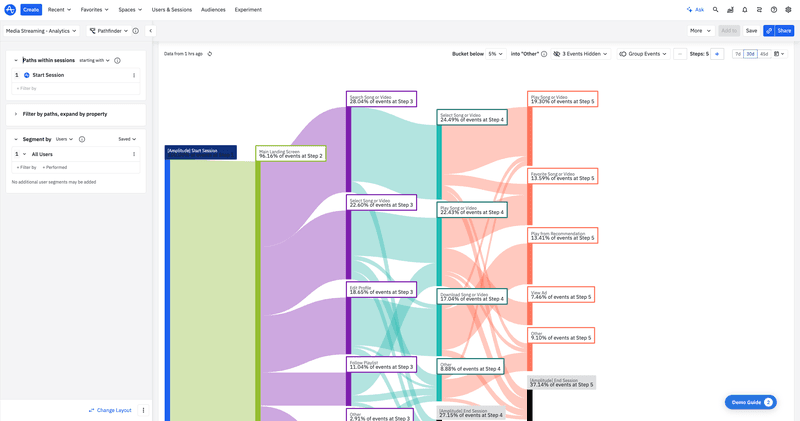
- Top user paths – It lets you identify the paths users are most likely to take. This insight can help optimize user interactions at key touchpoints and drive retention.
- Journey map – Available in the premium tiers, this feature offers a detailed overview of common user paths. You can track metrics like the average time taken to complete a path or the number of times users took a path to find the most commonly used paths by users.
Besides tracking user journey activity, the following functionalities of Amplitude help you conduct advanced behavioral analytics:
- Retention and stickiness analysis
- Predictive analytics
- A/B testing
- Funnel analysis
With detailed reports available for each, you can understand your users better and provide them with exactly what they want, leading to a better user experience.
Pricing
The Amplitude pricing structure is as follows:
- Starter – Free plan.
- Plus – $49 per month.
- Growth – Custom pricing.
- Enterprise – Custom pricing.
4. Mixpanel: tool for tracking product analytics metrics
Mixpanel is a simple and powerful product analytics tool that allows product teams to track and analyze in-app product engagement.
In addition, it lets you explore data freely without using SQL. Set up your metrics to measure growth and retention. Slice and dice data to uncover trends and see live updates on how people use your app.
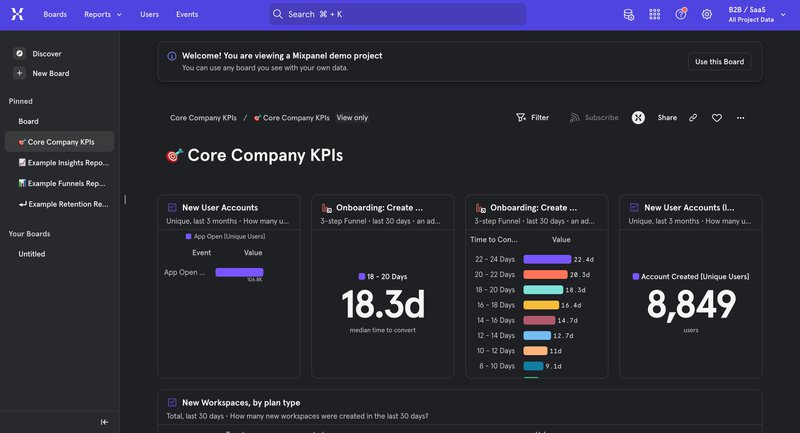
Main features for SaaS analytics
Mixpanel supports both mobile and web apps, and it’s an analytics tool of choice for product teams across the globe, regardless of the company size.
Its product analytics functionalities work based on:
- User segmentation: User segmentation is the bedrock of effective product analytics in Mixpanel. You can divide your user base into distinct groups based on attributes, behaviors, or properties and uncover meaningful trends and preferences among various user groups.
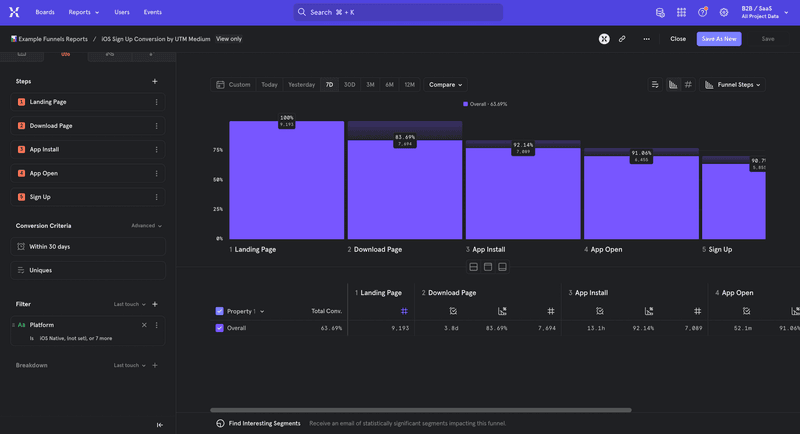
- Funnel analysis: Mixpanel’s funnel analysis feature allows you to create sequences of events that users should ideally complete. This helps you gain insights into where users drop off and where they progress.
- Retention analysis: With the retention analysis feature, you are able to track how often users return to your application after their initial interaction.
Mixpanel offers a free plan with very advanced product analytics functionality but no engagement layer or feedback features like that of Userpilot.
Pricing
Mixpanel’s pricing plan is divided into 3 plans; the starter plan, the enterprise plan, and the growth plan.
Here’s an overview of the pricing plans and features of each plan:
- Starter plan: This plan features essentials to find product-market fit. It is free and allows up to 20M monthly events.
- Growth plan: This plan costs $24 per month for up to 100M monthly events. You get all features in the starter plan plus unlimited saved reports to monitor, update, and iterate on KPIs, Mixpanel modeling layer, and group analytics and data pipeline add-ons.
- Enterprise plan: This plan has custom pricing.
5. FullStory: SaaS analytics tool for collecting qualitative data
Measuring clicks and creating segments help you answer the question “what”, but it doesn’t tell you why.
If you want to go deeper into the reasons behind every action your user takes, you have to witness it firsthand. This is where session recording tools like FullStory prove their worth.
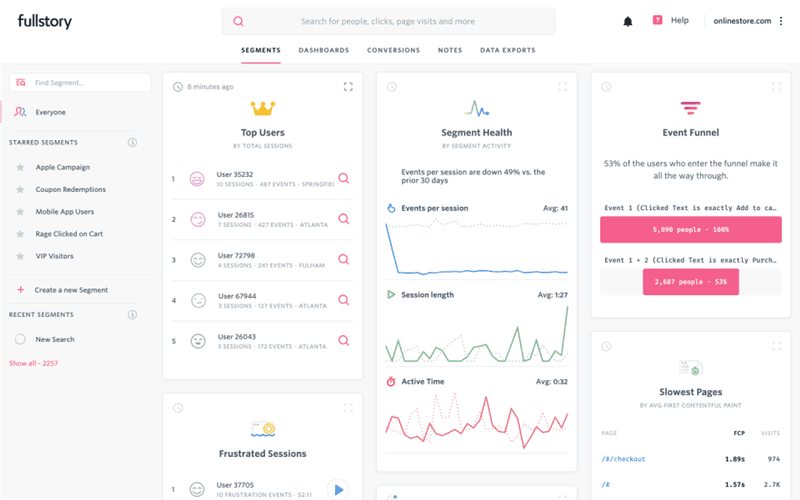
Main features for SaaS analytics
With FullStory, you can track user interactions and create funnels. You can then observe how your users behave in each funnel.
FullStory combines qualitative and quantitative data sources, including session recordings and product analytics. This gives you more valuable insights into understanding the causes behind specific user actions when compared to standalone quantitative data analysis.
It records page views and visitor clicks, as well as incorporates user data to give you the most accurate representation possible while recreating user sessions.
FullStory’s AI and machine learning features make extracting accurate insights from your data much easier. It also offers dashboards that you can use for visualizing KPIs like conversion rates after tracking and calculation.
If you’re collaborating with your team on a project, you can use FullStory’s Slack integration to easily share user sessions with your teammates.
Pricing
FullStory doesn’t disclose its pricing information on its website. It does have 3 price plans: Enterprise, Advanced, and Business (free trial available). You can get a quote for these plans by contacting their sales team.
SaaS analytics software for revenue and reporting
All of the analytics tools discussed so far help you track user activity and marketing channels.
But what about your finances and company health?
At the end of the day, all the customer segmentation, funnels, user feedback, and UX improvements boil down to one question: Is it bringing in more revenue?
Reporting and revenue analytics tools like Coupler.io and ProfitWell can help you gauge the impact your product and marketing activities have on your finances.
6. Coupler.io: for automated SaaS reporting
Continuously tracking your SaaS metrics and analytics is the key to implementing data-driven marketing approaches.
To promptly identify issues when metrics decline, having all the essential data within your reach is important. This is when automated SaaS reporting comes in handy.
Coupler.io is an all-in-one data analytics and automation platform that allows you to visualize your SaaS metrics and create custom dashboards and reports.
Main features for SaaS analytics
This tool helps you gather data from various channels and apps, such as HubSpot, Facebook Ads, Trello, Google Analytics, and more. Then, you can fetch it into spreadsheets, business intelligence tools, data warehouse, or other destinations of your choice.
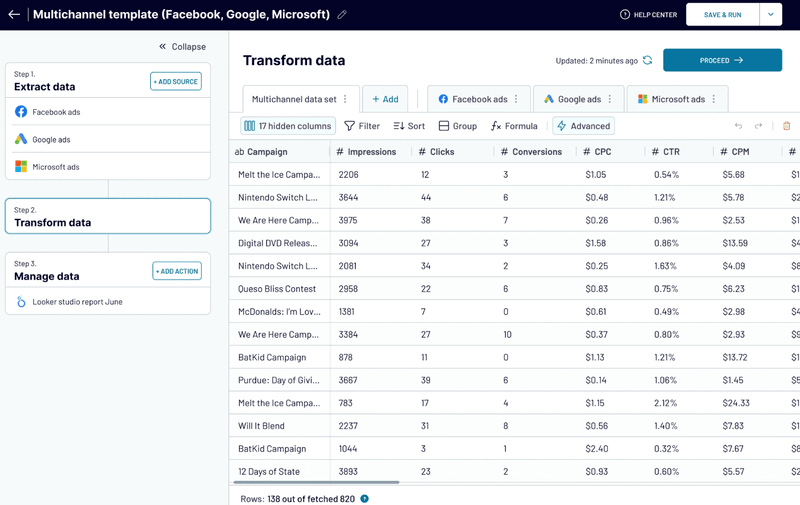
The reports are easy to share and can be delivered to your email or Slack notifications on your schedule. You can also set trigger alerts to get notified when any of your metrics change.
It allows you to be flexible and tailor your dashboards and reports. You can also start with one of the available templates or reporting dashboard examples.
Pricing
Coupler.io offers 5 pricing tiers based on the number of accounts, users, data destinations, and data refresh frequency. Paid plans range from $32 to $259/month, plus a custom Business plan.
The platform offers a free plan with limited features (1 account, 1 user, manual refresh). There’s also a 7-day free trial with full access to test the tool’s advanced features.
7. ChartMogul: Software for subscription revenue analytics
ChartMogul is a comprehensive subscription analytics platform that allows you to track your recurring revenue, customer metrics, and many common SaaS metrics.
Main features for SaaS analytics
ChartMogul’s real-time analytics and reporting tools allow you to keep track of essential subscription metrics with high data accuracy.
The platform automatically calculates key metrics including:
- Monthly Recurring Revenue (MRR) and all MRR movements (new, expansion, contraction, churn)
- Annual Recurring Revenue (ARR) and customer lifetime value (LTV)
- Customer, revenue, and quantity churn rates
- Retention cohort analysis and customer growth metrics
- Average Revenue Per Account (ARPA) and Average Sale Price (ASP)
ChartMogul integrates seamlessly with major billing platforms including Stripe, Chargebee, Recurly, PayPal, Braintree, and GoCardless, ensuring data accuracy through automated synchronization. This eliminates manual data entry and provides a single source of truth for your subscription metrics.
Pricing
ChartMogul offers pricing based on your Annual Recurring Revenue (ARR). Free plan for businesses with less than $10K MRR, Scale plan starting at $100/month, and custom Volume plan pricing for larger businesses.
Key SaaS metrics and KPIs to track through your SaaS analytics
Now that we’ve covered different types of web analytics tools, their main functionality, and analytics features, let’s talk about the key performance indicators that every SaaS business should be tracking to increase customer retention.
Average Revenue Per User (ARPU)
The Average Revenue Per User (ARPU) or Average Revenue Per Account (ARPA) denotes the amount of revenue a paying user generates during a specific period.
Like the number of users, revenue generated by each user is an important metric of customer success in SaaS. The goal of product marketing is not only user acquisition but also increasing account expansion, which is measured using ARPU.
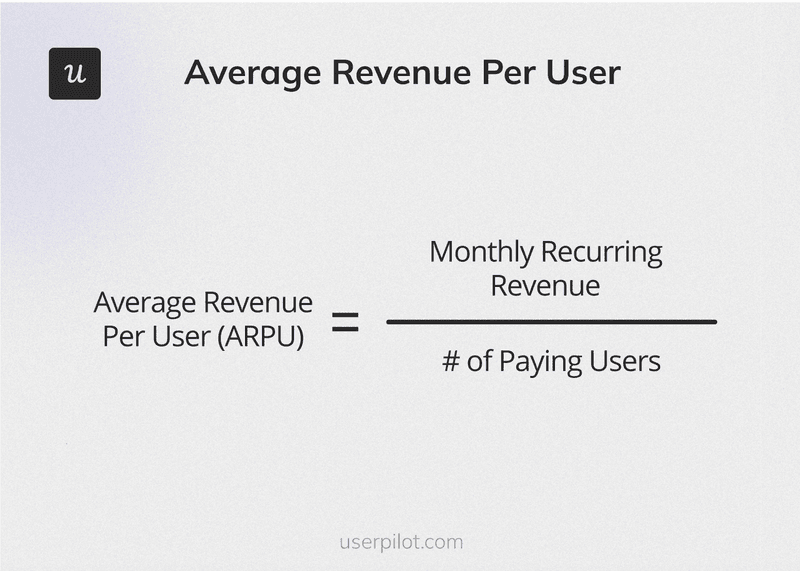
Monthly Recurring Revenue (MRR)
Monthly Recurring Revenue (MRR) is calculated by multiplying the average revenue per account by the number of accounts in a given month.
MRR is the first step to understanding whether your product marketing is driving growth or not.
Annual Recurring Revenue (ARR)
Annual Recurring Revenue (ARR) is similar to MRR, except it considers a year instead of a monthly interval.
Keeping an eye on both MRR and ARR helps you understand whether or not your efforts are generating sustainable results.
Expansion MRR rate
Expansion MRR rate tells you at what rate you’re growing through account expansion.
The formula for the Expansion MRR rate is:
(Expansion MRR at the end of the month – Expansion MRR at the beginning of the month) / Expansion MRR at the beginning of the month x 100
Where expansion MRR = revenue from upgrades in the month + revenue from add-ons in the month.
Churn MRR rate
The churn MRR rate denotes how much revenue you have lost in a range of time because of churn.
The formula for the Churn MRR Rate is:
(Churned MRR- Expansion MRR) / starting MRR x 100
Where Churned MRR = revenue lost due to churn in a given period.
Customer Lifetime Value (CLV or LTV)
Customer Lifetime Value (CLV or LTV) is the amount of money a business earns from one customer over the duration they stay your customer. It represents how profitable it is to invest in acquiring a customer.
You can calculate LTV in multiple ways.
One way to calculate it is by dividing your average revenue per account by your churn rate.
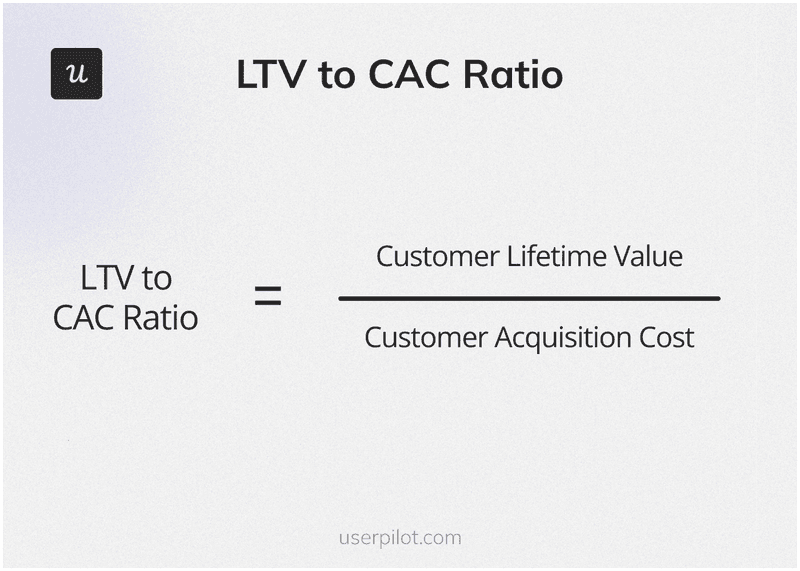
Customer Lifetime Value (LTV) to Customer Acquisition Cost (CAC) ratio
The Customer Lifetime Value (LTV) to Customer Acquisition Cost (CAC) ratio shows how efficient your product marketing is at acquiring customers.
An LTV to CAC ratio below 1 means you are spending more money to acquire customers than the revenue you get from them. This is unsustainable, and no business can support this long-term.
Although there is no magic number, a healthy LTV to CAC ratio in SaaS can be considered as one that is 3 times or more than your cost of acquiring a customer.
Customer Retention Rate (CRR)
You need to look at user retention rates at different intervals. There are multiple ways of calculating user retention rates. Some of these are:
- Day 0 retention rate
- Week 1 retention rate
- 7 days range retention rate
Conclusion
Winning your niche requires you to make the best use of the data you collect. This makes SaaS data analytics tools more valuable than ever.
With the tools we’ve compiled, you can track user footprints at every step of their journey and understand how they are engaging with your product.
To learn more about how you can get started with insights on user activity, book a free demo with Userpilot today!
FAQ
What software is used for SaaS?
In essence, SaaS is a combination of technologies like cloud infrastructure, application software, etc. working together to deliver software over the Internet. The provider manages all the underlying complexity, so you can focus on using the application to analyze your data and gain insights.
What is SaaS in data analytics?
SaaS in data analytics stands for Software as a Service Data Analytics.
Essentially, it means using cloud-based tools to collect, analyze, and understand your data. Instead of installing and maintaining expensive software on your computers, you access these tools over the internet.
Here’s why SaaS is becoming increasingly popular for data analytics:
- Accessibility: You can access your data and analytics tools from anywhere with an internet connection.
- Affordability: SaaS solutions typically operate on a subscription model, making them more cost-effective than traditional software.
- Scalability: Easily scale your usage up or down based on your needs.
- Maintenance: The SaaS provider handles all the maintenance, updates, and security. You can focus on analyzing your data, not managing software.
How to analyze a SaaS product?
To analyze your SaaS product, start with a question to narrow down your analysis. Aside from tracking KPIs directly affecting your business goals, pinpoint the problems you are trying to solve i.e. user retention, adoption, conversion, etc. With a problem in mind, you can easily decide what aspect of the product you should be looking at and what metrics are important to monitor.
About the author