Your Analytics Has a Blind Spot: How AI Agents Are Breaking Event Tracking in 2026


Event-based analytics and the tracking infrastructure most of us built was designed for a specific kind of user. That user is no longer the only one inside your product.
Tools were built for humans, but now AI agents are accessing SaaS products as well.
And they do so through MCP connections, calling APIs and completing tasks without triggering a single click, scroll, or hover event. The schema built for human navigation misses them entirely. Your dashboard looks fine. But your data has a gap.
So, when you’re planning to track events in 2026, you need to account for this traffic segment as well. Here’s all you must know.

Event-based analytics in 2026: What it tracks and why it still matters
Event-based analytics is the process of tracking and analyzing discrete user actions in your product as they happen. Each event captures four components: an event name (like clicked_upgrade_button), a timestamp, a user identifier, and event properties that add context. These include the user plan, which features they interacted with, and how far into their lifecycle they are. Those four components are what separate event data from simple page views.
The shift from page-based analytics to event-based analytics happened for a good reason. Page views tell you where users went; events tell you what they did. For SaaS products, where value comes from feature usage rather than content consumption, this distinction matters at every stage of the funnel.
Google Analytics 4 moved to an event-based model in 2020, reflecting the industry-wide consensus that session-based data is insufficient for understanding product behavior. The limitation of GA4 is that it was built for web traffic analysis, not for the depth of user behavior tracking that SaaS teams actually need.
The case for event-based analytics in 2026 comes down to three things it does that no other approach replicates:
- Behavior over volume: Knowing 1,000 users visited your settings page means nothing on its own. Knowing that 800 reached the billing section and 700 left without updating their payment method tells you where the friction points is, what needs fixing, and which segment to target.
- Real-time response: Event data is live, which means you can trigger in-app guidance or alerts the moment a user hits a drop-off point instead of catching it in a weekly retro when it’s already affected retention numbers.
- Coverage that scales with your product: As you add features, you add events. The underlying structure stays constant while tracking depth grows alongside the product.
How to collect event data for analysis
There are three main ways to feed event data into your analytics setup. Each covers a different slice of user behavior, and most teams end up using all three.
1. Identify Your Tracking Method
Determine the type of user behavior you need to capture with Userpilot. Choose between server-side actions, frontend UI interactions, or multi-step user milestones based on your analytics goals.
2. Implement API-Based Tracking
Capture backend actions like subscription upgrades or data exports by sending the event name, user identifier, and metadata through the JavaScript or REST API. In Userpilot, you can execute this by triggering the userpilot.track("Event Name", { property: "value" }); snippet in your application’s code or sending a POST request to Userpilot’s track endpoint.
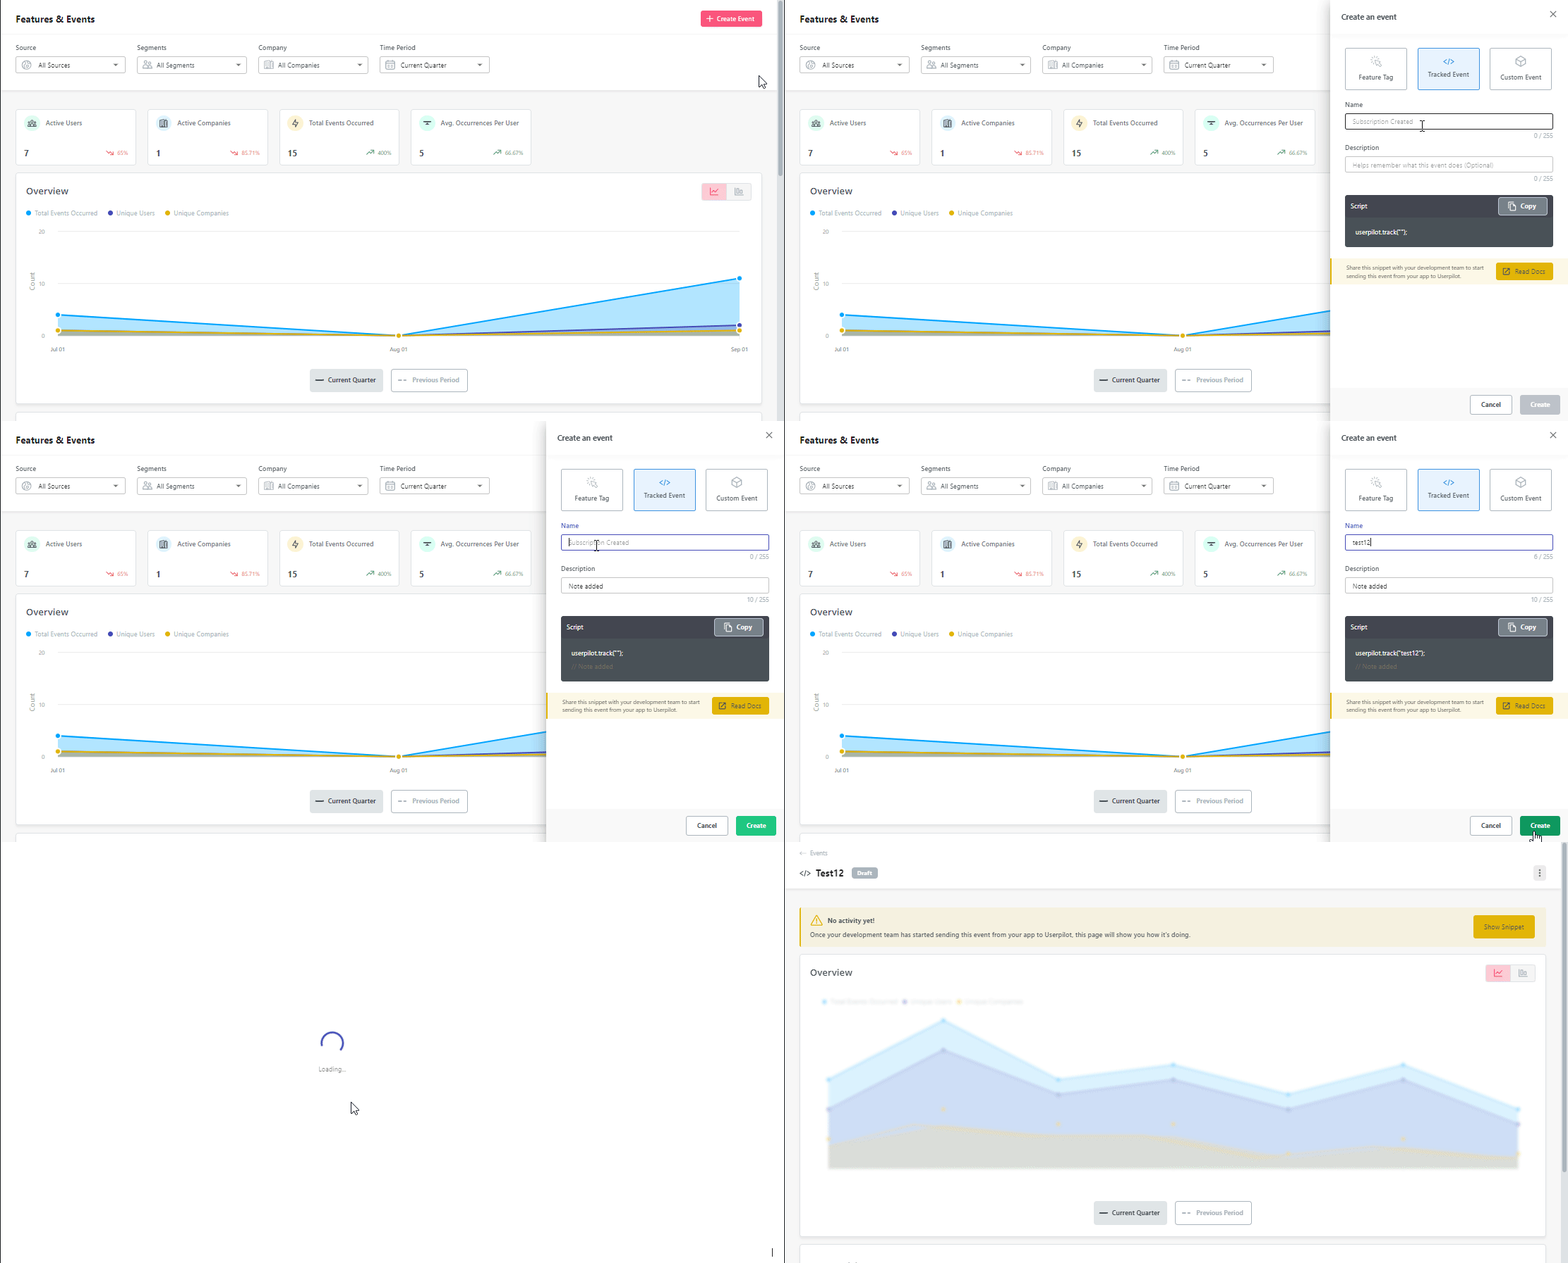
3. Deploy No-Code Click Tracking
It’s possible to track events without coding as well. You can tag buttons, links, and form fields directly within your live product interface for click tracking without engineering resources to track events. In Userpilot, go to Data and Events > Events > Raw Events and click Label Event next to an auto-captured interaction, or open the Chrome Extension Builder to visually point, click, and name the element you want to track.
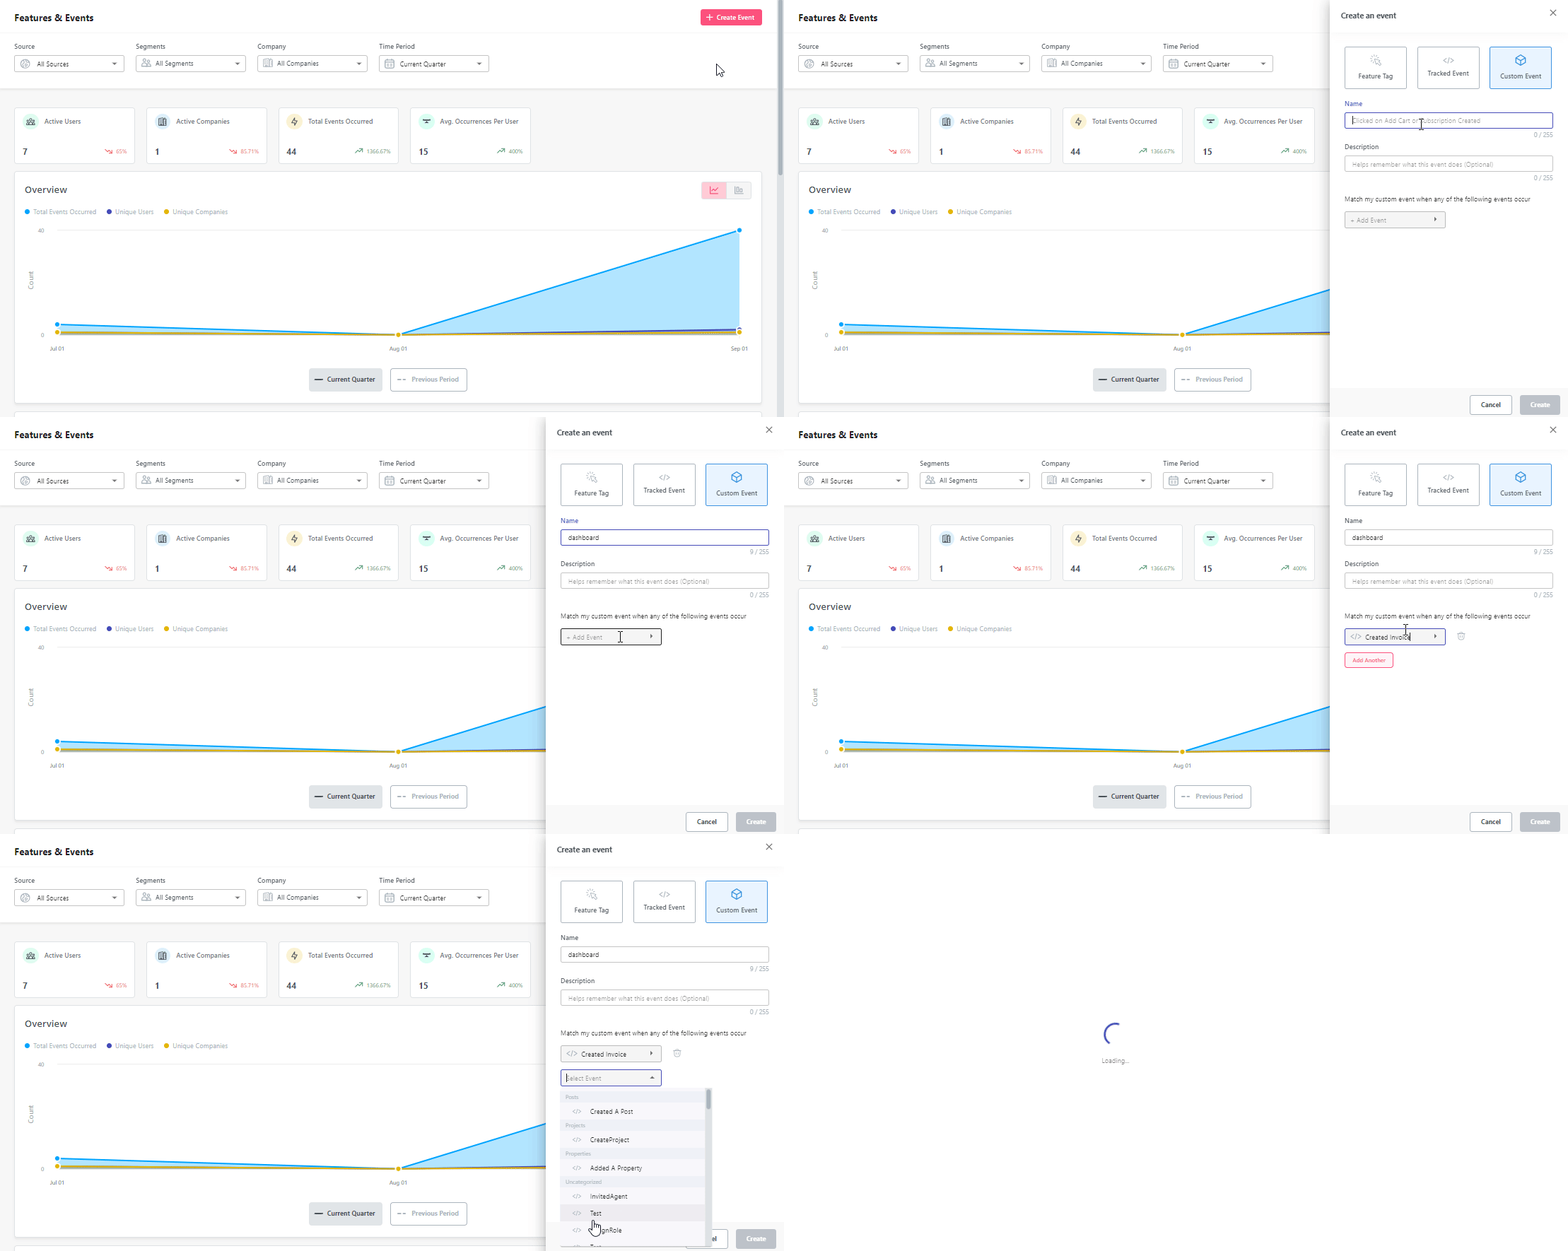
4. Create Combined Custom Events
To bundle multiple related interactions, such as setting a profile picture and inviting a teammate, you can create a single custom event. In Userpilot, navigate to your Events Dashboard, click Create Event > Create Custom Event, and use AND/OR logic filters to group your existing tracked and labeled events into a unified step for in-depth funnel analysis.
Use cases of event-based analytics
The work that actually drives product decisions happens when you apply insights from event-based analytics to a specific question. These are the five use cases where event-based analytics consistently changes how product teams operate.
Funnel analysis to find and fix drop-off points
Funnel analysis chains together a sequence of events and shows you where users are falling off the path to conversion. You pick the outcome you care about, such as activation, upgrade, or drive feature adoption, and set up the steps leading to it. The funnel shows you exactly which step is leaking users, and by how much. From there, you can diagnose whether the problem is a UX issue, a messaging gap, or a missing capability.
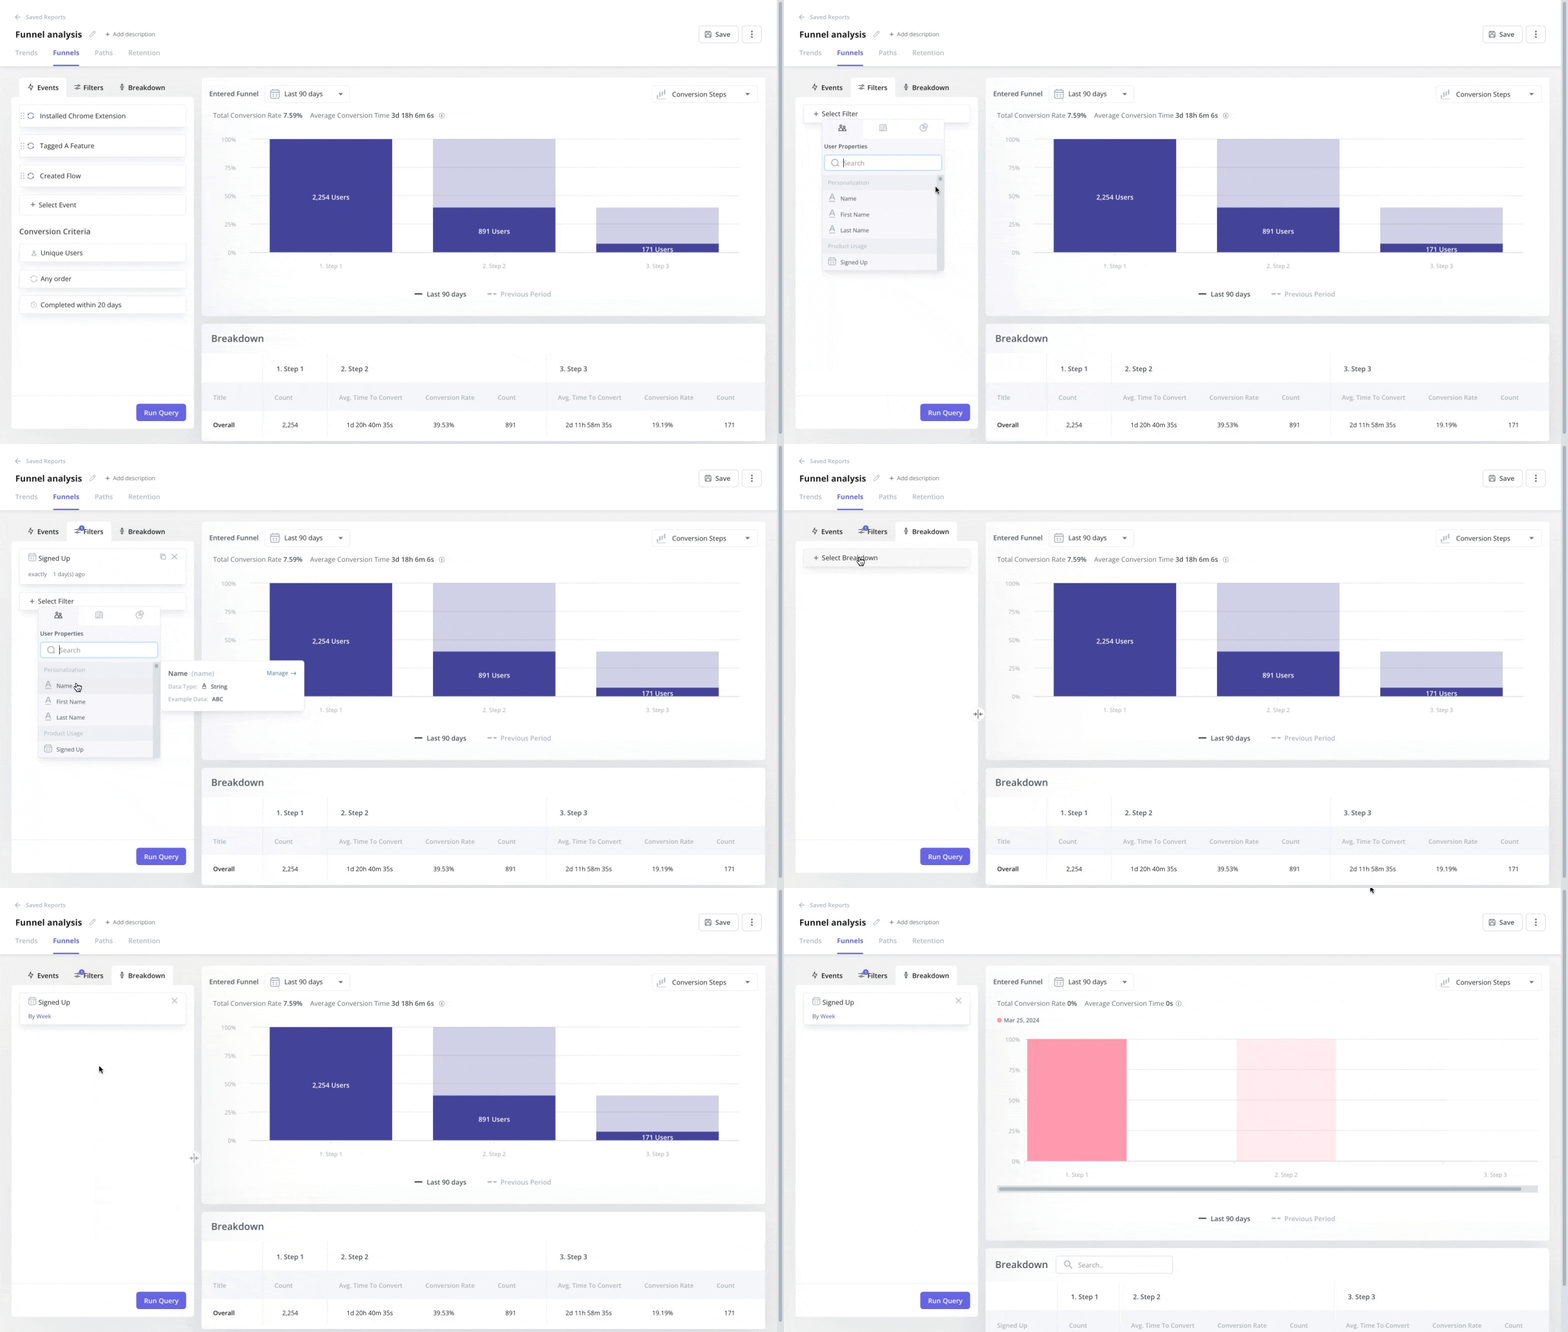
The insight that makes funnel analysis worth the setup effort is granularity: you can filter by segment, cohort, or time period to isolate whether the drop-off rate affects all users or just a specific group.
Segmentation to reveal which user groups are at risk
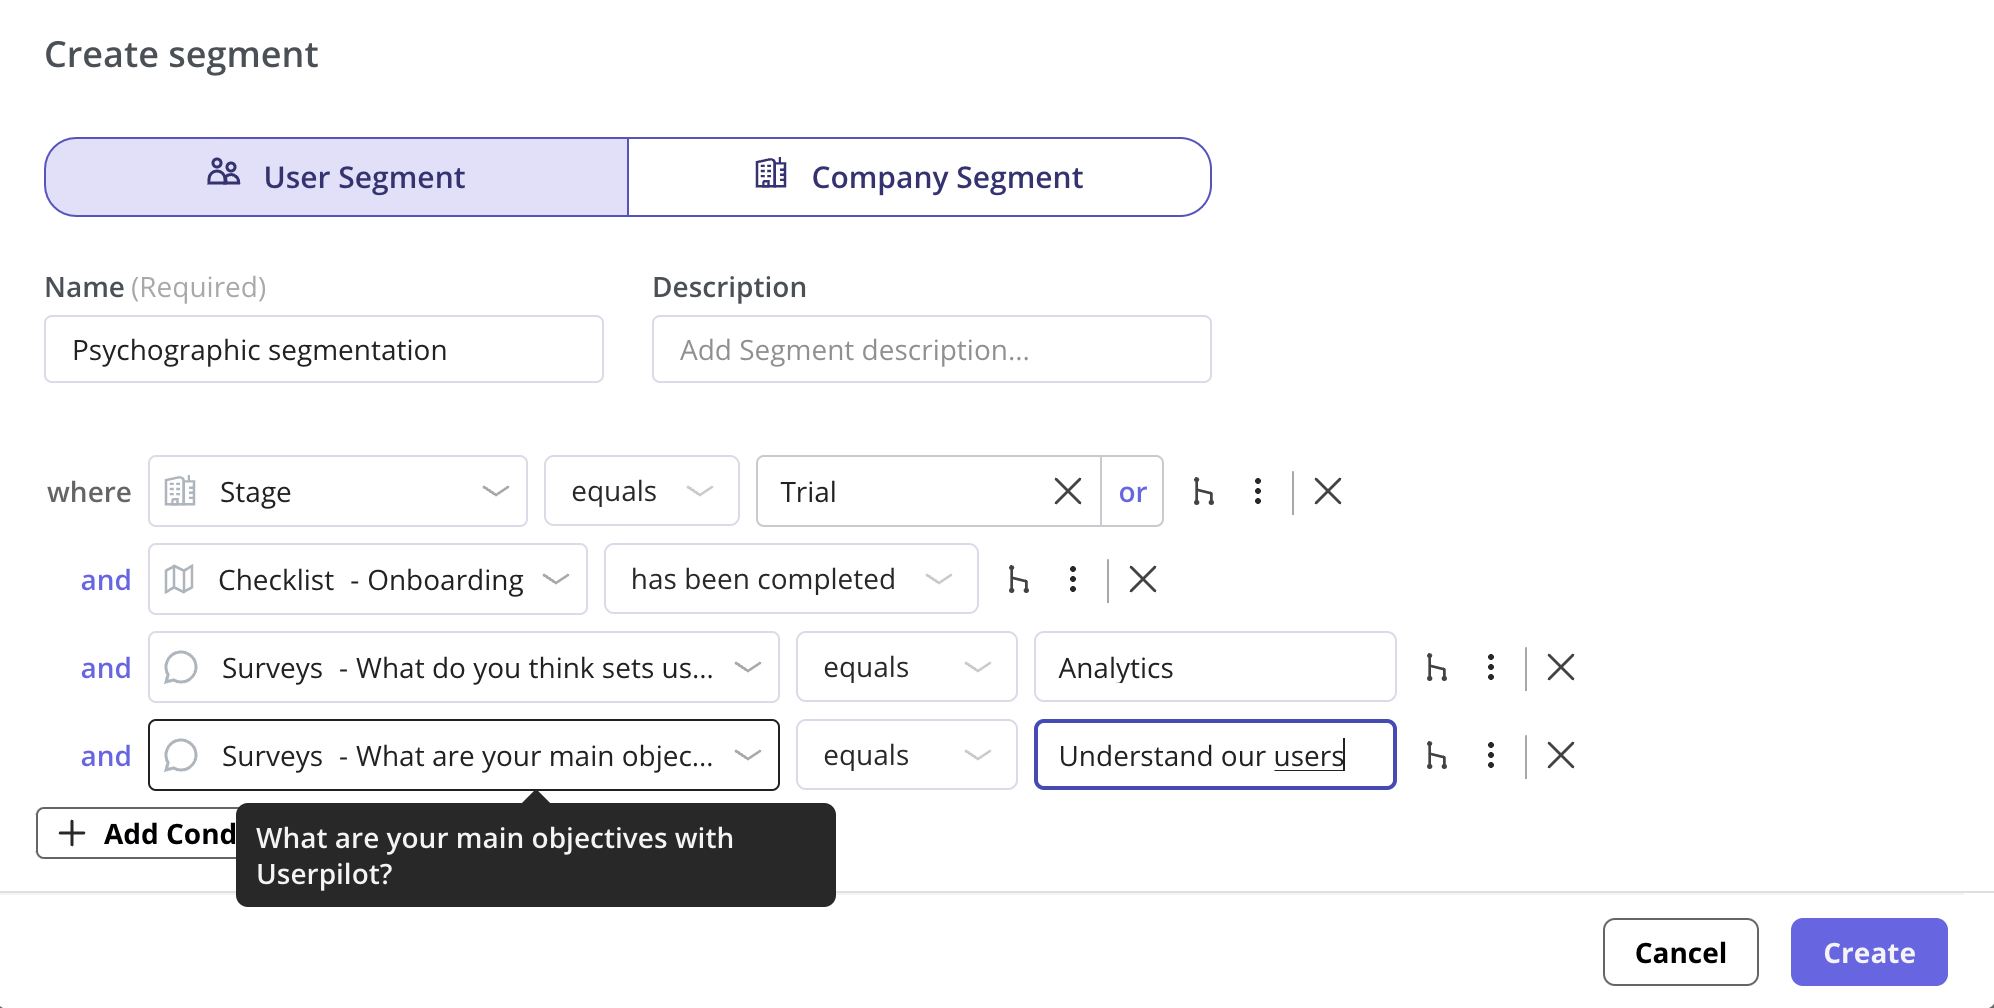
Customer segmentation divides users into groups based on shared characteristics or behaviors and then compares how those groups engage with your product over time. The practical use case is catching churn before it shows up in your revenue metrics. For instance, you can see users who log in but never trigger your core event.
Catching those patterns early is what lets you intervene.
Userpilot’s advanced segmentation lets you build groups across any combination of user properties, event history, and lifecycle stage, then trigger engagement flows directly from the segment. The loop between segmentation and in-app response is what makes event data actionable rather than descriptive.
Path analysis to map what users actually do
Path analysis maps the sequence of events users take as they move through your product. Rather than asking “did they convert?”, it asks “what did they do before they converted, and where did everyone else go?” That distinction matters when you’re trying to separate the flows that lead to activation from the ones that trap users in loops without progression.
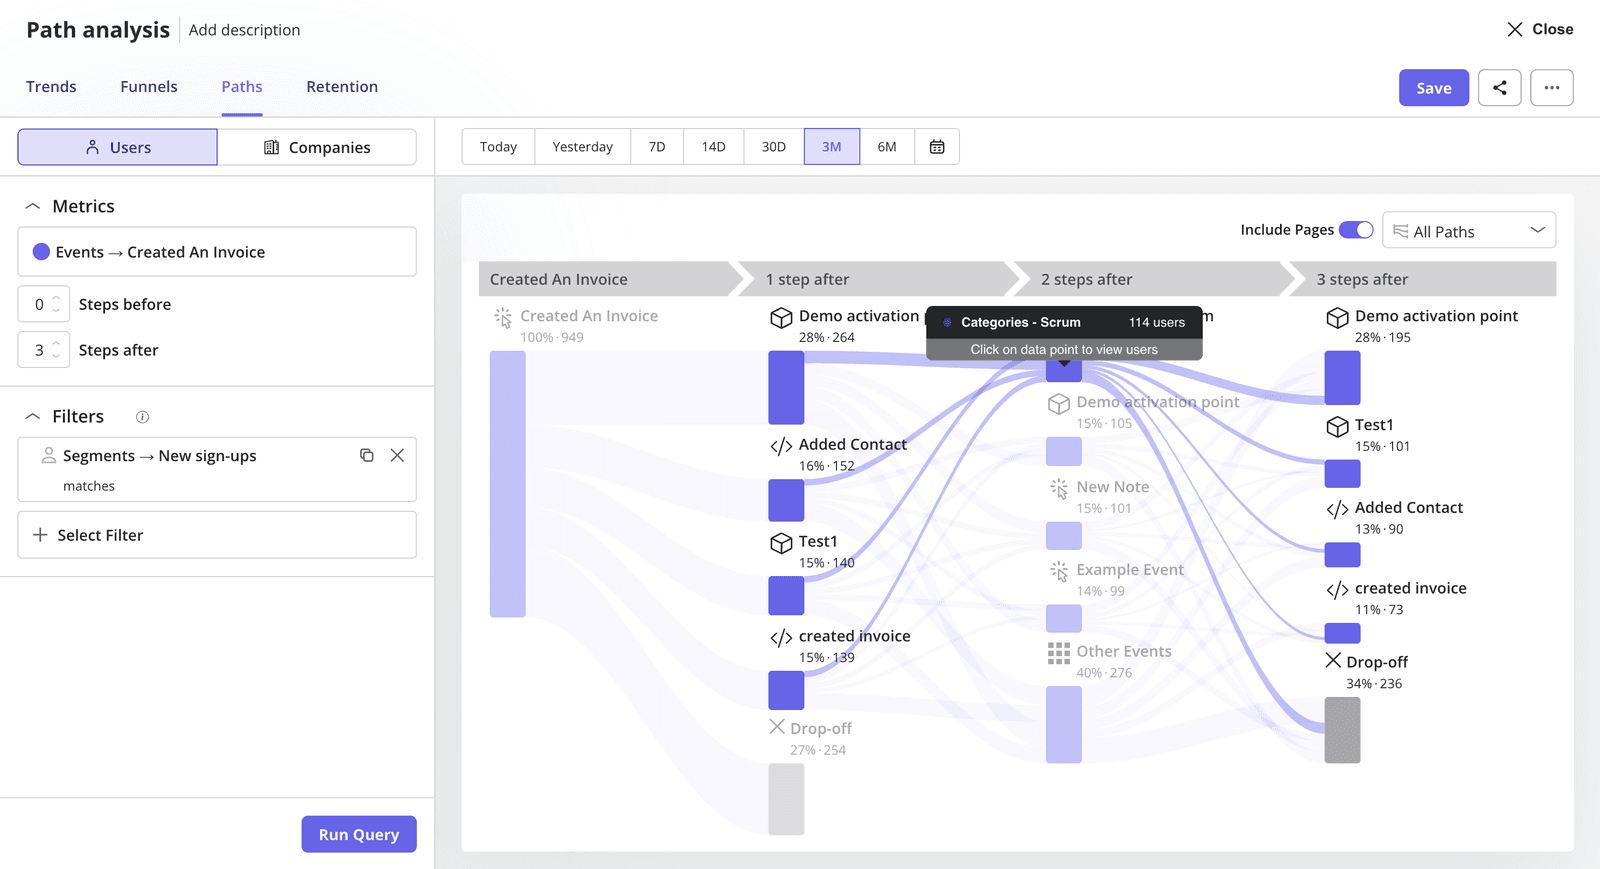
The most common starting point is mapping what happens after sign-up. Do users go straight to your core feature, or do they detour into settings and profile pages that add no activation value?
Comparing paths across different user segments, such as new users versus returning or free plan versus paid, often surfaces differences in journey efficiency that would never appear in an aggregate metric.
Retention analysis to find your most valuable early behaviors
Retention analysis uses event data to measure how often users return to your product over a given period, and more usefully, which early behaviors predict whether they do. The question I always start with: which event, completed in the first session, is most strongly correlated with 30-day retention?
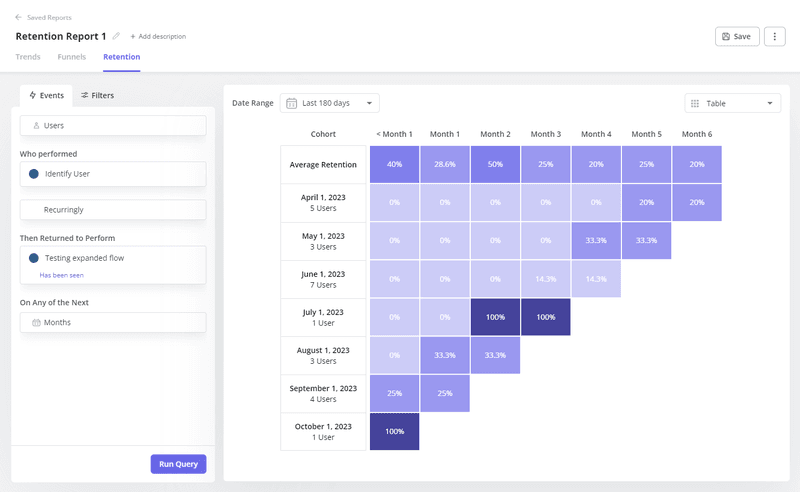
Finding that event is what tells you where to focus your onboarding, what to guide users toward first, and which activation metrics to protect. Tracking user retention and growing it helps improve your recurring revenue.
Feature adoption tracking to validate every launch
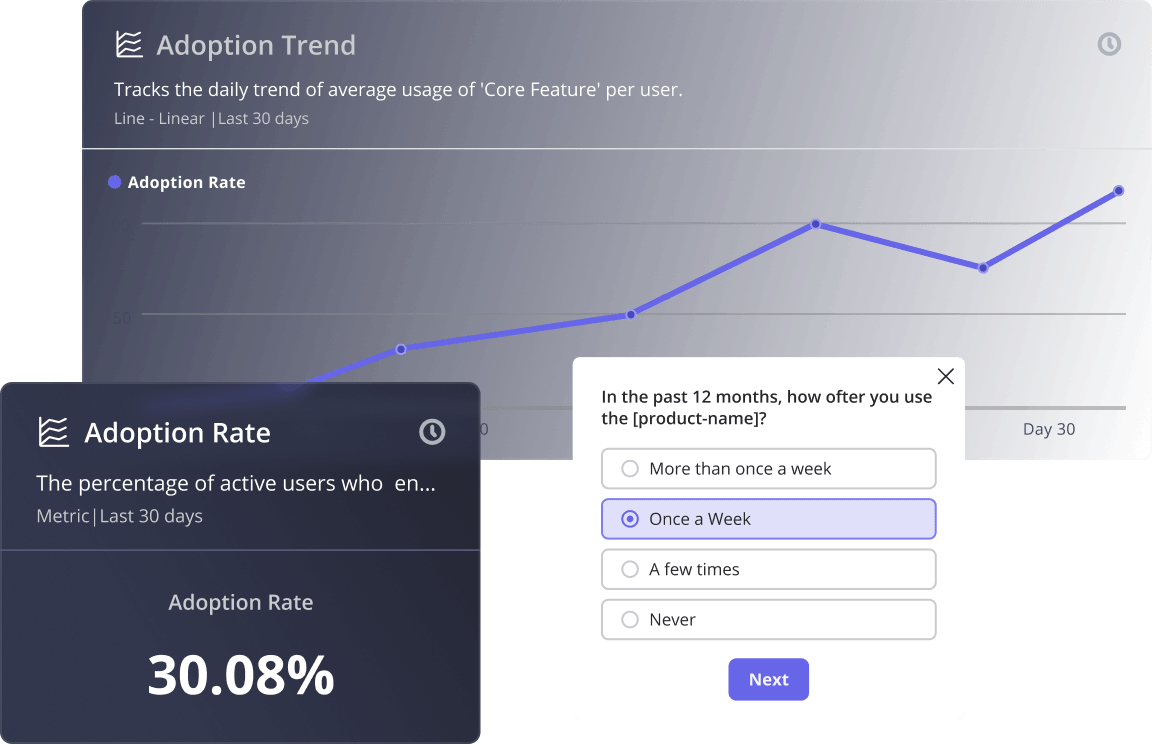
After every release, you should use product launch analytics to track key events connected to the new feature’s adoption and look for areas where the drop-off is happening.. Monitor the total usage and then segment by individual users to distinguish genuine broad adoption from a small group of power users skewing the numbers.
If a feature isn’t gaining traction after the initial announcement spike, the problem may not be the feature itself but could be discovery and messaging.
Event-based analytics in action: 2 examples
Generic case studies aren’t particularly useful. Here are two concrete examples of what acting on event data actually looks like in practice.
Jiminny: From analytics blind spots to 79% renewal rates
Jiminny, a MarTech intelligence platform that helps revenue teams analyze customer interactions, had a specific problem: they couldn’t see how individual users were engaging with new features after launch, and setting up new event tracking required engineering involvement.
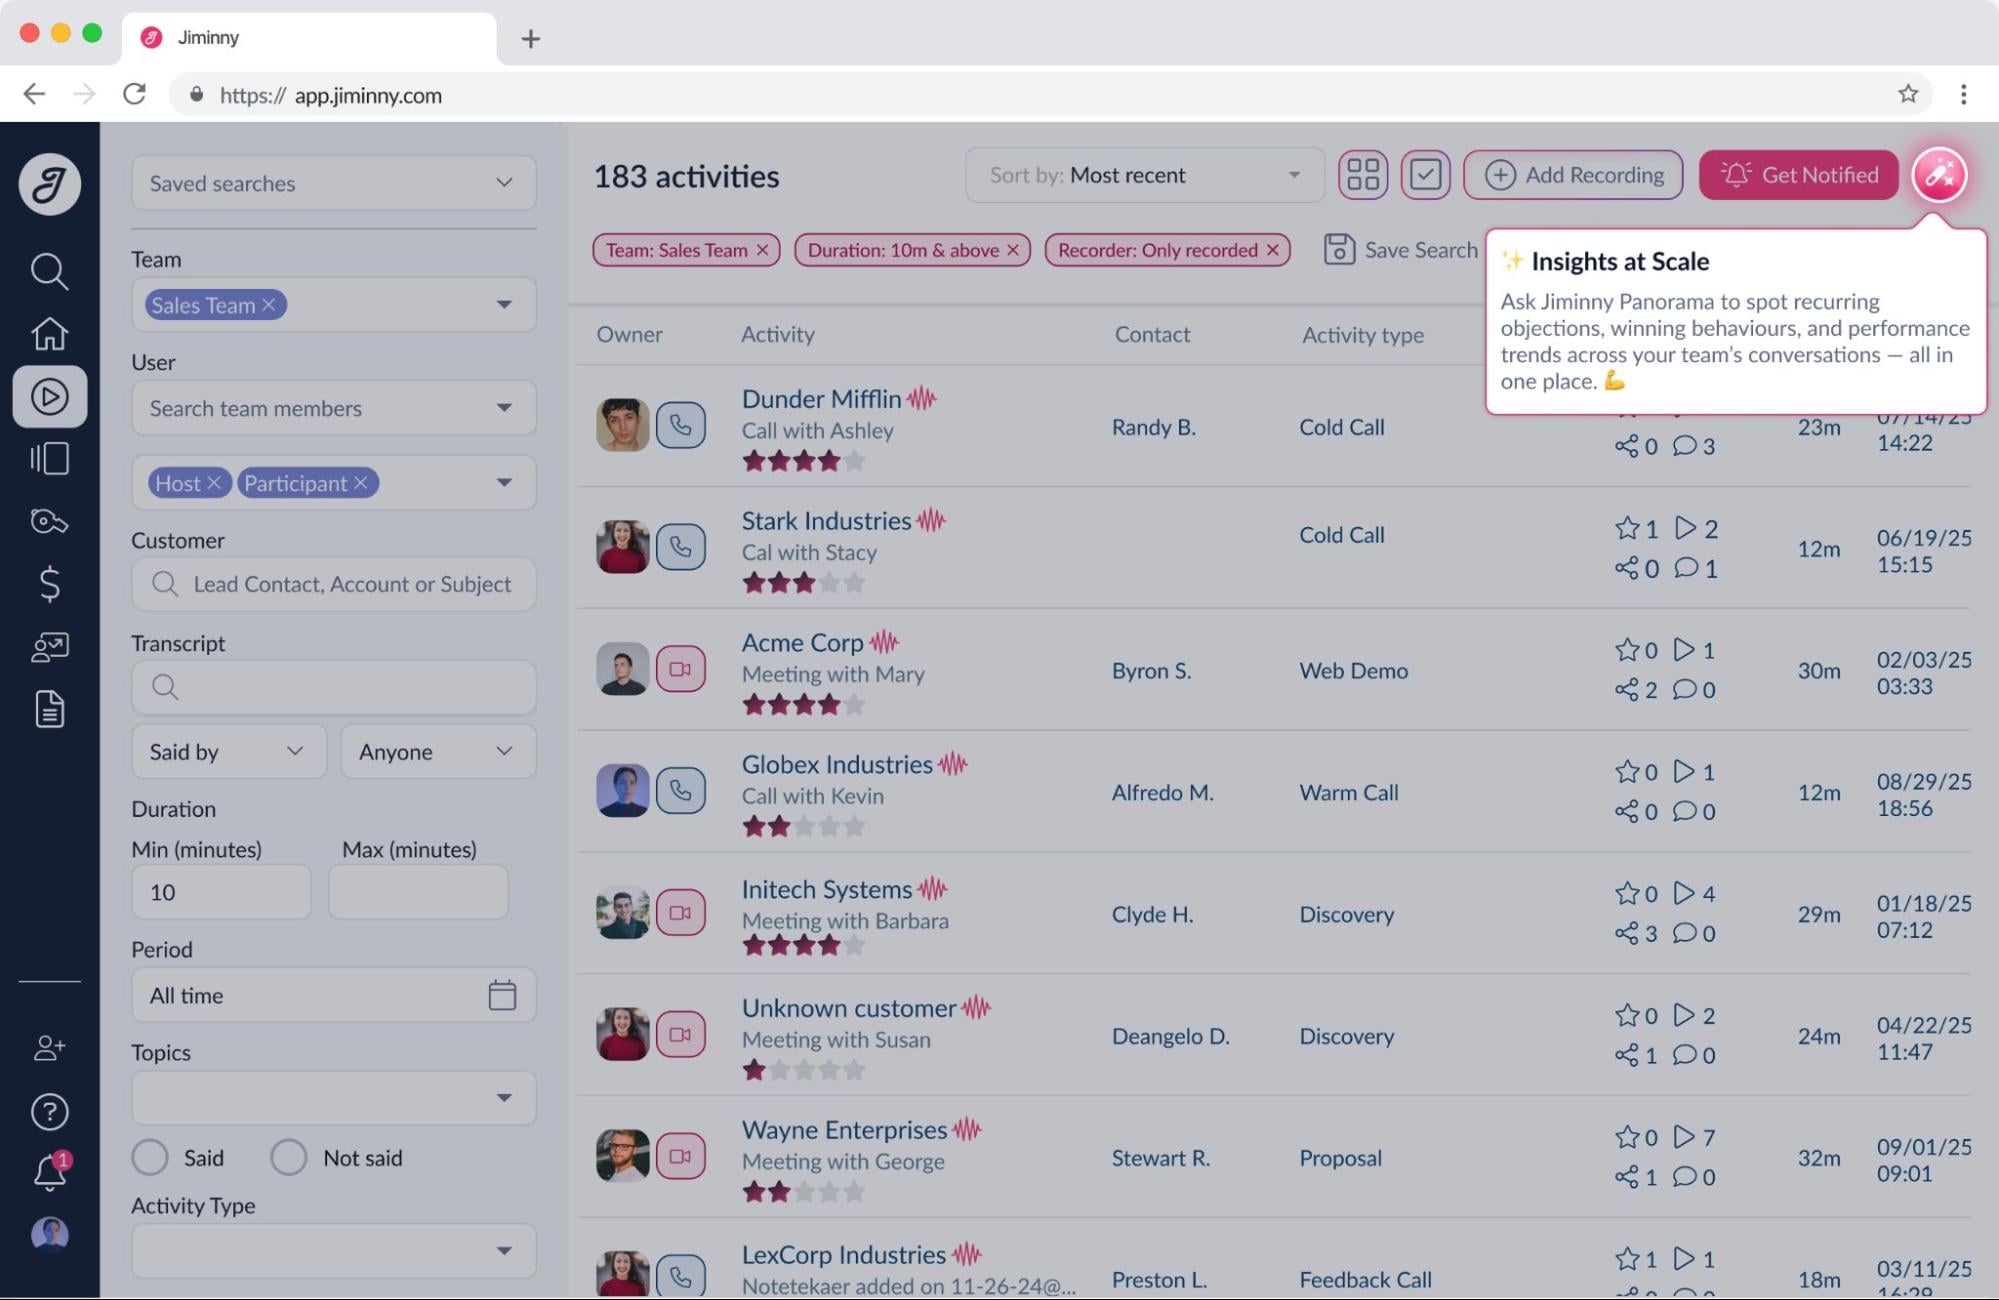
Galya Dimitrova, Head of Product at Jiminny, described the state of their feature announcements:
“We used to send emails about new features only to managers and admins, hoping they would inform their teams. “
After setting up no-code event tracking through Userpilot’s visual labeler, Galya monitors trend analytics after every release. She segments by user role and pricing tier to understand which groups are actually engaging with new functionality, not just which ones opened an announcement email. For features that aren’t gaining traction, the team follows up with a targeted tooltip or modal. Each nudge helps produce a product adoption spike, and the team iterates from there. Galya says:
“When a feature request comes in, we always look at the data first. If the related feature has very low adoption, it’s usually not something we prioritize on the roadmap.”
The downstream result? Customers who went through custom onboarding flows designed using Jiminny’s event data now renew at a 79% rate. You can read the full story here.
Fixing a product funnel without a single developer
When we launched Userpilot’s email feature, the funnel data showed a sharp drop-off at domain verification. Users were starting the setup process and abandoning it at the same step, consistently. The data was clear: something about that step was creating friction that most users weren’t pushing through. Instead of approaching engineering, I opted for a different approach.
“Within a few hours, I created a targeting tooltip and showed it to users and highlighted the correct steps for them to make it clear what to do next. That helped a lot to reduce friction and support users in real time without involving our dev team.”
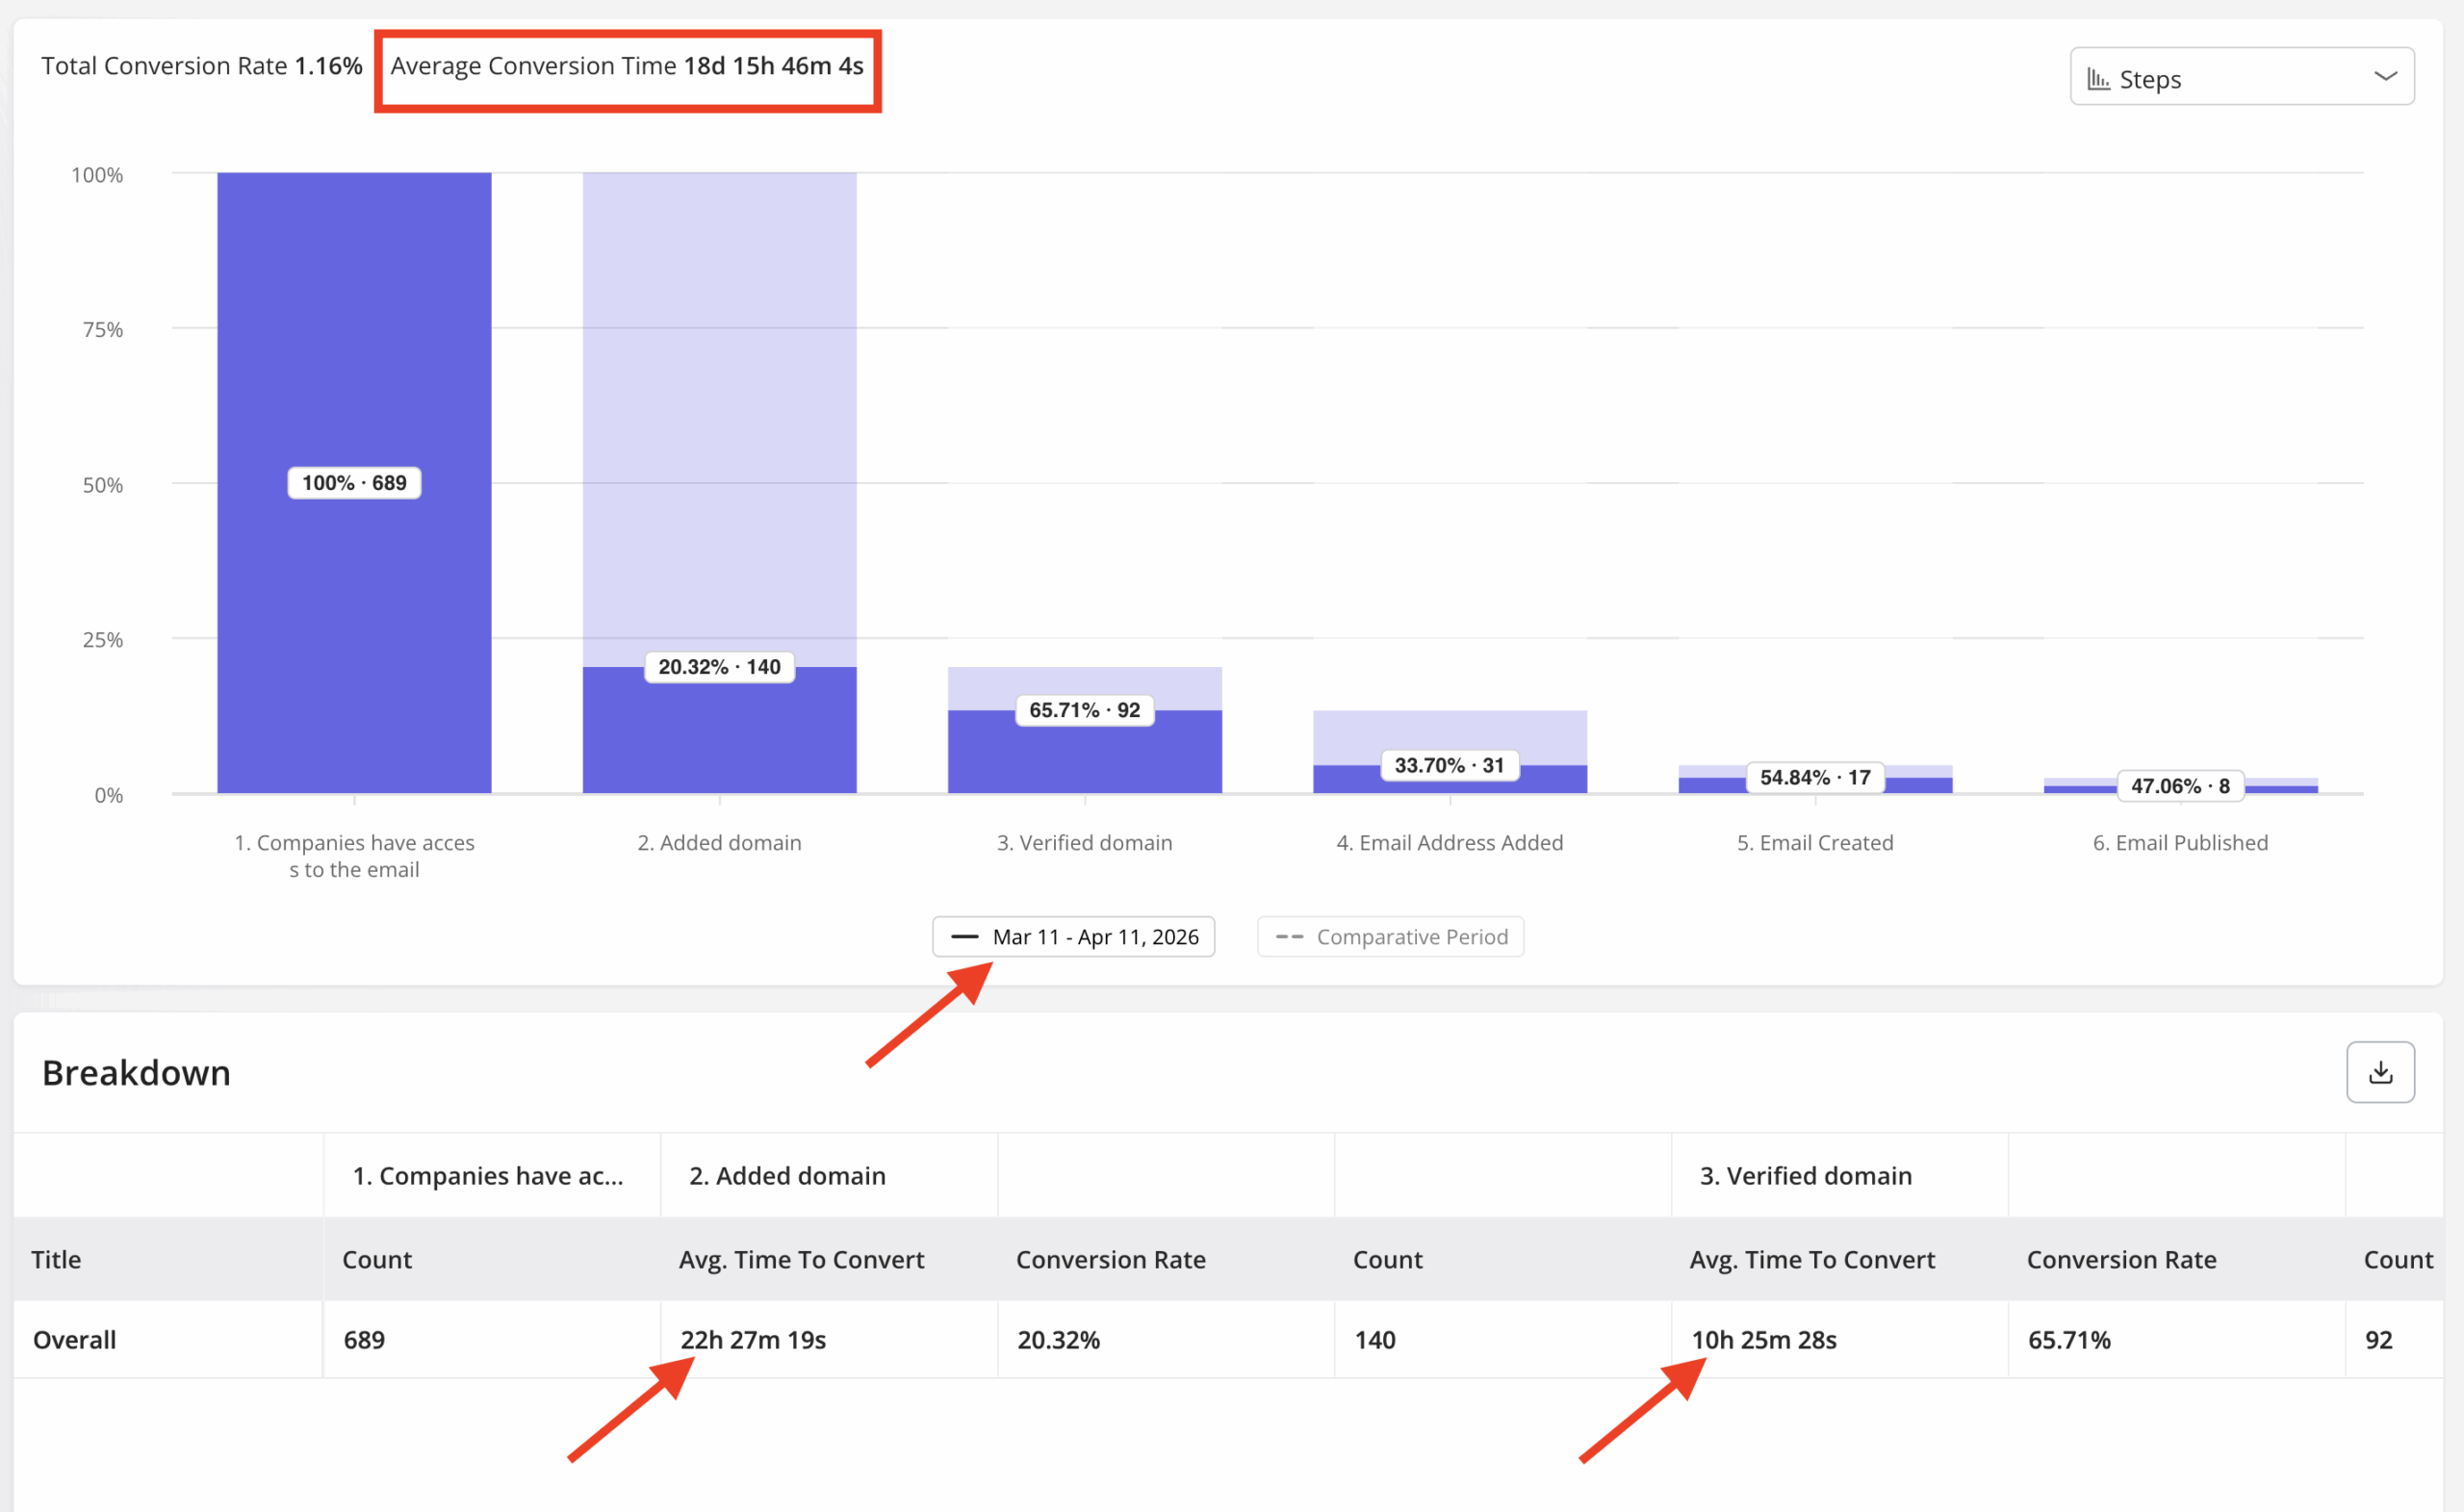
That combination of event data showing the problem and an in-app engagement layer to fix it immediately halved the average time to convert for the feature. And that’s the practical value of having both functions in a single platform.
How AI agents are changing event-based analytics
Standard event-based analytics was built on one assumption: every event is triggered by a human making a decision. A click, a scroll, a form submission, a page load. That assumption is breaking down in 2026, and most product analytics setups haven’t adapted yet.
AI agents now access SaaS products through the Model Context Protocol (MCP), an open standard that allows agents to call tools and APIs without navigating a UI at all. When an agent connects to an MCP server to pull activation data, run a segment query, or check feature adoption metrics for a specific account, it doesn’t click a button. It calls a function. Your click-based event taxonomy records nothing. As Yazan Sehwail, Userpilot’s CEO, puts it:
“Using session replay, NPS data, survey data, and product usage data, you’re able to get your answer without having to go to Userpilot, without having to pull data and upload it to someone. This is why MCP is a game changer.”
Standard event-based analytics tools can’t track these events, as the events you need to track for agent interactions are structurally different from human events.
Instead of clicked_upgrade_button or viewed_pricing_page, you’re tracking conversation_started, task_completed, agent_failure_signal, and satisfaction_rate. These are event streams from your AI layer, not your UI, and they belong in a separate measurement track. This makes it challenging to track agent-related events.
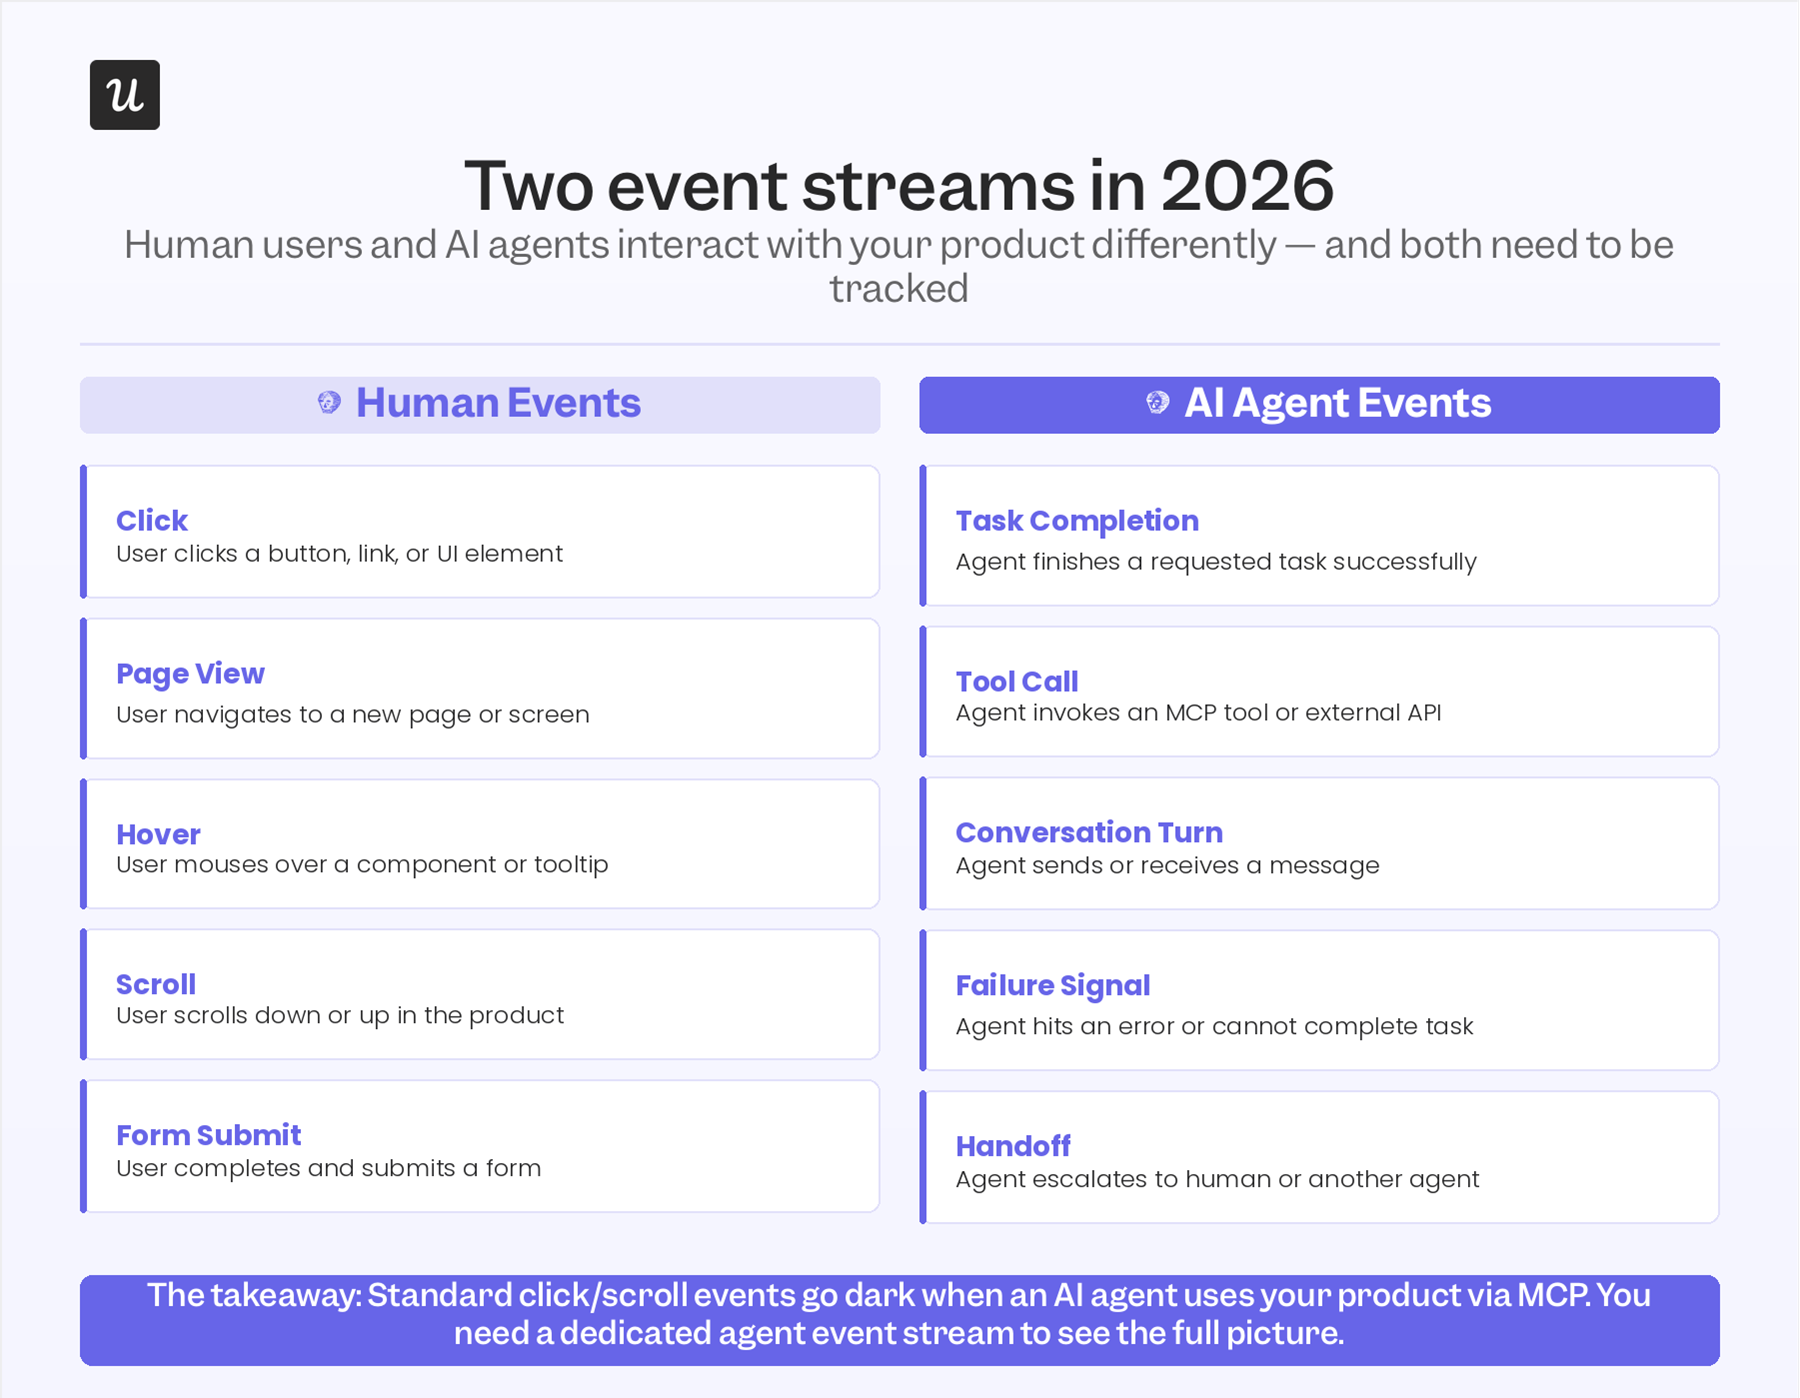
But there’s another side to AI agents. They simplify analytics for humans.
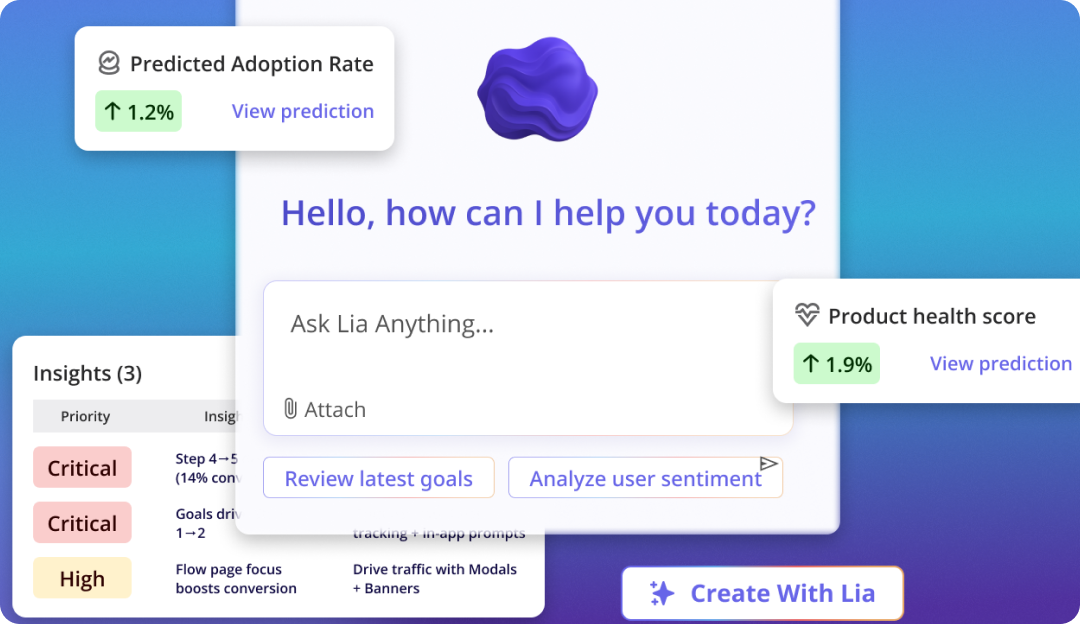
Lia, Userpilot’s AI agent, is one example of how this plays out in practice. Lia operates inside your product as an always-on assistant. It surfaces adoption insights and flags accounts that need attention. Instead of pulling up reports for funnel analysis or heatmaps manually, you can simply ask Lia to produce one, and it’ll bring up the relevant report.
And with our MCP server, you can also query Lia using external AI platforms, pulling insights about product usage or triggering flows without navigating to Userpilot at all.
The practical implication for your tracking setup: if a meaningful share of your product traffic comes from agents using MCP connections, your current analytics is undercounting real user engagement and potentially misreading failure signals that are actually agent interactions hitting an unsupported workflow. You need both streams measured to get an accurate picture of what’s happening in your product.
Event-based analytics tools in 2026
The tools worth knowing in 2026 fall into two broad types: standalone analytics platforms that are strong on data capture and analysis, and integrated platforms that combine analytics with in-app engagement so you can act on what you find without switching tools. The right choice depends on how close your analytics setup needs to be to your product experience layer.
| Tool | Core Capabilities | Actionability & In-App Engagement | Key 2026 / AI Capabilities | Best Fit For |
| Amplitude | Deep cohort & behavioral analysis; robust event-based modeling for large data volumes. | Purely analytical; focus is strictly on data synthesis and mapping user journeys rather than directly changing UI. | Serious investment in Agent Analytics to close the measurement gap around autonomous AI-to-user interactions. | Enterprise teams with complex data stacks and dedicated data analysts. |
| Userpilot | No-code event tracking tool (visual UI labeler) + server-side API support, funnels, paths, trends, and segmentation. | Direct loop: instantly build and trigger tooltips, modals, checklists, and interactive flows based on insights. | Lia: An embedded natural language AI assistant that answers analytics questions and highlights user drop-offs instantly. | Product & growth teams wanting to analyze behavior and immediately act on it without switching tools. |
| Mixpanel | Real-time event flows, intuitive user journey self-service, solid funnel & retention tracking. | Purely analytical; acting on data insights requires exporting data or moving to an external tool. | Fast, decoupled self-service exploration optimized for rapid insight generation without engineering bottlenecks. | Agile product teams who need to move quickly without constant reliance on data engineering teams. |
| PostHog | Bundled event analytics, feature flags, A/B testing, and session replays under a transparent data model. | Limited native in-app guidance; teams typically pair PostHog with an external engagement layer for complex user onboarding. | Fully self-hostable stack ensuring complete data control and compliance with modern data residency regulations. | Engineering-led teams who prioritize data privacy, strict architecture control, and developer-centric tooling. |
Start tracking the right events in 2026
Event-based analytics gives you the clearest picture of what’s happening inside your product: which features users are actually engaging with, where they’re getting stuck, and which early behaviors predict long-term retention. In 2026, that picture now needs to include two types of user activity: the human interactions your current setup already tracks, and the agent interactions most setups are missing entirely.
With Userpilot, you can track user events and take action to fix issues from within a single platform that also comes with an AI-powered agent. Get a free trial now to start tracking user actions.
FAQ
What is the difference between event-based analytics and page-view analytics?
Page-view analytics counts sessions and page loads; it tells you where users went. Event-based analytics captures specific user actions within those pages; it tells you what users did and in what sequence. For SaaS products, where retention and expansion depend on feature usage rather than content views, event data is what drives actionable insights because it connects behavior to outcomes. Page views tell you that a user visited your pricing page. But event data tells you they scrolled to the annual plan comparison, clicked the upgrade button, and abandoned the checkout at the payment step.
Can event-based analytics track AI agent interactions?
Standard event-based analytics setups cannot track AI agent interactions effectively. Agents accessing your product through MCP connections call APIs directly and don’t trigger UI events like clicks, hovers, or page loads, which means they’re invisible to a conventional event schema. Tracking agent interactions requires a dedicated measurement layer that captures conversation logs, task completions, and failure signals as a separate event stream.
How do I decide which events to track first?
Start with the event that corresponds to your core value moment: the specific action users take when they first experience what your product does best. From there, build backward. Which steps lead to that action, and where do users drop off along the way? Also, check which behaviors after that core event correlate with 30-day retention. That three-part map (steps leading to value, the value event itself, and post-value engagement signals) gives you a tracking foundation before you tackle edge cases and secondary user interactions.
About the author