Customer Segmentation Examples in 2026: The 8 That Work for SaaS Product Teams


When was the last time a segment you built actually changed what you shipped?
Most product teams have more segments than they act on. A startup cohort, an enterprise cohort, an NPS detractors list: all of them sit in a dashboard while the roadmap gets built from gut instinct and support tickets. Segmentation becomes a reporting habit rather than a decision-making tool, and the gap between having segments and acting on them is where most of the value gets lost.
In this post I cover the eight customer segmentation types that consistently produce product outcomes, the three-part test I use to decide whether a segment is worth building, and one category most teams aren’t tracking in 2026: AI agent users who access your product without leaving the behavioral signals your existing segments depend on.

Eight types, one framework, and one segment most teams are missing
- What makes a segment worth building: If you can’t close the Segment-Signal-Action loop (identify the cohort, read a signal from it, and act on that signal inside your product), you have a report category, not a growth lever.
- Behavioral segmentation: The highest-leverage type for product teams because the signal (a drop-off, a feature gap, an NPS score) and the action (an in-app tooltip, a walkthrough, a survey) both live in the same tool.
- Firmographic segmentation: The foundation for B2B personalization. Company size, industry, and growth stage drive onboarding differentiation, pricing logic, and which features you surface during activation.
- Technographic segmentation: Underrated in most SaaS products. Knowing a user’s existing tech stack lets you pre-empt integration friction and surface the right setup steps before they hit a dead end.
- Needs-based and psychographic segmentation: The hardest to collect at scale and the most useful for product-market fit work. Welcome surveys and NPS follow-up questions are your two primary data collection tools here.
- Geographic and demographic segmentation: Table stakes for international products and B2B role targeting. For most SaaS teams, job role and seniority are more actionable than age or gender as demographic variables.
- AI agent users: If your product has MCP-enabled agent traffic in 2026, you have a second user class that doesn’t trigger the behavioral events your existing segments are built around. Most product teams haven’t built a segment for this yet.
- Running the analysis: Four steps: set specific goals, collect behavioral and firmographic data from inside your product, define segment criteria, then close the loop with targeted in-app experiences rather than just external campaigns.
What makes a customer segment worth building
Most teams create more segments than they ever act on. They build a “startup” cohort, an “enterprise” cohort, an “NPS detractors” list, and those groups sit in the analytics tool while the product roadmap gets built from gut instinct and support tickets. Before getting into specific customer segmentation examples, it’s worth establishing one test every segment should pass.
I think of it as the Segment-Signal-Action loop. For a segment to be worth building, three conditions need to hold:
- You can identify who’s in it using data you already collect
- The group reliably emits a signal you can act on (a funnel drop-off, a spike in support requests, an NPS score crossing a threshold)
- You have a specific action available inside your product that closes the gap for that group
If any of those three links is missing, you have a report category, not a growth lever.
Behavioral segments are the strongest performers against this test because all three conditions are usually met: behavioral data is collected automatically, the signals are specific and real-time, and the actions (in-app messages, walkthroughs, surveys) can be triggered in the same platform.
Firmographic segments are weaker on the signal side unless you layer user behavioral data on top of them. The agent-user segment at the end of this post scores poorly on signals for most teams right now, which is exactly why it’s the right time to start building the infrastructure before agent traffic becomes a significant share of your DAU.
Behavioral segmentation: The engine of SaaS product growth
Behavioral segmentation divides users based on what they actually do in your product rather than who they are or where they work. It covers feature adoption patterns, login frequency, journey stage, and satisfaction signals like NPS and CSAT. Behavioral segmentation divides customers based on their interactions with a product, covering usage history, feature engagement, and loyalty signals, and in a SaaS context it maps almost perfectly onto the in-app action space because the data source and the intervention tool are one and the same.
Braze’s analysis of over 30,000 campaigns and 10 billion marketing messages found that campaigns sent to well-defined behavioral segments produce 3x more conversions than broadcast sends to the full user base. The mechanism is simple: a message about a feature resonates differently when the recipient is someone who tried it and got stuck, compared to someone who has never seen it.
Userpilot tracks all of these behavioral signals natively, which means user segmentation based on feature events analysis and engagement patterns can feed directly into targeted in-app flows without a manual export step. That combination (segment defined in one place, action delivered in the same place) is why behavioral segmentation produces faster results than any other type.
Feature adoption and funnel drop-off segmentation
Feature adoption segmentation is the most immediate application of behavioral data. You segment users by whether they’ve completed a key in-product action (finished onboarding, connected an integration, reached a usage milestone), and then you look at what’s different between the group that completed it and the group that stalled. Usually the difference isn’t intent. It’s a specific friction point that one group hit and the other didn’t.
When Userpilot launched our email feature, funnel analysis showed a sharp drop-off at domain verification. I segmented the users who had stalled at that step, built a targeted checklist and tooltip in Userpilot within a few hours without involving the dev team, and the drop-off closed within days. The reason it worked that quickly was that the segment, the signal, and the intervention were all in one place, with no handoff between seeing the problem and fixing it.
That logic extends to feature adoption broadly: segment users who have tried a new feature and segment users who haven’t, then run different experiences for each group. Users who completed the action get a short follow-up survey asking what they found.
For those who haven’t tried it yet, an interactive onboarding walkthrough reduces the barrier to first use.
Journey stage segmentation
Journey stage segmentation groups users based on where they are in their relationship with your product: new signups who haven’t reached activation, activated users who haven’t yet become habitual, habitual users who are candidates for expansion, and at-risk accounts showing early disengagement signals. Each group has a different goal and needs a different type of in-product communication.
The most common mistake I see here is treating “new user” as a single segment. A user who signed up three days ago and has logged in six times is in a completely different position from a user who signed up three days ago and hasn’t returned since day one. Combining them into one segment produces messaging that’s wrong for both, because the intervention that reactivates a disengaged user is the wrong message for a highly engaged one who just needs guidance on the next step.
Journey stage segmentation works best when it’s behavioral rather than calendar-based. Use product events to define activation (completed the action that correlates with long-term retention) rather than “signed up more than N days ago,” and use engagement-drop signals to define at-risk accounts rather than a fixed inactivity window. Re-engaging inactive users starts with being precise about which users are actually inactive versus which are just in a different usage rhythm.
NPS and CSAT-based segmentation
Satisfaction score segmentation is underused as a product signal. Most teams run NPS and look at the aggregate score. The more useful practice is segmenting users by their score and then analyzing how the behavioral patterns of promoters differ from those of detractors, because that analysis usually reveals specific features or journey paths correlated with high and low satisfaction, which gives you a roadmap for closing the gap, not just a number to report.
NPS follow-up questions are also one of the best sources of customer pain point data you have. Open-text responses from detractors consistently surface friction that never appears in support tickets, because users who are annoyed but not angry enough to contact support simply stop engaging with those parts of your product.
For CSAT segmentation, the same logic applies at a more granular level: run a CSAT survey on a specific feature or flow and segment respondents to understand which user types are finding it valuable and which aren’t. Userpilot lets you target different survey types at different behavioral segments, so you’re collecting feedback from the right users rather than broadcasting to everyone at once.
Firmographic segmentation for B2B SaaS
Firmographic segmentation is the B2B equivalent of demographic segmentation. Instead of grouping individual users by personal characteristics, you group companies or accounts by business attributes: company size, industry, annual revenue, growth stage, and geographic market. It’s the foundation for B2B personalization because these variables predict how a team will want to use your product before they’ve generated any behavioral data for you to work from.
Dan Balcauski, a SaaS pricing consultant, makes the case directly: “Most SaaS executives think that what you charge will determine your success. In fact, who and how you charge determines your success. Segmentation is the first step to SaaS pricing success.” Firmographic segments like company size and revenue are the most common inputs into differentiated pricing models because they correlate reliably with willingness to pay, deal complexity, and support requirements.
In B2B segmentation, understanding the decision-making process matters here too, because purchases typically involve multiple stakeholders and longer buying cycles than B2C. That means the firmographic profile of an account should inform not just the product experience but also the sales motion and B2B customer journey design, including who receives which in-app messages and at what point in the account lifecycle.
Company size segmentation
Company size is usually the first firmographic variable SaaS product teams implement, and with good reason: the feature needs of a 5-person startup and a 500-person enterprise using the same product are often incompatible. Startups want speed, simplicity, and a quick path to value. Enterprise teams want controls, integrations, audit logs, and SSO. Surfacing the same onboarding flow to both groups wastes both their time.
The standard way to collect company size data is through a welcome survey that asks users to identify their team size during onboarding. Once you have that variable, Userpilot lets you filter all engagement data by it, so you can compare activation rates, feature adoption, and NPS scores for different-sized cohorts without exporting anything.
Industry, revenue, and growth stage
Industry segmentation is most valuable when your product has meaningfully different use cases across verticals. A CRM used by an insurance company and a CRM used by a real estate firm share most of the same features, but the workflows, compliance requirements, and integration needs are different enough that a single onboarding path will serve both groups poorly. Industry-based segmentation lets you recommend the relevant features and support resources to each group from the first session.
Growth stage segmentation (grouping accounts by whether they’re a bootstrapped startup, a Series A company, or a scaled enterprise) adds more nuance than company size alone because it reflects both the team’s sophistication and their resource constraints. A 30-person startup with enterprise ambitions behaves differently from a 30-person mature SMB that has been on the same tool stack for five years. Understanding what each segment actually needs typically requires combining firmographic variables rather than treating any single attribute as sufficient.
Successful companies layer segmentation models together to build more precise buyer personas. A segment defined as “Series B fintech company, 50 to 200 employees, using Salesforce” produces a far more targeted onboarding experience than “mid-market account.” Firmographic segmentation is a common method in B2B markets precisely because company size and industry together predict so much about what an account will struggle with and what will make them successful.
Technographic segmentation examples
Technographic segmentation groups users based on the technology they currently use: their operating system, device type, browser, or the software stack their team has already deployed. It’s an underrated segmentation type in most SaaS products because it lets you pre-empt integration friction rather than waiting for users to hit it, get confused, and either file a support ticket or quietly churn.
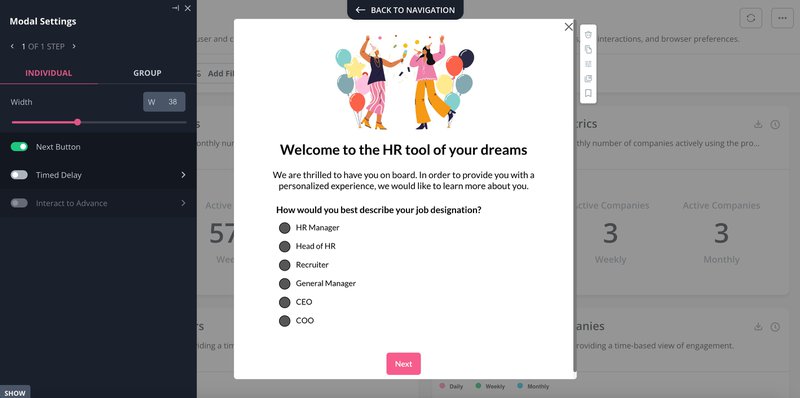
The most direct use case is tech stack segmentation. If your product integrates with CRMs, project management tools, or data warehouses, a new user’s existing tech stack tells you which integrations are their first priority and which onboarding steps to surface first. You can collect this data during onboarding through a welcome survey, then use it to route different cohorts to different setup flows so that a Salesforce user and a HubSpot user each see the steps that are actually relevant to them.
Device type segmentation follows similar logic. Mobile and desktop users often need different UI experiences, different notification strategies, and sometimes completely different in-app communication cadences. Knowing that a cohort of your users is predominantly mobile is an input into product design decisions and the engagement experience you build for that group, not just a demographic curiosity. Feedback collected from desktop users may not apply to mobile users at all, and mixing the two without segmenting by device produces misleading signals about UI quality.
Needs-based and psychographic segmentation
Needs-based segmentation classifies customers according to their specific pain points or desired outcomes from your product rather than their firmographic profile or behavior patterns. Two companies of identical size, in the same industry, on the same plan, can need completely different things from your product, and a segmentation model that doesn’t account for that will produce generic experiences that work well for neither of them.
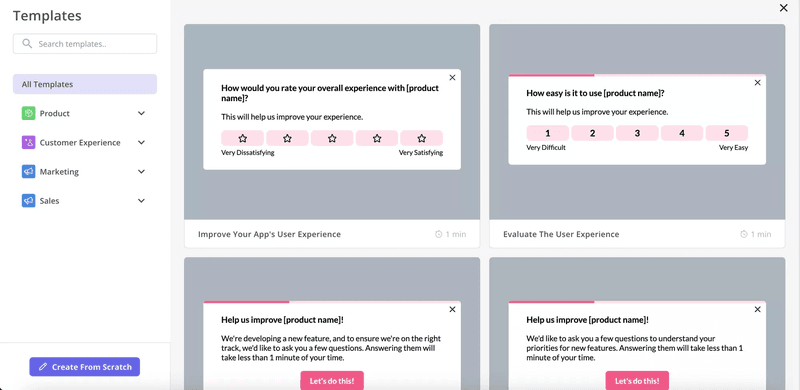
The primary data source for needs-based segmentation is user surveys: welcome surveys that ask what problem the user is trying to solve, and NPS or CSAT follow-up questions that reveal what’s blocking them from getting there. Both can be set up and deployed as in-app surveys in Userpilot to reach users at the right moment rather than as email blasts that land after the friction has already passed.
Use case segmentation
Use case segmentation groups users based on the job they’re hiring your product to do, which is often different from the job the product was designed for. An AI writing tool gets used for copywriting, for long-form content, for scriptwriting, and for translation workflows, and users in each group have different preferences, different tolerance for iteration cycles, and different definitions of success. Segmenting by use case lets you surface the right capabilities to each group rather than presenting the full feature set as equally relevant to everyone.
The fastest way to collect use case data is through a welcome survey that asks users to identify their primary goal in two or three words. That single data point can power more relevant onboarding flows. Instead of taking every new user through the same product tour, you route each cohort to the features they actually care about, which reduces time to the Aha! moment significantly.
Psychographic segmentation examples
Psychographic segmentation categorizes customers based on their lifestyles, values, and personality traits, focusing on internal characteristics rather than external demographics. It’s harder to scale than behavioral or firmographic data, but it’s useful for products where user motivation significantly affects feature adoption patterns and long-term retention.
The most actionable psychographic variable in SaaS is risk tolerance and work style: some users want to explore the product aggressively and discover features on their own, while others want to be guided step by step. Identifying which type of user is in front of you early in onboarding lets you adjust the pacing of your in-product experience accordingly. Value-based segmentation, which groups users by the principles that guide their decisions (sustainability, efficiency, collaboration), works well for products where mission alignment drives retention. You can use contextual tooltips to surface messages that resonate with each values-based segment at exactly the right moment in their journey.
Geographic and demographic segmentation
Geographic segmentation groups customers based on their physical location: country, region, city, or time zone. For products with an international user base, location is a prerequisite for localization, covering different languages, different currency displays, and different legal requirements around data storage and privacy. Netflix’s India-specific mobile-only plan at roughly $3 per month versus $9 per month for US subscribers is the most-cited example of geographic segmentation driving differentiated pricing that matches actual usage patterns in each market.
Language-based segmentation extends this naturally. Grouping users by their preferred language lets you deliver localized in-app guidance (translated tooltips, region-specific onboarding content, support documentation in the user’s first language) without maintaining a separate product build for each locale.
For B2B SaaS, demographic segmentation is most useful when it captures job role and seniority rather than personal characteristics like age or gender. A sales manager using a CRM and a VP of Revenue using the same tool need different feature visibility and different messaging about value. Occupation-based segmentation lets you tailor feature recommendations, customer engagement strategies, and upgrade messaging to match how each role in your customer’s organization thinks about what they need from your product.
The segment most SaaS teams aren’t building in 2026: AI agent users
Customer segmentation has always assumed that the entity being segmented is a human. In 2026, that assumption no longer holds for a growing number of products. AI agents accessing SaaS tools through MCP don’t open sessions, don’t trigger click events, don’t scroll, and don’t engage with in-app messages. They call API-level actions, complete tasks, and exit without leaving any of the behavioral signals your existing segmentation logic was built to read.
Yazan Sehwail, Userpilot’s CEO, described how this compounds the measurement problem: “As producing and building features become a lot cheaper, instead of every quarter you’re releasing one or two features, now you’re releasing 7, 8, 9. It becomes even harder for product teams to manually have to track each one and understand usage for each one.” That velocity problem gets worse when some of those feature interactions are coming from agents rather than humans, because agents won’t tell you when a feature is confusing, won’t complete an NPS survey, and won’t show up in your session replay tool.
The practical implication is that any product team with meaningful agent traffic needs a separate segmentation layer for agent users. This means tracking which agent identities are accessing your product, what tasks they’re completing and failing, and how their usage patterns differ from human users in the same account. Userpilot’s Agent Analytics surfaces conversation logs, task completion rates, failure signals, and satisfaction proxies for agent interactions, connected to the same account-level view used for human user segmentation.
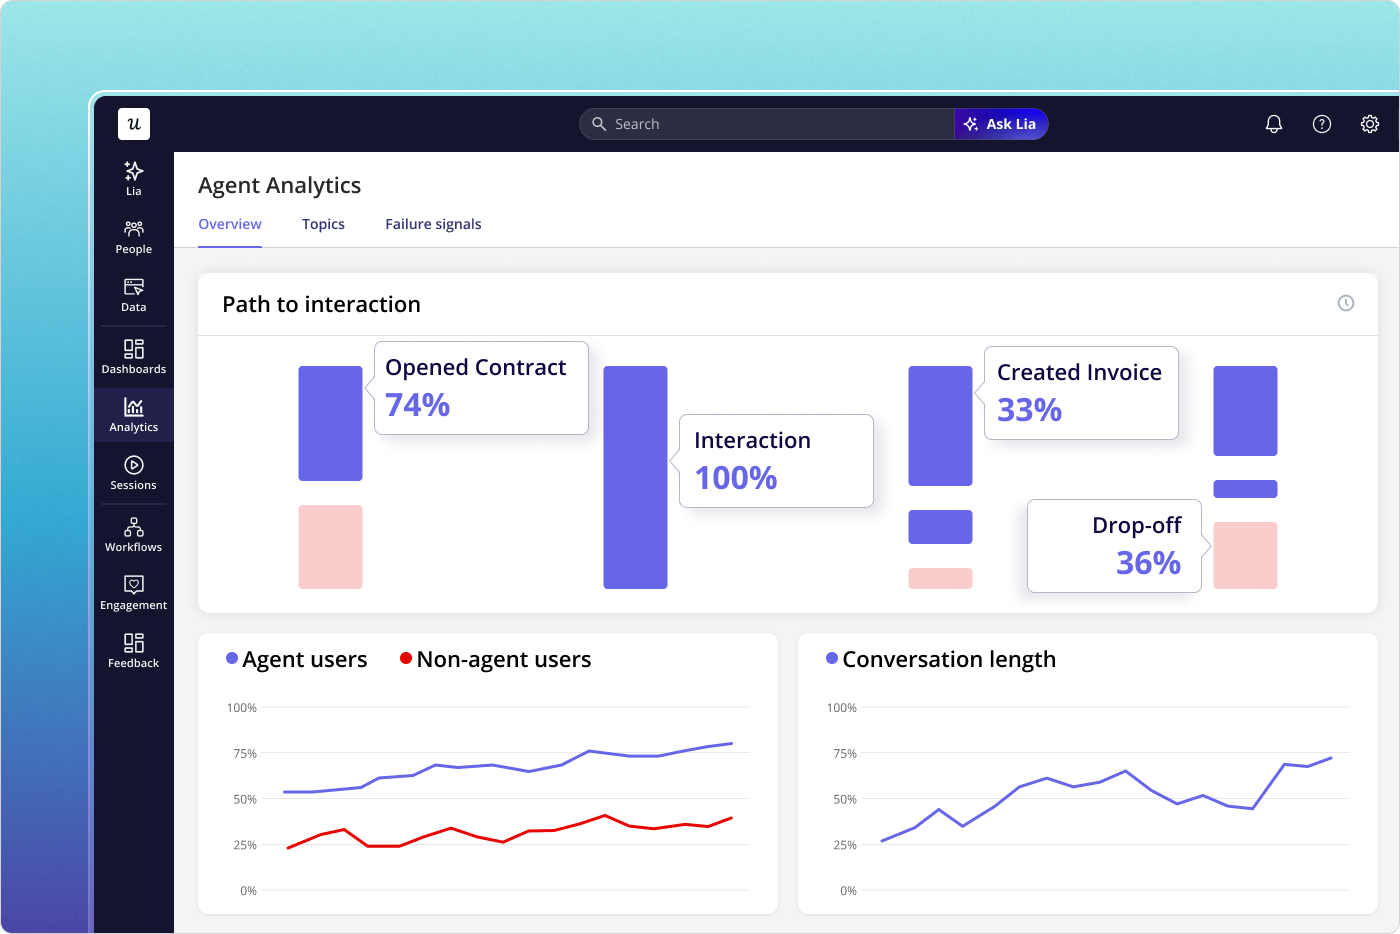
Gartner projects that 40% of enterprise applications will include task-specific AI agents by end of 2026. If your product is in that group, running segmentation on only the human portion of your user base means you’re analyzing an increasingly smaller share of your total product interactions. The Segment-Signal-Action loop still applies to agent users, but the signals are different (task failure rate, tool call errors, query completion time), and the actions are different too (API documentation improvements, MCP tool refinements, prompt engineering on the agent side).

How to run a customer segmentation analysis in four steps
Knowing which customer segmentation types exist is the easy part. The hard part is building a process that turns segment data into product actions consistently, not just when you’re manually hunting for something. Here’s the four-step process I use, with Userpilot handling most of the infrastructure at each step.
Step 1: Define specific segmentation goals
Before creating a single segment, decide what you’re trying to accomplish. Are you trying to reduce drop-off in a specific onboarding step? Identify which cohort is most likely to expand to a higher plan? Understand why one industry vertical churns faster than another? A vague goal like “understand our users better” produces vague segments that nobody acts on, while a specific goal like “find the mid-market accounts that activated but churned within 90 days and identify what was different about their journey” produces a segment with a roadmap attached to it.
Start with a hypothesis. What do you believe is true about a group of your users that you haven’t yet confirmed with data? That hypothesis shapes the variables you’ll use to define the segment and the signal you’ll look for once it’s built. A customer segmentation strategy built around testable hypotheses stays connected to real product decisions rather than becoming taxonomy-building for its own sake.
Step 2: Collect behavioral and firmographic data
Product analytics tools give you behavioral data automatically: feature events, session frequency, funnel completion rates, and time-on-task. Welcome surveys and NPS follow-ups give you firmographic and needs-based data that behavioral signals can’t surface on their own: job role, company size, tech stack, and the specific pain point the user is trying to solve. Both data types are most useful when they’re in the same place, which is why collecting firmographic data inside your product rather than relying only on CRM records closes the feedback loop faster.
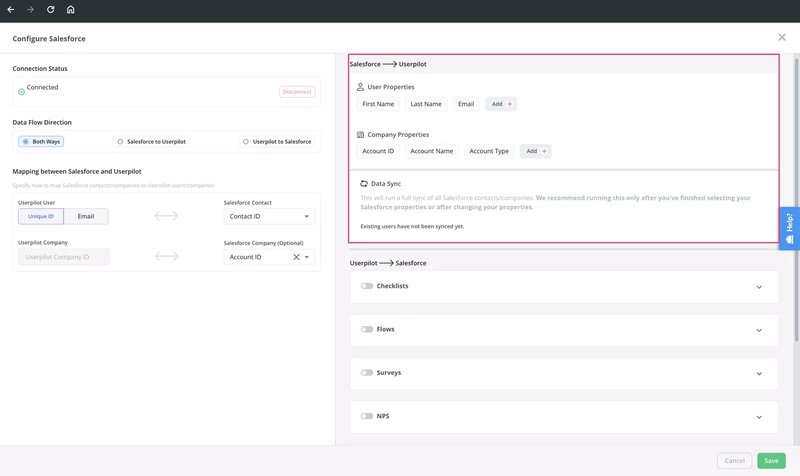
CRM integrations extend this in the other direction: Userpilot’s native integration with HubSpot brings account-level data (deal stage, contract value, customer health) into your segmentation logic alongside behavioral product data. A segment defined as “a mid-market account that completed activation but hasn’t used Feature X and has a contract renewal in 60 days” is far more actionable than either data source produces on its own.
Step 3: Define segment criteria and create the segments
Specifying the attributes that define a segment is where most implementations get too broad. The goal is not to create the largest possible group, but to create the most actionable one. A segment defined by a single dimension (company size = startup) is usually too broad to drive targeted action. A segment defined by two or three dimensions (company size = startup, activated = true, Feature X used = false) is specific enough to be useful without being so narrow it contains only a dozen accounts.
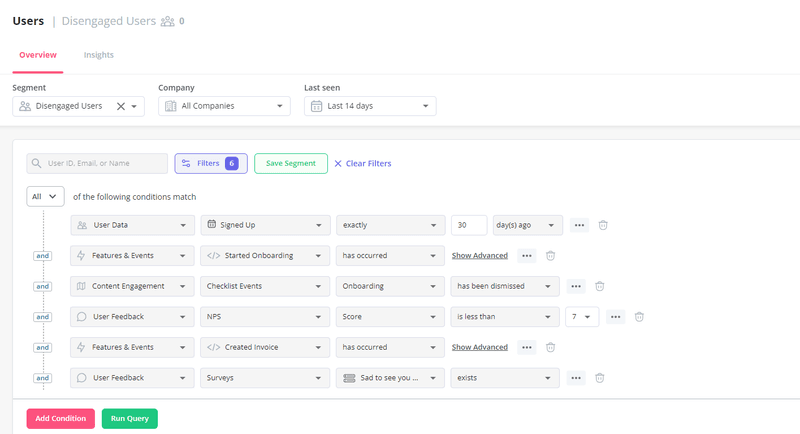
Once the criteria are defined, check the segment size. Fewer than 50 users means the in-product action you design for the segment may not produce statistically meaningful data. More than 40% of your user base usually means the definition is too broad for targeted messaging. The customer segmentation process requires regular maintenance: segment criteria that were accurate six months ago may not reflect actual usage patterns today, and user segmentation definitions should be reviewed quarterly as your product and user base evolve.
Step 4: Analyze each segment and close the loop inside your product
Analysis is where most teams stop at reports instead of going through to action. You run a funnel analysis on each segment, generate a path analysis showing how different groups move through the product, and write up the findings in a doc. The gap is between understanding the segment’s behavior and actually changing something in the product as a result. Closing that gap is what separates segmentation as a reporting practice from segmentation as a growth lever.
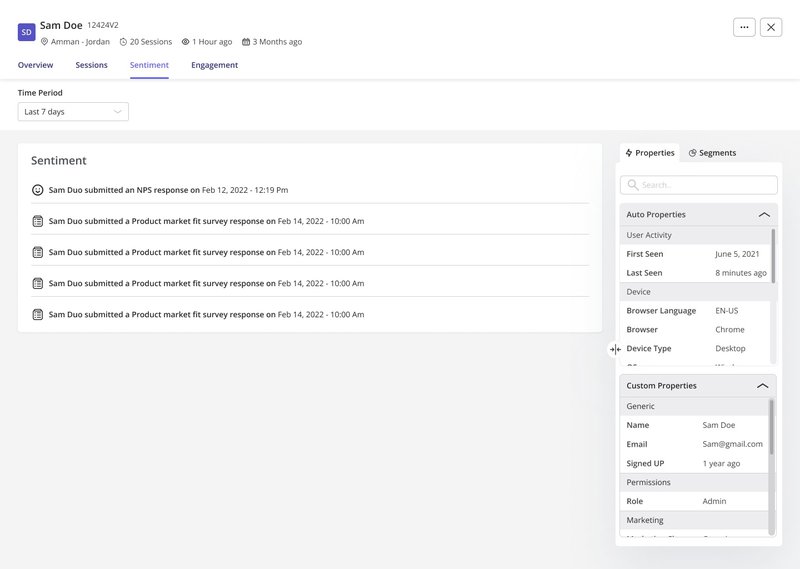
Userpilot’s funnel analysis and cohort analysis reports let you filter all data by segment and compare behavior across groups. Once you’ve identified the gap, you close it by building targeted in-product flows: a tooltip for users stuck at a specific step, an interactive walkthrough for users who haven’t discovered a feature, a personalized message for accounts approaching contract renewal.
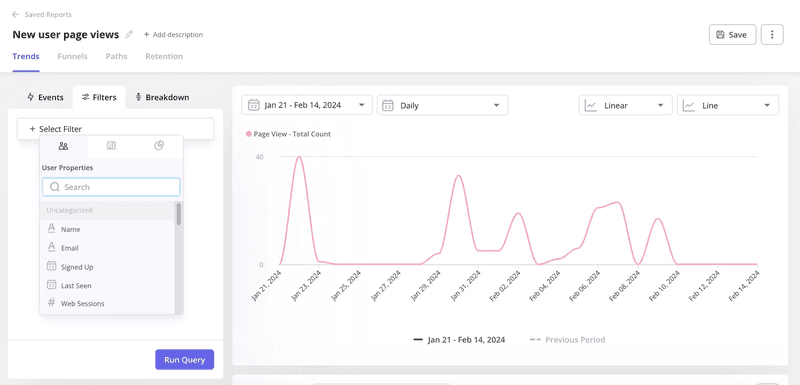
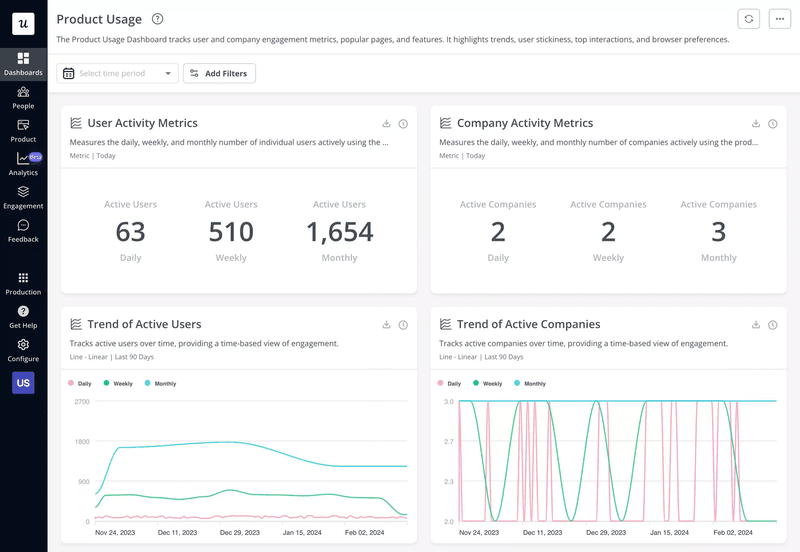
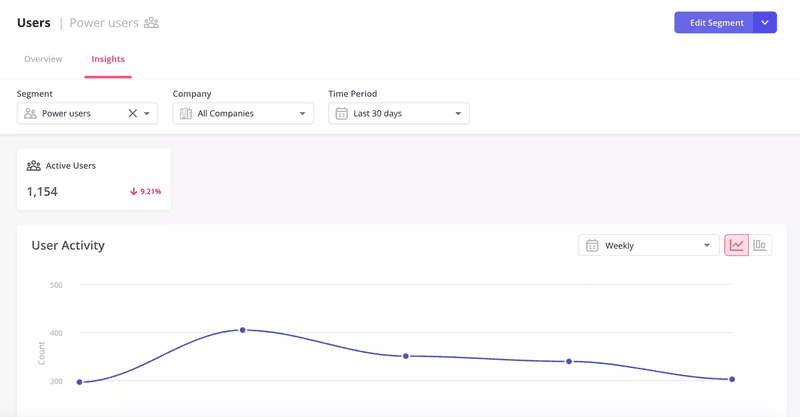
The customer segmentation analysis doesn’t end when you’ve found the problem. It ends when you’ve shipped a targeted intervention, measured whether it moved the signal for that segment, and decided whether to keep the segment definition or refine it based on what you learned. Trend analysis reports let you track how a segment’s behavior changes after an intervention, which closes the loop back to the goal you set in step one.
Ready to build segments that connect directly to in-product action? Get a Userpilot demo to see how behavioral segmentation, analytics reports, and in-app engagement work together on one platform.
FAQ
What is customer segmentation?
Customer segmentation is the strategic process of categorizing your existing customer base into distinct groups based on shared characteristics, behaviors, or needs. Rather than treating all users as a single audience, it lets you understand how different groups interact with your product and design targeted experiences, messaging, and interventions for each. For SaaS product teams, behavioral segmentation is typically the most actionable form because it connects directly to in-product experiences rather than requiring an external campaign to close the loop.
Why is customer segmentation important?
Customer segmentation matters for SaaS because the same product is rarely the right product for all users at the same time. New users need different guidance than power users, enterprise accounts need different feature visibility than startups, and at-risk accounts need a different type of engagement than accounts with high NPS scores. Without segmentation, product teams either build one experience that fits nobody precisely, or build dozens of manual exceptions that become impossible to maintain at scale.
Segmentation also drives measurable outcomes. Personalized experiences built on accurate segment data produce higher activation rates, better feature adoption, and stronger retention than generic ones. Benefits of customer segmentation include better product personalization from day one, more targeted marketing efforts, data-driven product development decisions, increased customer loyalty, and improved customer retention and lifetime value across each customer segment.
What is the difference between customer segmentation and market segmentation?
Customer segmentation focuses on your existing user base, grouping current customers by behavior, firmographics, or needs to improve product experience and retention. Market segmentation focuses on the broader addressable market, dividing potential buyers into groups based on shared characteristics to inform go-to-market strategy, positioning, and product-market fit validation. It’s how you decide which customers to pursue. Customer segmentation is how you serve the ones you already have, turning initial acquisition into long-term product adoption.
What are the main customer segmentation models for SaaS?
The main customer segmentation models for SaaS are behavioral segmentation (usage patterns, feature adoption, satisfaction scores), firmographic segmentation (company size, industry, growth stage, revenue), technographic segmentation (tech stack, device type, operating system), needs-based segmentation (pain points, use cases, desired outcomes), psychographic segmentation (values, work style, risk tolerance), and geographic segmentation (physical location, preferred language, regional pricing). Most effective SaaS segmentation strategies combine two or more of these types (firmographic data for initial personalization and behavioral data for ongoing engagement) rather than relying on any single variable. Implementing customer segmentation with Userpilot means all of these data sources are available in one place, so you can combine them without a manual data engineering project.
How does customer segmentation improve customer loyalty?
Segmentation improves customer loyalty by making users feel understood rather than processed. A new user who receives onboarding guidance that matches their actual use case and team size reaches value faster, encounters less friction, and forms a stronger association with the product. A power user who gets relevant expansion messaging instead of generic upgrade prompts is more likely to respond to upsell opportunities than one who gets the same email every mid-market account receives. Behavioral segmentation in particular drives customer loyalty by identifying disengagement signals before they become churn, and by giving you a specific lever to pull: a targeted re-engagement flow, a personalized check-in, or a feature recommendation based on what users in similar accounts found valuable.
About the author