Customer analytics is the cornerstone for making informed decisions, enhancing the user experience, and, ultimately, fostering growth.
It’s crucial to stay updated with the latest trends in customer analytics to better understand customers and make the most out of collected data!
So, let’s see 8 critical trends you can follow to stay on track with the changes and how you can apply them to achieve product growth.
Try Userpilot Now
See Why 1,000+ Teams Choose Userpilot

Customer analytics trends for growth insights (short summary)
- Analyzing customer data helps you offer personalized experiences, increase customer satisfaction and loyalty, and improve decision-making.
- Here are 8 important customer analytics trends to better capture customer data and use it for decision making:
- You should track customer behavior at multiple touchpoints across the customer journey using goal-based tracking, event tracking, and feature tagging.
- You should leverage customer data to trigger real-time communication, like personalizing your in-app messages and guides using segmentation.
- To collect both quantitative and qualitative data, you should use user surveys, event analytics, and dashboards to track core metrics.
- To enable data sharing for team collaboration, you can use growth tools for data management, data sharing across teams, and analytics dashboards for different departments regardless of technical expertise.
- You should prioritize collecting first and zero-party data using tools that come with surveys and event analytics to avoid third-party cookies and enhance data credibility and privacy.
- Adopting artificial intelligence and matching learning involves harnessing predictive analytics to prevent churn and using AI chatbots and messaging to improve user experiences.
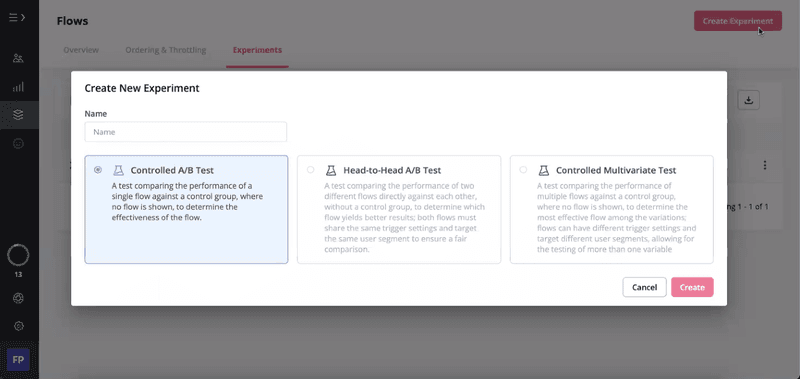
- Implementing testing for customer engagement analytics involves using controlled and head-to-head A/B tests and multivariate testing.
- You should use customer analytics tools for automation to support data analytics automation and create easy-to-understand analytics dashboards.
- Get a Userpilot demo to apply the key customer analytics trends using its product analytics functionalities, user behavior tracking, surveys, customized dashboards, and UI elements.
One of the major customer analytics trends is the shift away from third-party cookies. What should you prioritize instead?
Modern analytics isn’t just about reporting. How should you use real-time data to drive growth?
How is AI transforming customer analytics for SaaS retention?
Stay ahead of the curve with Userpilot.
Leverage predictive analytics, real-time triggering, and zero-party data collection in one platform.
Why should you analyze customer data?
Before we discuss the trends, let’s see why it’s important to analyze customer data in the first place.
- Deliver personalized experiences: Customer analytics helps you identify the most effective touchpoints for launching personalized marketing campaigns to enhance the customer experience.
- Increase customer loyalty: The insights let you discover customer loyalty drivers, such as where users spend the most time and what brings them value. You can replicate the pathways for your least engaged customers to nurture loyalty among them.
- Drive customer satisfaction: By tracking customer satisfaction metrics and analyzing customer feedback, you can improve your product as per customer insights and boost satisfaction.
- Improve decision-making: Customer analytics lets you make data-driven decisions about various aspects of your product, such as in-app marketing, customer service, onboarding experiences, etc.
8 Key customer analytics trends to follow
Now, let’s go through some of the most important customer analytics trends you should keep up with.
Track customer behavior across customer journey
As a part of customer journey analytics, you can track customer behavior at multiple touchpoints across the customer journey. This lets you see how customers progress from one stage to the next and understand differences in their behavior over time.
You can then identify trends and use them to map out the user journey. This allows you to create positive user experiences. Moreover, you can address friction points in the user journey and remove unnecessary touchpoints.
How to apply this trend?
To apply this customer analytics trend, do the following:
- Goal-based tracking: By creating a goal that presents important actions users should take across their customer journey, you can track how many users achieve the goal.
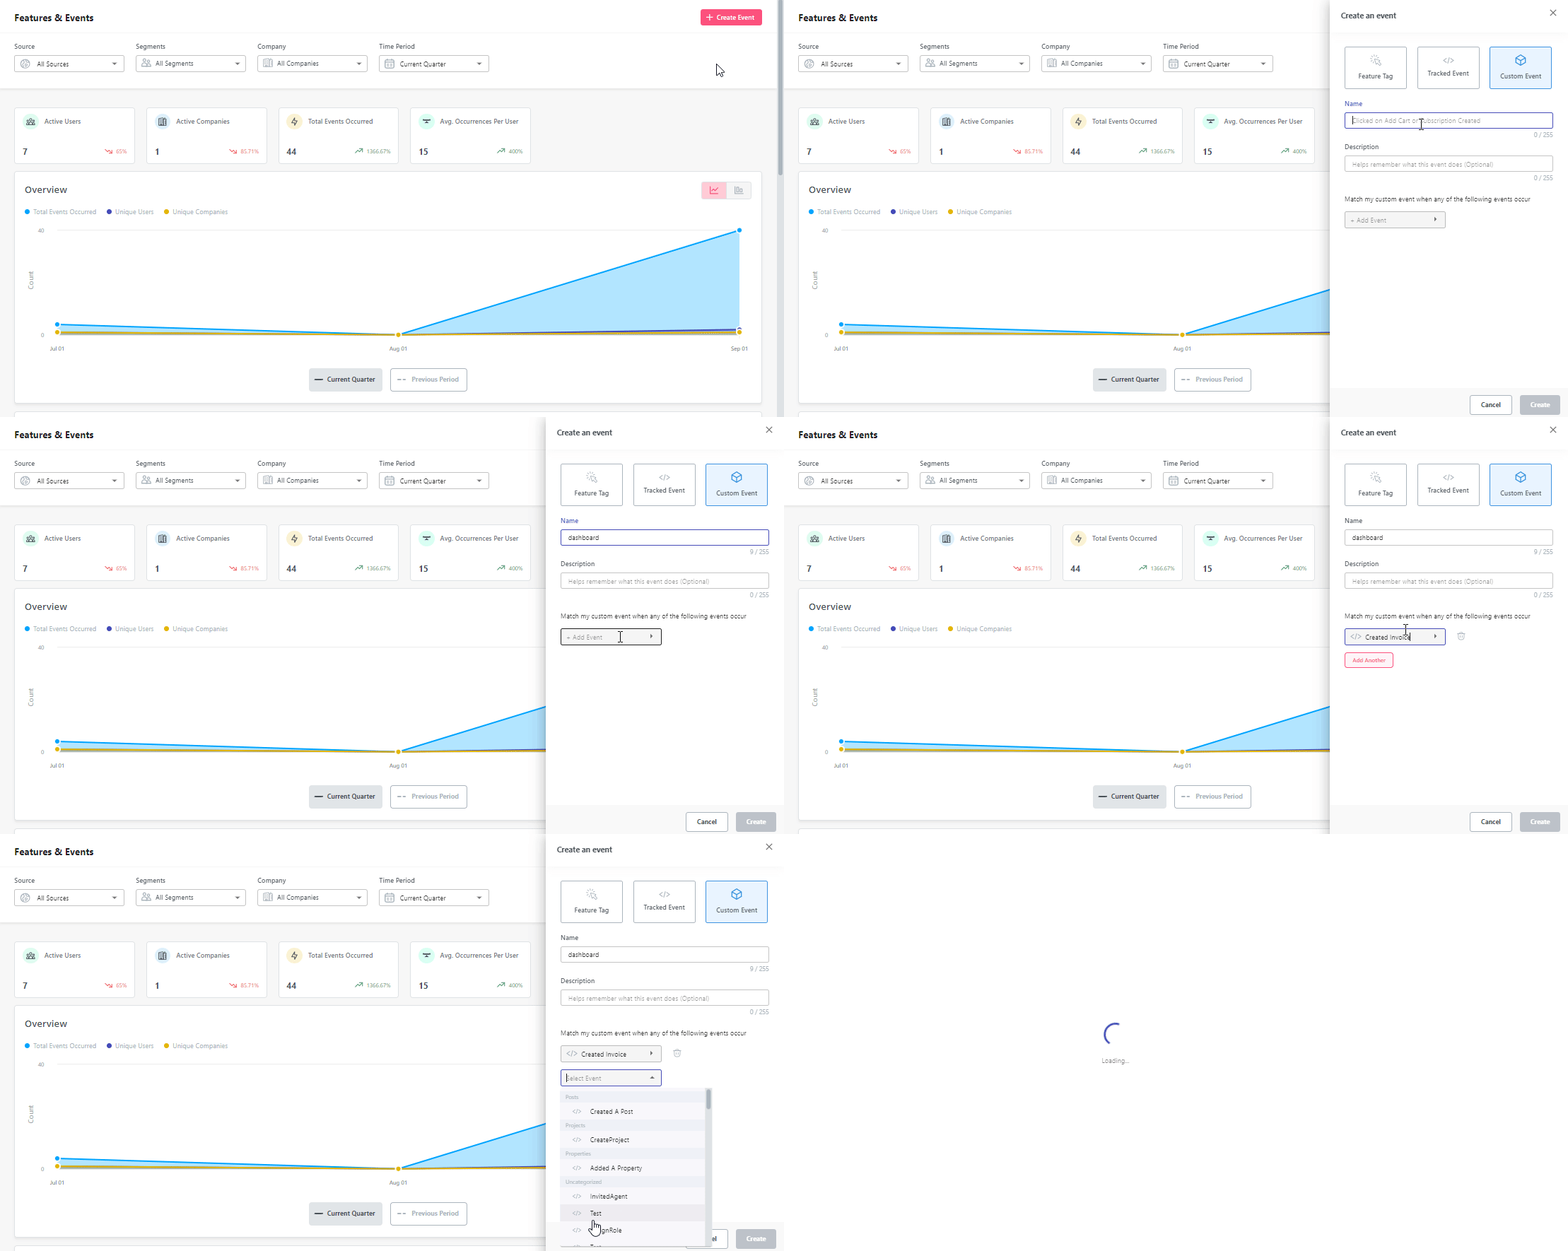
- Event tracking: You can create events and track event data, i.e., subscription created, plan upgraded, survey submitted, etc. Userpilot’s event analytics lets you see how many times and for how many unique companies and users each event has taken place.
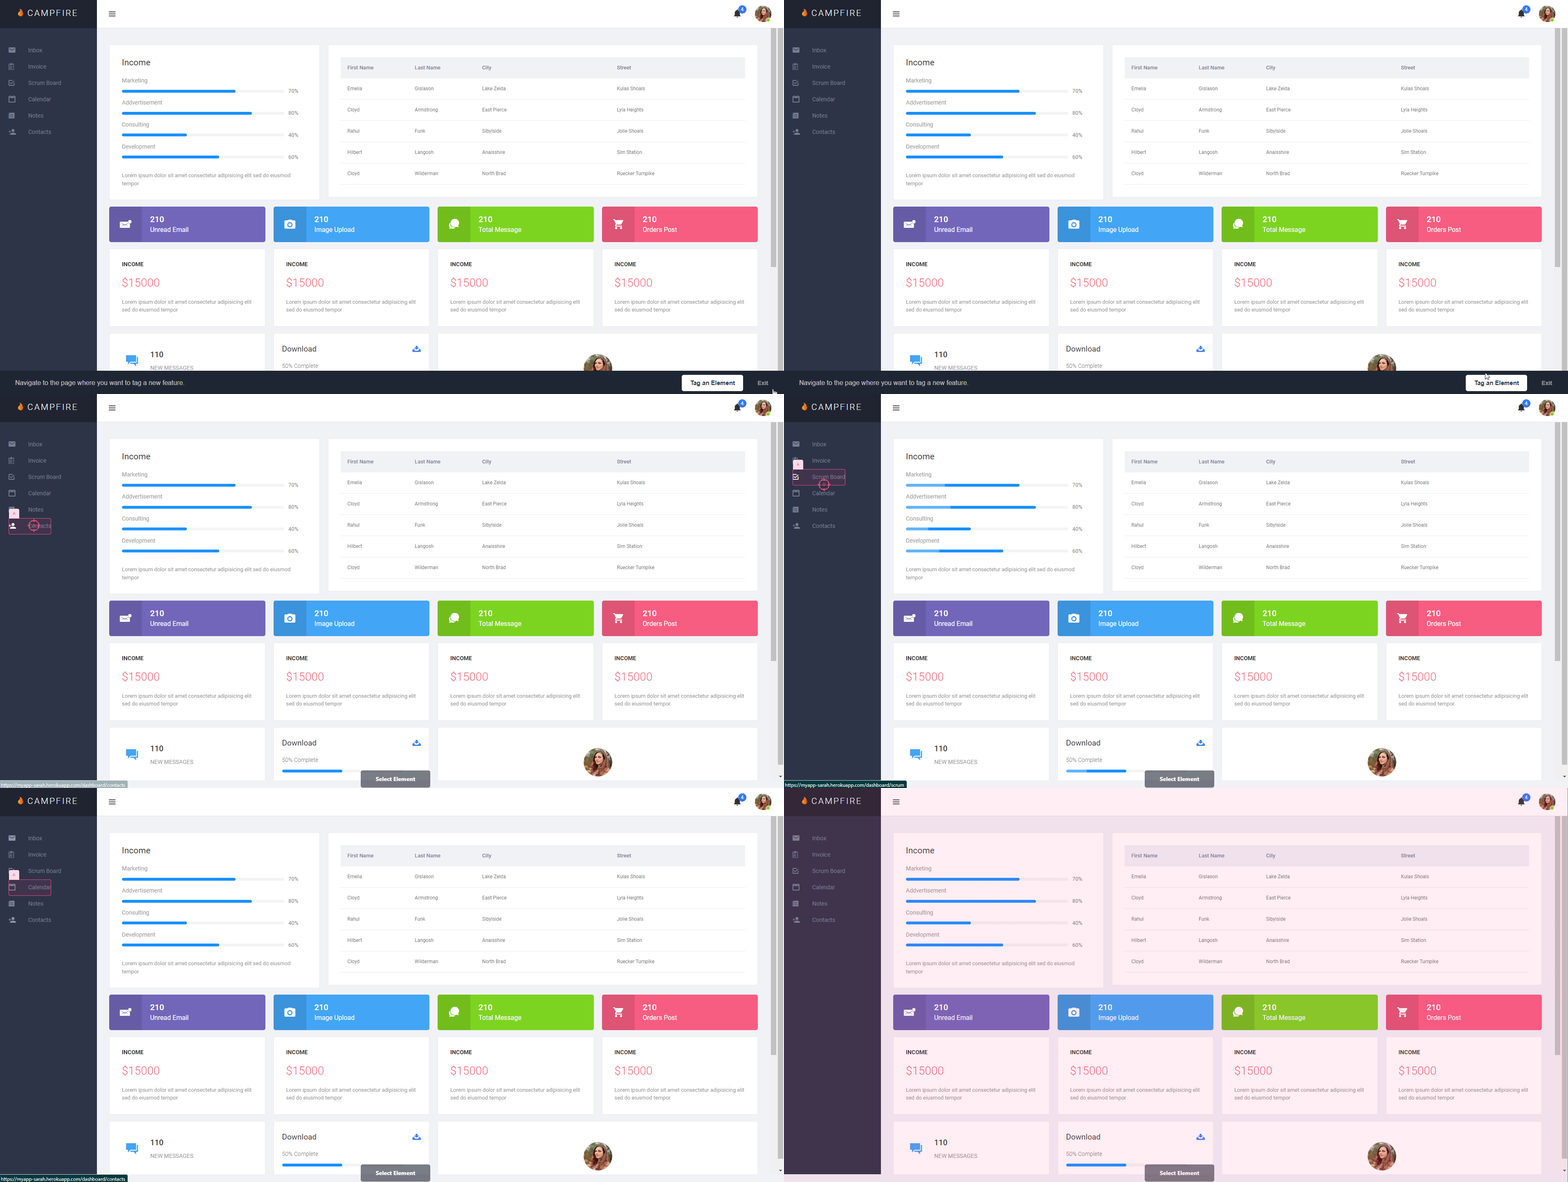
- Feature tagging: Feature tags let you tag specific elements in your website/app so that you can track user interactions with the feature. The data from all essential elements lets you measure product usage.
Use customer data to trigger real-time communication
Customer data allows you to build audience segments for engaging users in real-time communication. You can trigger in-app communication about multiple things like feature usage, product upgrades, webinar invitations, new feature announcements, etc.
For instance, if a user is showing low engagement with a key feature, you can trigger in-app guidance, such as an interactive walkthrough, to help the user as they interact with the feature.
How to apply this trend?
To apply this trend, you need to:
- Capture customer data: The four major types of customer data to collect are user persona, user behavior, customer journey activity, and customer satisfaction data. Along with goal tracking, feature tagging, and event tracking, you can collect user feedback from in-app surveys like user persona surveys and customer satisfaction surveys.
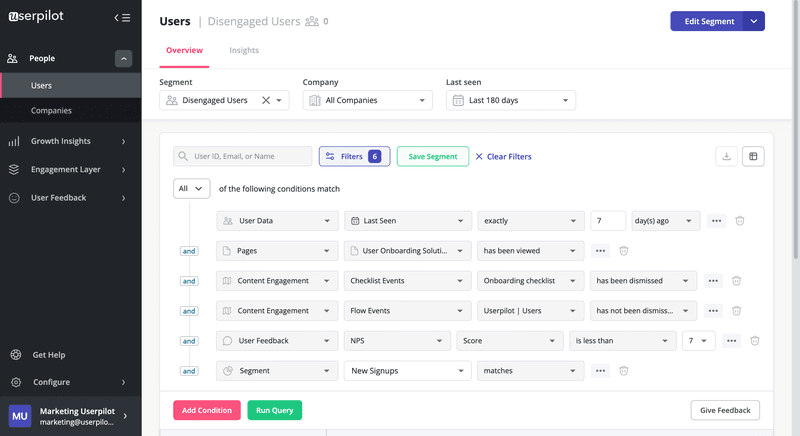
- Segmentation: You can segment customers based on common characteristics such as user role, company, jobs-to-be done, etc. You can create multiple user segments, like new users, active users, disengaged users, etc., to trigger personalized communication for each of them.
Collect both quantitative and qualitative data
You can’t get the complete picture without combining quantitative and qualitative data.
For example, the Net Promoter Score survey asks users to recommend their likelihood of recommending your product to others on a scale from 1-10. The quantitative output lets you distinguish among promoters (scores 9-10), passives (scores 7-8), and detractors (scores 6 or less).
To understand the challenges your detractors face, you can add a qualitative follow-up question to learn the exact reason behind their scores. You can then proactively contact them with personalized solutions to improve customer satisfaction.
How to apply this trend?
- Surveys: You can create both interaction-based and passive in-app microsurveys and trigger these surveys contextually to relevant customer segments.
- Event tracking: You can set up and track events to analyze both qualitative and quantitative data. For example, you can know what features different user segments engage with and monitor metrics like total event count, average feature usage per user, etc.
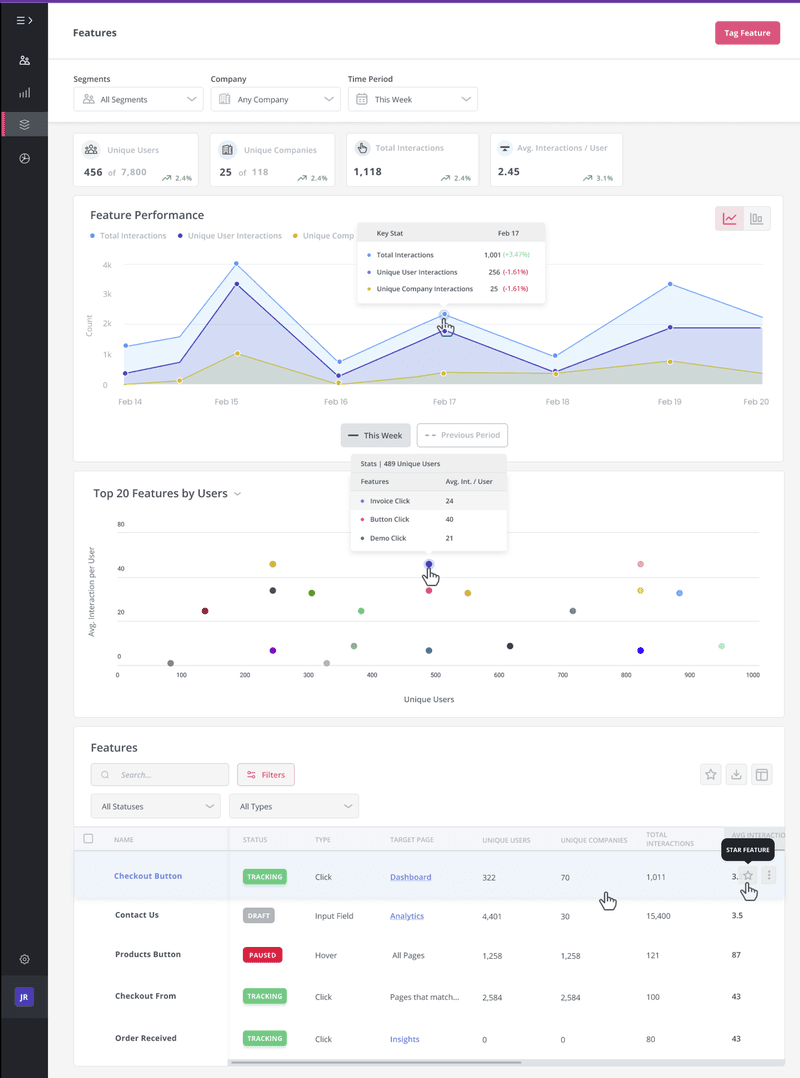
- Dashboards: It’s advisable to use tools that come with customer analytics dashboards that allow you to keep track of key metrics and feature performance.
Enable data sharing for team collaboration
One of the most crucial customer analytics trends is data sharing. You should use no-code growth tools that support team collaboration in both technical and non-technical roles. This allows team members to stay on the same page when looking at data and performing analysis.
How to apply this trend?
You can leverage growth tools that enable comprehensive data collection, encompassing in-app and integrated data sources. Here’s what to look for:
- Data collection for management: You should use growth tools that let you collect data, both in-app (i.e. event-tracking) and via integration.
- Data sharing: To share data, you need to establish data democratization – the process that makes it easier for non-tech employees to access and interpret data. Generally, self-service analytics tools enable the integration of data, such as customer feedback, product analytics data, and support requests to help teams make better decisions.
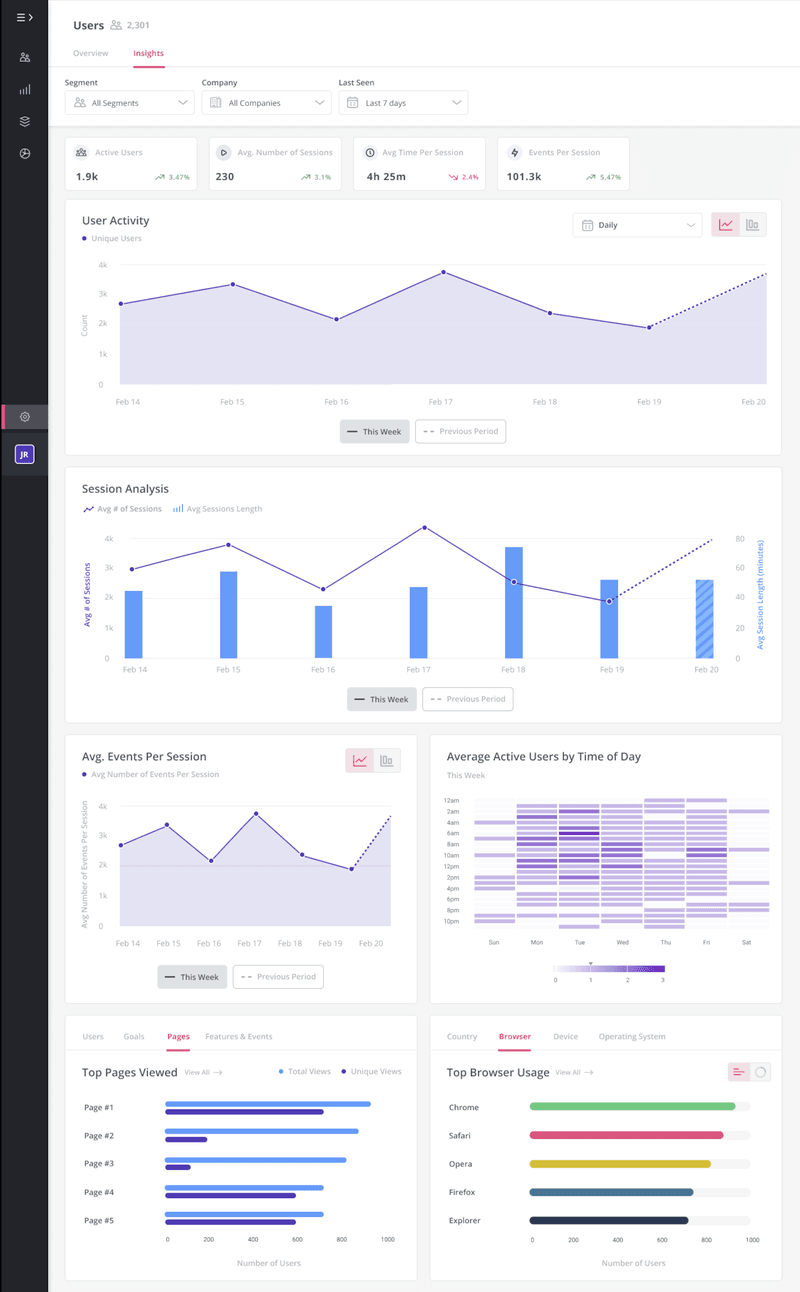
- Analysis for different departments regardless of technical expertise: The tool you choose should make it easy to set up dashboards. Different departments can then share insights with each other for cross-functional collaboration.
Prioritize collecting first and zero-party data
First-party data is typically gathered automatically by your platform or initiated by your brand via surveys, whereas the users initiate zero-party data.
For instance, if a customer chats with a support agent or sends an email to provide feedback, it creates zero-party data.
Prioritizing first and zero-party data collection helps to:
- Prepare for a cookieless future: These two data types don’t share data with other sources. They eliminate the need for third-party cookies, such as those used by Facebook, which use aggregated user data from public and non-public sources.
- Increase data credibility: First and zero-party data are individual data that are highly accurate. Therefore, they can be specifically used to remember user preferences and enhance the customer experience.
- Ensure data privacy: Unlike third-party cookies, these two data types don’t track browsing activities across other sites and thus are more respectful of user privacy.
How to apply this trend?
You should use tools that enable first and zero-party data collection to apply this customer analytics trend.
Your resource center should have an option, like live chat, for users to freely share their feedback or queries to provide zero-party data.
Furthermore, these tools should have features to create surveys and track events. You can collect first-party data by triggering surveys at relevant touchpoints in the customer journey. You can also do so by creating events to track user activities.
Adopt artificial intelligence and machine learning
Emerging as one of the most popular customer analytics trends, artificial intelligence and machine learning are used for automation or processing large amounts of data.
Leveraging AI-powered solutions lets you optimize your business interactions with customers. You can dive deeper into customer behavior and needs and deliver personalized, seamless experiences at scale.
How to apply this trend?
Here’s how you leverage AI and machine learning:
- Use tools with predictive analytics: These tools use statistical algorithms and machine learning to analyze churned customers and identify patterns as to why they have left. This helps you improve your churn prevention efforts. You can also predict the future behavior of existing customers by monitoring in-app engagement to find improvement opportunities.
- Use AI chatbots: They allow for both automation and analytics (i.e., identify common issues to continually build support scenarios for chatbots). Chatbots are especially helpful in giving prompt solutions to customers and ensuring a smooth flow of zero-party data.
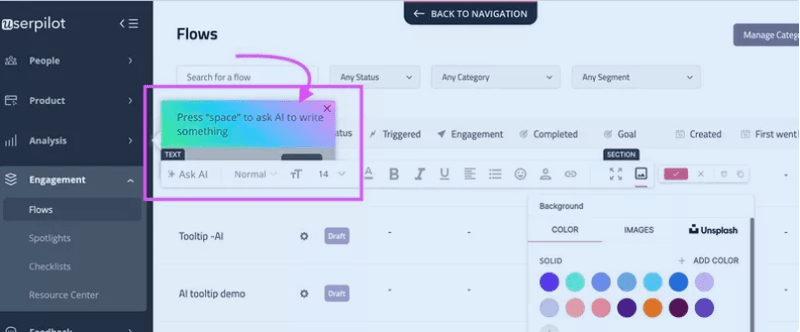
- Use AI to improve messaging: You can use AI to streamline the process of creating personalized content in onboarding flows. In the example below, AI takes a prompt to write a tooltip message that you can accept, change, or discard.
Implement testing for customer engagement analytics
You can use A/B testing or multivariate testing to analyze what’s better for driving engagement on a page or feature and help optimize customer engagement.
How to apply this trend?
You need to use tools that enable A/B testing. You should be able to easily set up tests, choose an audience, decide on variants, visualize results, etc.
Here are two types of A/B tests:
- Controlled A/B test: For example, you can trigger checklists for 50% of customers and nothing for the rest (i.e., the controlled group). You can then study each group’s engagement level to evaluate the effectiveness of checklists in improving engagement.
- Head-to-head A/B test: It provides the same user experience flow in different ways to two groups. Here, 50% of customers would receive a checklist, while the others get tooltips. You can compare the effectiveness of the two flows in helping customers finish onboarding and adopt a certain feature.
On the other hand, multivariate testing refers to testing multiple variables simultaneously by placing all possible combinations against each other. For instance, you can find which combination of elements would optimize your lead optimization page.
Use customer analytics tools for automation
Customer analytics tools enable data analytics automation and create dashboards for analytics.
For instance, if you create a checklist or walkthrough for onboarding, you’ll automatically get stats for analyzing its performance.

How to apply this trend?
Here’s how you can get the most out of automation with customer analytics solutions:
- You should use customer analytics tools that come with built-in analytics. This helps to streamline data collection and analysis. You can get insights into how customers have interacted with various features and thus improve your product.
- Using customized analytics dashboards will help you visualize data according to your specific business needs, thus enhancing data-driven decision-making.
How to gain customer insights and enhance customer experience with Userpilot
Userpilot is a no-code product growth platform that offers various functions for applying customer analytics trends. Its capabilities include:
- Tracking customer behavior: Userpilot supports goal-based tracking, event-based analytics, and feature tagging.
- You can track no-code and server-side events, such as high-volume marketing campaigns, that can only be accessed by your server.
- You can create custom events by grouping several events. The custom event will match when all of the specified events occur.
- Userpilot lets you use custom events in Goals, which help you measure how your flows impact user behavior, like upgrades, feature adoption, etc.
- Surveys: Userpilot lets you build a variety of microsurveys like customer satisfaction surveys, feature request surveys, employee surveys, etc. You can avail of analytics such as NPS response tagging that enhances the quality of insights by analyzing qualitative feedback.
- Set up analytics dashboards: Userpilot offers no-code analytics dashboards, be it for goal tracking, event tracking, or surveys. These allows data sharing to foster team collaboration.
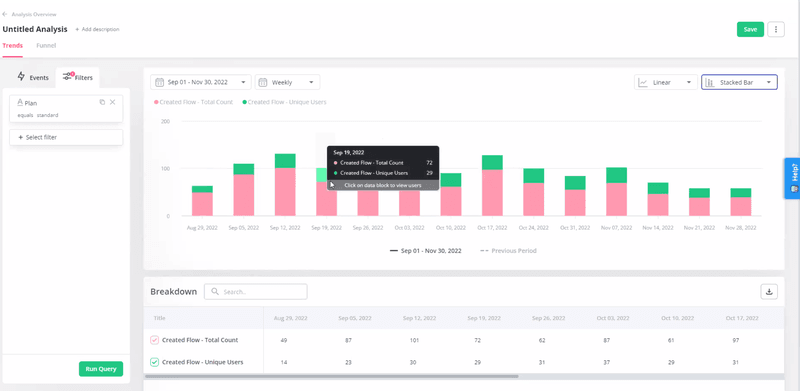
- Analytics functionality: Userpilot offers various analytical functions, like segmentation, funnels, trends, etc.
- Userpilot enables you to segment customers based on multiple shared characteristics like user role, activity level, NPS score, etc.
- Its funnel analysis lets you visualize and analyze how customers progress through stages of the user journey and discover friction/drop-off points.
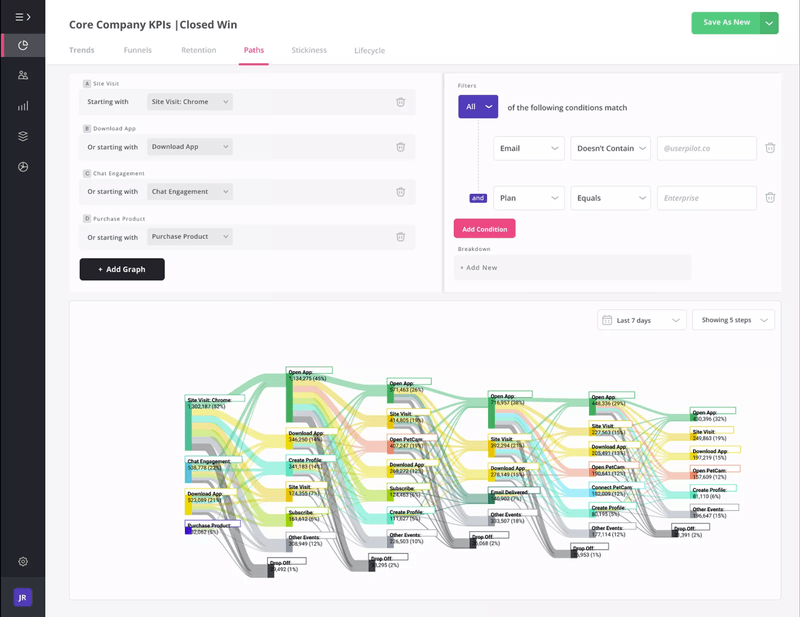
- Its path analysis helps you understand a potential customer’s journey, revealing patterns and opportunities to improve the user experience.
- Enhance customer experience: Userpilot lets you leverage multiple UI elements like tooltips, checklists, modals, and interactive walkthroughs to offer in-app guidance. You can personalize these elements for each user segment for improved customer satisfaction.
Conclusion
A customer-centric approach is the key to unlocking success. The 8 customer analytics trends discussed here are vital to understanding customers thoroughly, exceeding their expectations, and using data to make the job easier for all teams.
Want to start following the customer analytics trends? Get a Userpilot demo and achieve product growth.


