A funnel drop is a sign that something is missing or wrong with your product flow.
It could be a technical issue like slow loading times, a usability problem, or simply because your product lacks a clear value proposition.
Whatever the case, by tracking your drop-off rate, you’ll be better equipped to address the underlying issue and boost engagement.
This article shows you simple steps to do that. You’ll also see some of the best analytics tools for tracking funnel drops.
Try Userpilot Now
See Why 1,000+ Teams Choose Userpilot

What is a funnel drop?
A funnel drop, also known as funnel abandonment, occurs when a user abandons the conversion process without completing the desired action in-app or on a website.
As users move through the journey stages, it’s not uncommon to encounter points where a substantial number of them drop off.
These drop-offs can occur at various stages, such as during onboarding, trials, activation, and even subscription renewal.
Why do SaaS companies track funnel drop-off points?
Understanding where users disengage allows SaaS companies to refine their strategies and address specific pain points. This helps to enhance overall user satisfaction, boost conversion rates, and drive sustainable growth.
Here are three key benefits of tracking funnel drop-offs:
- Improve free trial to paid conversion rates: By tracking funnel drop-off points, you can identify the stages where users are most likely to abandon the free trial and focus your efforts on improving those areas. For instance, if many users are dropping off during the onboarding process, you could reduce the number by offering more comprehensive tutorials or providing more personalized customer support. This targeted approach can increase your conversion rate and boost revenue.
- Improve user experience and retention: After converting from free to paid, you want your users to stay with you for as long as possible. Through funnel analysis, you can spot and address friction points to enhance the user experience and drive long-term retention.
- Increase expansion revenue: Funnel tracking not only reveals where users drop off but also highlights points in the customer journey where upselling or cross-selling opportunities may arise. Capitalize on these opportunities to promote additional features, higher-tier plans, or complementary products and boost expansion revenue.
Common causes behind funnel drop-offs in SaaS
So, what exactly causes funnel drops along the SaaS customer journey? There are several factors responsible, but here are the most common ones:
- Steep learning curve: A steep learning curve can be a significant barrier to adoption for many SaaS products. When confronted with a complex interface or a multitude of features, users may feel overwhelmed and discouraged from continuing to explore the product. This can lead to drop-offs at various funnel stages, from initial sign-up to onboarding and beyond.
- Inadequate customer support: When users encounter problems or have questions about a SaaS product, they often turn to customer support for assistance. Prompt, helpful, and knowledgeable customer support can be a critical factor in retaining users and preventing drop-offs. However, slow or incompetent customer support leads to frustrated users who abandon the product.
- Friction in user experience: A user experience marred by complex navigation, broken links, or technical glitches creates friction. Users may find it challenging to achieve their goals, leading to frustration and eventual disengagement.
- Long time to value: The time it takes for users to realize product value significantly impacts conversion rates and retention. If users spend a long time learning the product, they may lose interest before they experience the benefits.
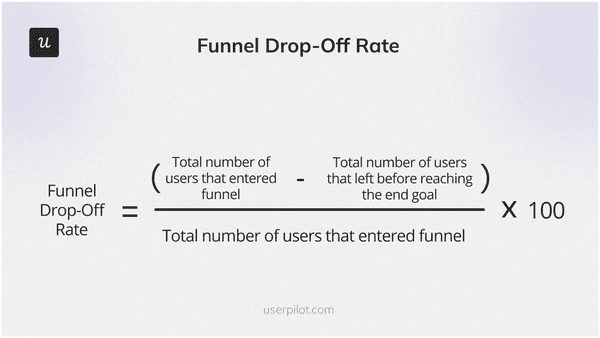
How to calculate funnel drop-off rate
Before stating the formula, it’s important to define what a funnel is, so we’re on the same page.
Generally, a funnel is a pathway users take as they move from awareness about their problem and your solution. It covers the steps they take to try your tool for the first time, your sales process, and user activity post-purchase. There are different kinds of funnels in SaaS, such as the sales funnel, conversion funnel, and activation funnel.
When you view it holistically, a complete funnel consists of different steps, each with its specific goal(s).
Related metrics to track drop-off rates
Measure the following metrics to keep up with changing customer behavior and quickly identify leakages in your funnels.
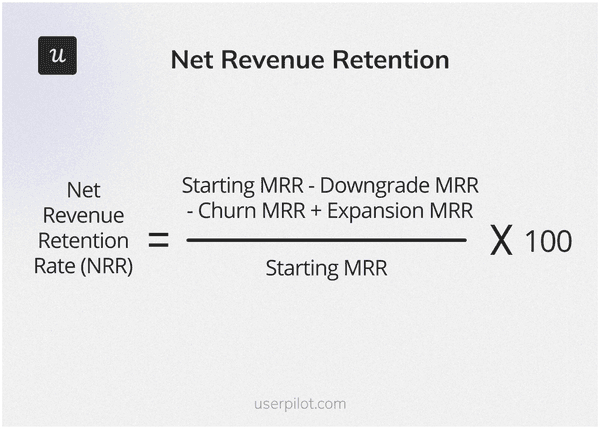
Retention rate
Retention rate is the percentage of users who continue to use your product over a specific period. A high retention rate indicates that users find value in your product, fostering long-term engagement. A drop in retention may suggest issues with onboarding, user experience, or ongoing value delivery.
To calculate your retention rate, use the following formula:
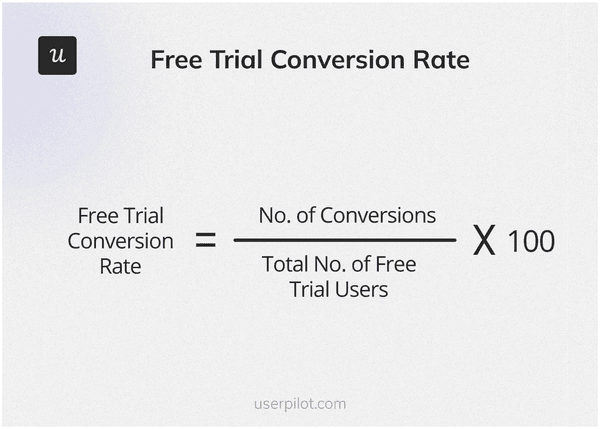
Free trial to paid conversion rate
This metric calculates the percentage of users who transition from a free trial to a paid subscription. It evaluates the effectiveness of converting trial users into paying customers.
A high conversion rate indicates a successful free trial experience and effective product value positioning. A drop signals potential issues in onboarding, pricing clarity, or the perceived value of the paid offering.
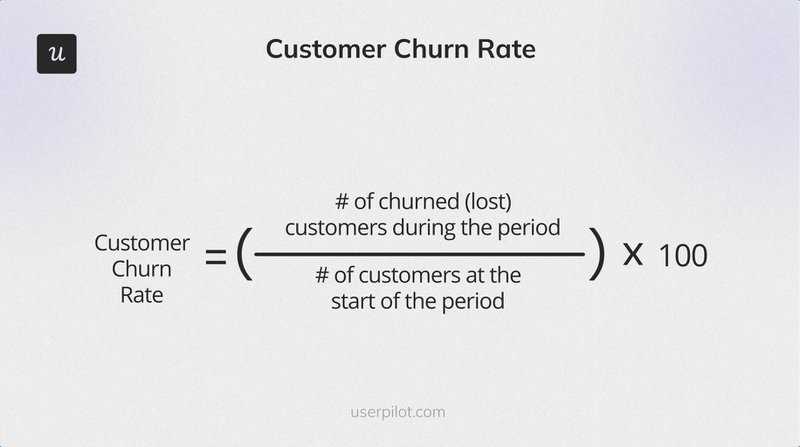
Churn rate
Churn rate measures the percentage of customers who stop using your product over a specific period.
Increased churn rates can signify dissatisfaction, inadequate support, or unmet user needs. Addressing the causes of churn is crucial for reducing funnel drop and improving overall product success.
Average session duration
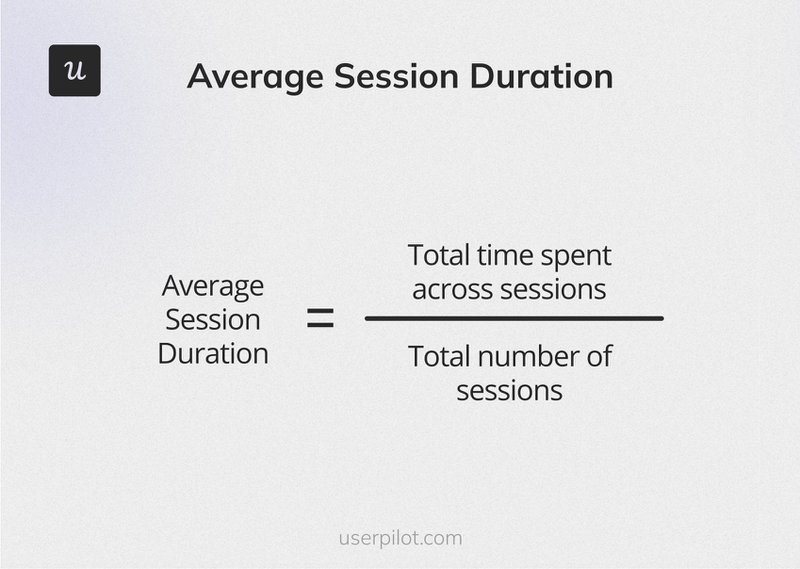
This metric measures the average amount of time users spend actively engaging with your product during a single session.
A longer average session duration generally indicates higher user engagement and interest. A decrease may indicate a lack of compelling features, confusing navigation, or other factors leading to disengagement.
DAU: MAU – Product stickiness
An active user is an individual who interacts with your product regularly.
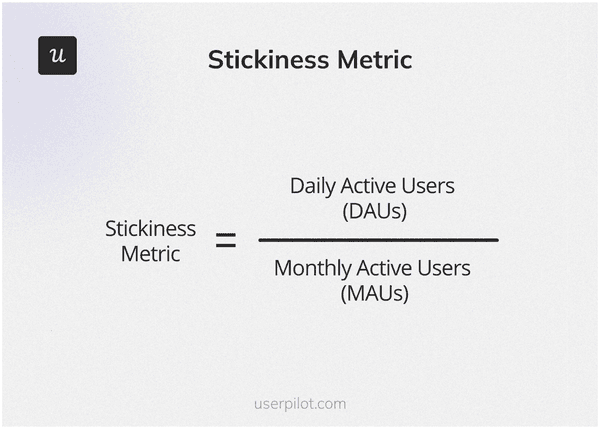
The Daily Active Users (DAU) to Monthly Active Users (MAU) ratio, also known as product stickiness, measures the proportion of monthly users who engage with your product daily. It assesses your company’s ability to retain user interest for long.
A consistently low DAU: MAU is a sign that you need to dig into your user behavior data and address funnel issues.
5 ways to find drop-offs in the user journey
Implement the following quantitative and qualitative measures to identify funnel drops in your product.
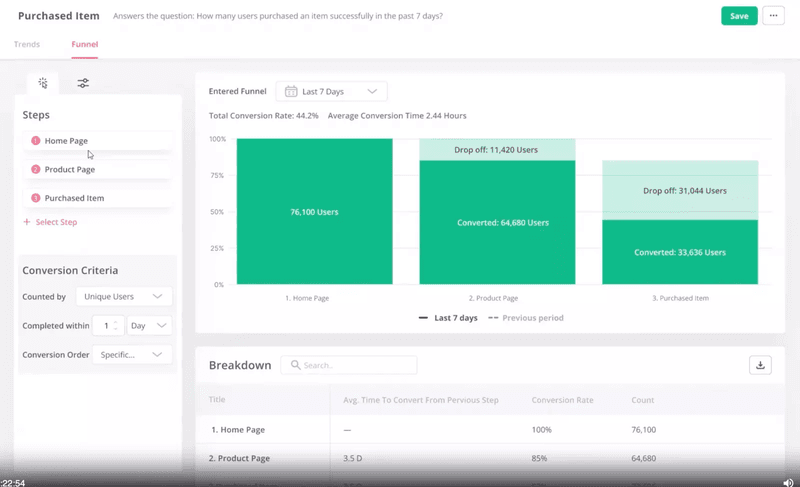
Access conversion funnel data with funnel analysis
Leverage funnel analysis tools like Userpilot to track how users move from the free trial to the paid conversion stage. Identify specific points where users tend to drop off and analyze the user flow at these critical junctures.
Ask yourself: Where are users encountering friction, and what improvements can be made to enhance their experience?
By implementing enhancements at these points, you pave the way for a smoother journey, ultimately leading to increased conversions and a higher number of paid customers.
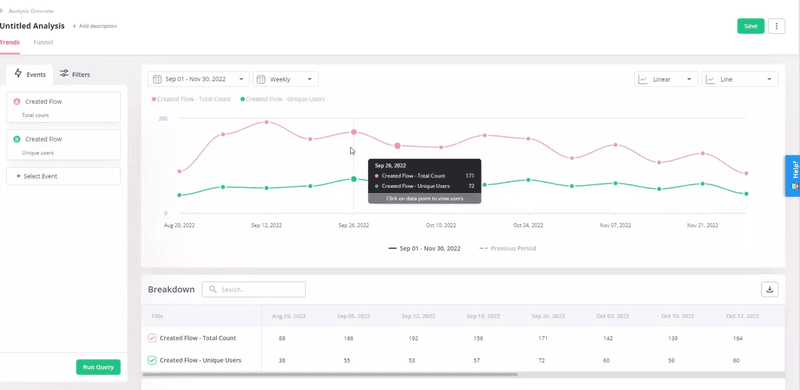
Track user behavior data with trend analysis
Keep a close eye on changes in everyday product usage through trend analysis. Track the usage trends for various features, events, and pages. When you spot dips in user engagement, it’s crucial to investigate the reasons behind these changes.
Dive into the data to understand what might be causing the decline. Is it a specific feature that’s losing popularity, or are users encountering difficulties in a particular section?
This proactive approach allows you to address issues promptly, optimizing the customer journey for sustained engagement.
Collect user feedback with in-app surveys
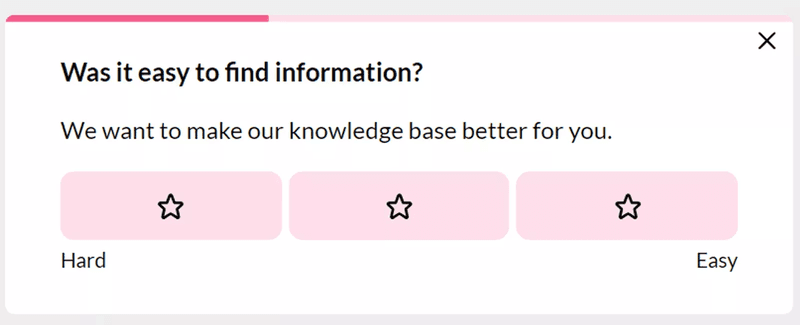
Funnel and trend analysis can give you insights into use behavior, but sometimes, the data is incomplete without feedback directly from users.
Implement in-app surveys strategically to collect user feedback and dig deeper into potential areas of friction.
Trigger surveys at key points in the user journey to understand which features users find challenging or hard to navigate. CSAT and CES surveys work well here. You could also implement contextual NPS surveys.
By directly engaging with users, you gain valuable insights into their experiences and pain points. This approach will enable you to refine your product and eliminate sources of friction, contributing to a more seamless and satisfying user experience.
Use path analysis to find happy paths
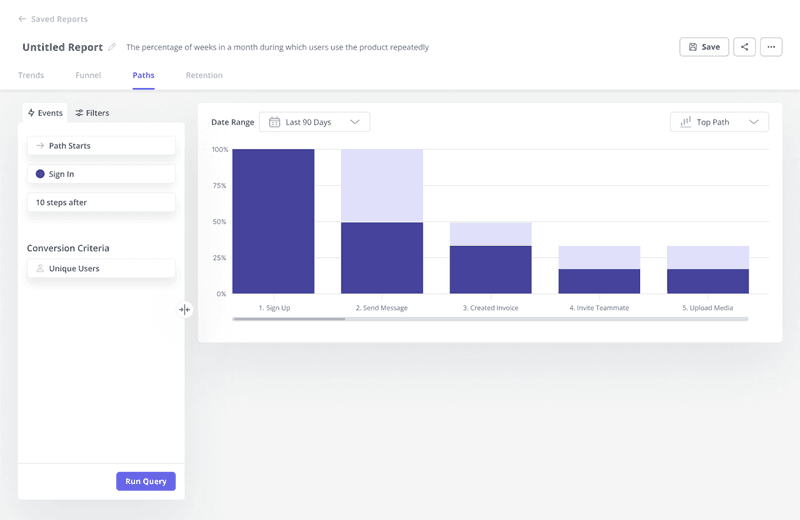
Utilize path analysis to identify happy paths—the most efficient steps users take to reach their end goals within your product.
Compare your happy paths with other paths users take. This will allow you to pinpoint areas of friction or unnecessary steps in the customer journey.
Next, implement strategies like intuitive design and in-app messaging (tooltips, hotspots, modals, etc.) to guide users through the happy paths.
Run A/B tests to locate sources of friction
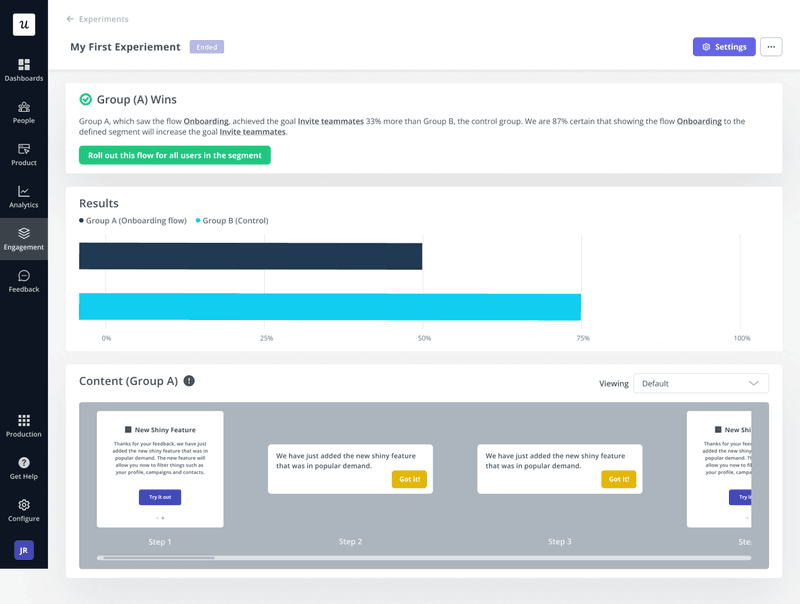
Test new features and UX improvements in areas where you suspect a funnel drop may occur.
If a new variant yields better user engagement, you’ve successfully identified friction. Iterate on these successful changes to continually improve funnel success.
You could also follow the same logic and conduct multivariate tests if you have more than one variable to compare at a time.
Best practices to reduce drop-offs in the user journey
Found several drop-offs in your product journeys? Don’t panic. Implement the strategies below to improve the product experience for both existing and new users.
Personalize the onboarding flow
Your onboarding flow is a critical part of the customer journey and plays a crucial role in determining retention.
Existing customers are more likely to continue using your tool despite friction compared to new users who haven’t exactly experienced your tool’s value.
So, how do you ensure new customers experience as little friction as possible when interacting with your tool?
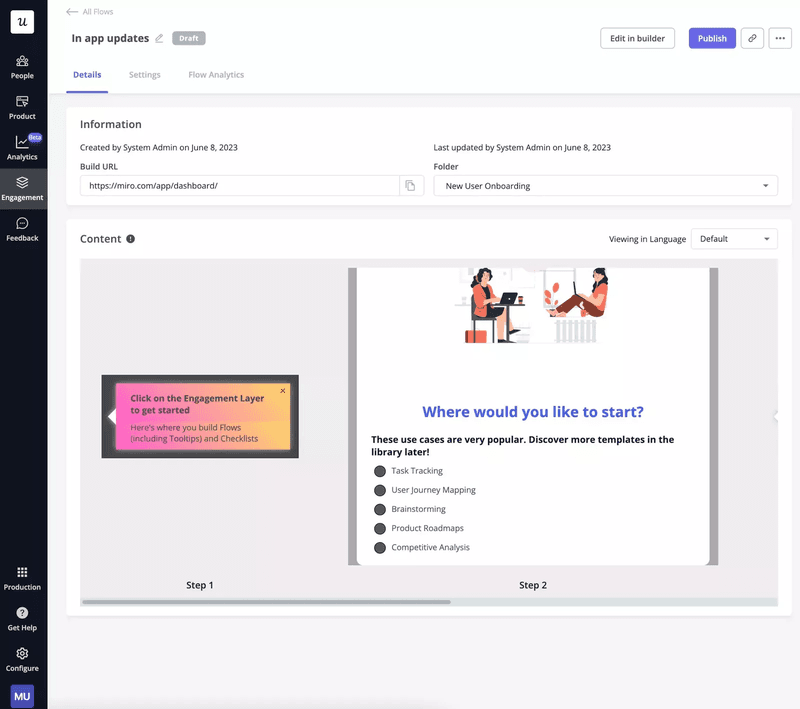
The first step is to collect their data and personalize their onboarding—you can use a welcome screen like the one below to gather data about your new users, understand their JTBD, and segment them to trigger personalized flows.
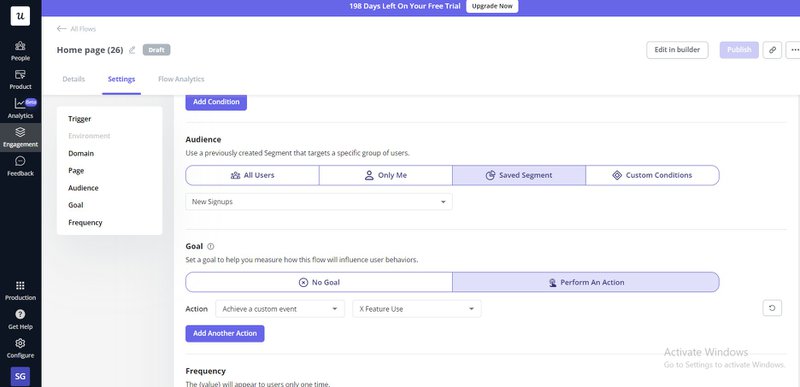
Once you’re done with that step, design interactive onboarding flows to highlight features of value. This lowers the learning curve and time to value, ultimately reducing funnel drop-offs.
Offer secondary onboarding for new features
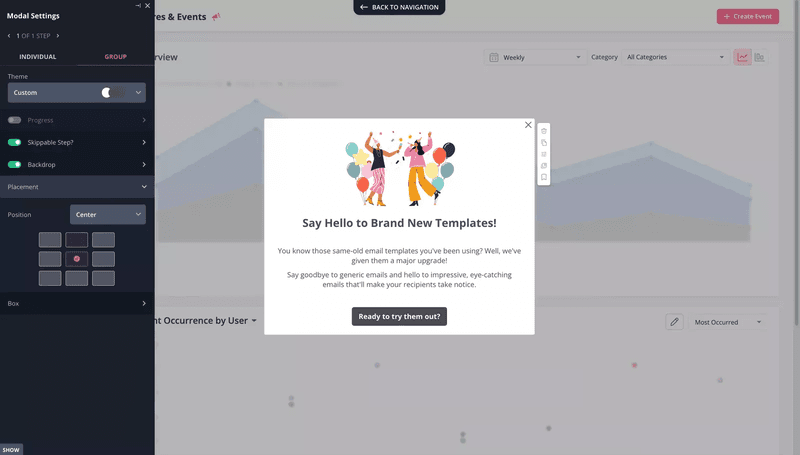
To maintain user engagement and avoid overwhelming users, implement secondary onboarding processes whenever you introduce new features.
Don’t fall into the common trap of assuming existing customers will naturally find new updates.
Most users already have established patterns of engaging with your product. Once they log into your tool, they follow those processes, get their tasks done, and log out. Not many will have time to explore and find new things.
It’s your job to notify them about your updates and provide proper guidance on how to maximize the new features.
This practice not only reduces the likelihood of drop-offs associated with unfamiliar features but also fosters a sense of continuous improvement and value delivery, enhancing overall user satisfaction.
Offer proactive customer support
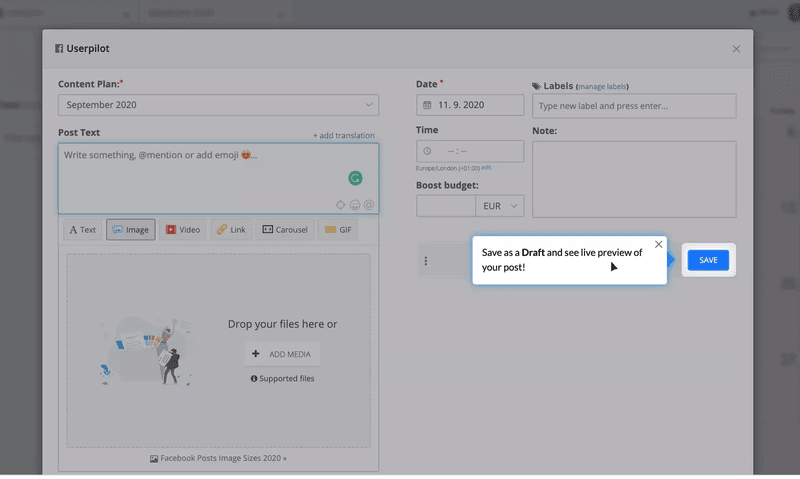
Leverage your funnel drop data to proactively address areas where users face friction in the customer journey. Then, implement tooltips and interactive walkthroughs strategically to guide users through these potential pain points.
Based on the information obtained from analyzing dropoffs, enrich your self-service support center so customers can easily find solutions.
For example, imagine you have a project management tool. Through data analysis, you identify a drop-off point in the onboarding process where users struggle to set up and manage project milestones.
While you address the situation by providing more contextual guidance, you can still have knowledge-base articles or tutorial videos on the subject embedded in your resource center. These will provide additional guidance to users who will need it.
This approach also helps boost engagement—users are more likely to remain engaged when they feel supported and guided through their challenges.
Best analytics tools to identify drop-off points and improve the conversion process
Robust analytics tools let you track customer engagement across the customer journey and measure other related funnel metrics.
Here are three of the best in the market.
Userpilot
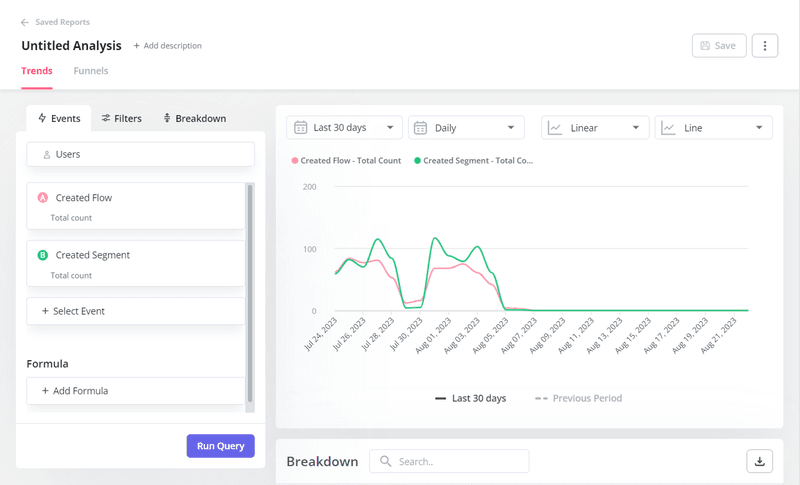
Userpilot is a product analytics tool that helps SaaS companies like you track funnel drop-offs, among other things.
Key features include:
- Funnel analysis: Track and analyze how users progress through your product. Spot friction in your conversion process and implement changes to reduce the drop-off rate.
- Trend analysis: Measure daily, weekly, or monthly changes in user behavior. Use the data to track funnel performance and make required changes to prevent large drop-offs.
- Path analysis: Identify happy paths, prompt users to follow them, and reduce distractions.
- Feedback surveys: From NPS to CSAT and CES surveys, Userpilot lets you trigger contextual open and close-ended questions to learn more about the user experience. Built-in survey analytics provide useful insights from survey results.
- A/B testing: Conduct controlled or head-to-head A/B testing, depending on your needs. You can also conduct multi-variate testing to test several different variations in one go.
Userpilot’s pricing starts at $299/month (billed annually). The starter plan has the basic analytics you need to effectively track funnel drop-off rates.
Google Analytics
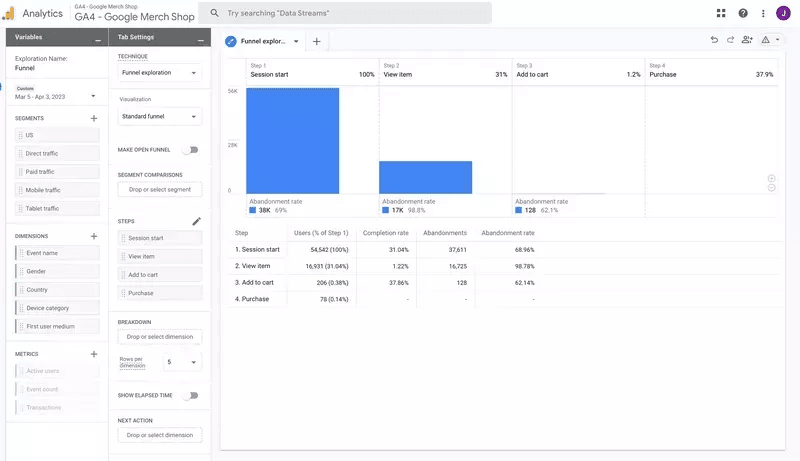
Google Analytics is ideal for tracking how and why visitors drop from your landing pages and other points on your website, helping improve overall website performance.
Key features include:
- Event tracking
- Web analytics
- Funnel analysis
- Path exploration
GA has a free version that’s available to anyone with a Google account. However, there’s a premium version—GA360—that provides advanced features and capabilities for enterprise-level businesses.
The pricing for this isn’t public and is dependent on customer needs.
Hotjar
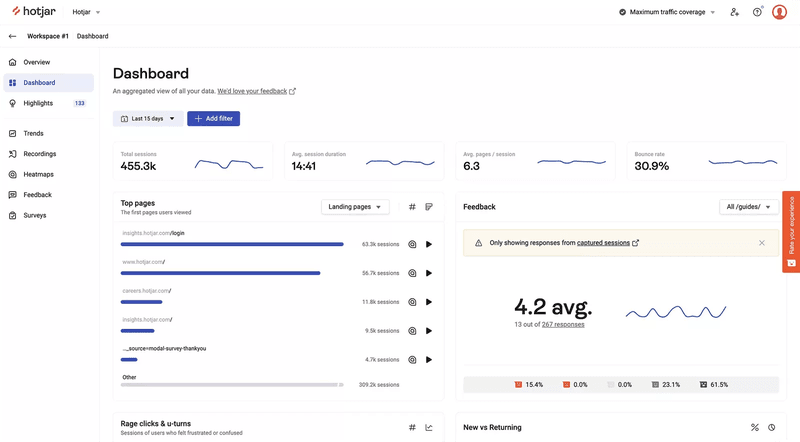
Hotjar is a great tool for session recordings and heatmaps. The platform can help you see how users interact with your app and where they abandon sessions.
Key features include:
- Heatmaps
- Session recordings
- User feedback widgets
Hotjar has a free plan that lets you track a maximum of 35 daily sessions. The paid plan starts at $32/month.
Conclusion
Every SaaS company experiences funnel drop. However, by regularly tracking the user journey, you can proactively address issues and boost conversion rates.
Ready to start reducing funnel drop in your product? Userpilot can help. Book a demo now to see how the platform can help you collect user feedback and access in-app analytics to identify drop-off points.


