How do you leverage product analytics marketing automation to boost customer acquisition, retention, and account expansion?
If you’re after the answer to this question, you’re in the right place!
From our guide, you will learn:
- What product analytics marketing automation is.
- Why marketers should use product analytics.
- How to collect and analyze data to gain actionable insights.
- Key metrics to track.
- Best product analytics and marketing automation tools.
Let’s get right to it!
Try Userpilot Now
See Why 1,000+ Teams Choose Userpilot

What is product analytics marketing automation?
Product analytics marketing automation refers to using product analytics in the context of marketing automation.
Product analytics is the process of analyzing customer interactions with your product. It focuses on interpreting user data related to product performance and usage.
In marketing, product analytics helps you to track, visualize, and analyze how users interact with a product to design automated marketing campaigns and decide marketing channels that resonate with their target audience.
Is Your Product Analytics Marketing Automation Strategy Complete?
True product analytics marketing automation isn’t just about sending emails. It’s about triggering the right in-app experience based on real-time behavior. Take this quick check to see if you’re fully automated.
When a user drops off during onboarding, how quickly does your automation react?
Does your marketing automation adapt based on which features a user has adopted?
How do you collect feedback to optimize your automated marketing flows?
Automate Growth, Not Just Emails
Effective product analytics marketing automation happens inside the product. Userpilot helps you track behavior and automate personalized in-app experiences that drive activation, retention, and revenue.
Why is tracking product analytics in marketing important?
Product analytics help marketing teams make informed decisions on a range of product performance aspects leading to improved customer satisfaction.
First, tracking product data allows you to gain a deep understanding of user in-app behavior. This insight allows you to better understand what users find valuable and where they face issues.
Why does it matter?
Marketing efforts don’t revolve only around selling the product but also identifying user needs and sharing insights with product teams to inform product development.
What’s more, marketers are responsible for customer retention as much as acquisition, so understanding user pain points is of key significance.
Talking of customer acquisition, product analytics helps marketing teams evaluate the effectiveness of their marketing campaigns and identify ways to improve them. For example, based on the insights, they can showcase the most relevant features to the right customer segments.
Knowing exactly how and when users interact with the product can also help design pricing plans to maximize acquisition and free-to-paid conversions.
How to collect product analytics data for marketing automation?
As most user interactions with SaaS products are digital, it’s very easy to track different aspects of user behavior. Thanks to modern analytics tools, marketers (and product managers) can collect the data effortlessly without writing any code or help from developers.
Label feature events to gather usage data
Feature usage tracking can help teams improve their adoption.
In the past, to track feature usage, you had to attach a JS script to each individual feature. These days, most tools (not all, though) allow you to tag features from the front end.
For example, tools like Userpilot provide a “Visual Labeler” to select and tag features without writing any code. Even better, some tools, like Userpilot, can capture historical data, so you can analyze how users interacted with features even before you started tracking them.
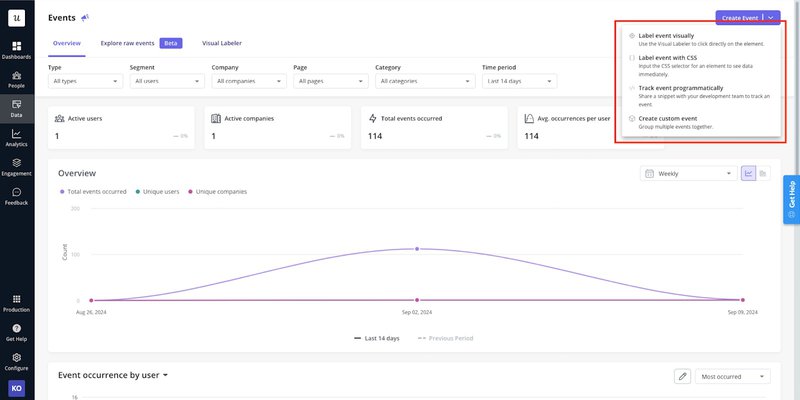
The tracking is not limited to clicks only but also hovers and text input for a more complete picture of user engagement.
Set up custom events to track customer journey stages
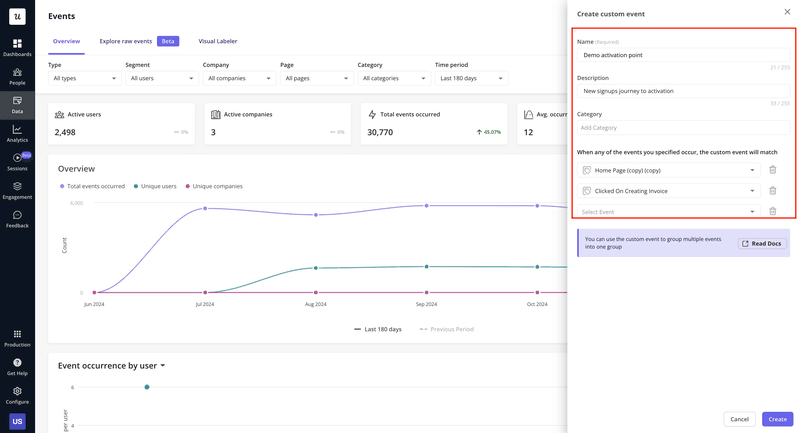
Custom events consist of multiple events and unrelated actions that users complete. They make it easier for teams to identify the moments when users have reached key stages in the user journey.
For example, you could create a custom event that’s made up of multiple activation events. Or one that consists of actions that may lead to user churn.
By tracking such custom events, you can engage each user group more effectively with targeted in-app messaging relevant to their circumstances.
Trigger surveys to collect user feedback data
In-app surveys are an easy way to gather user insights at scale.
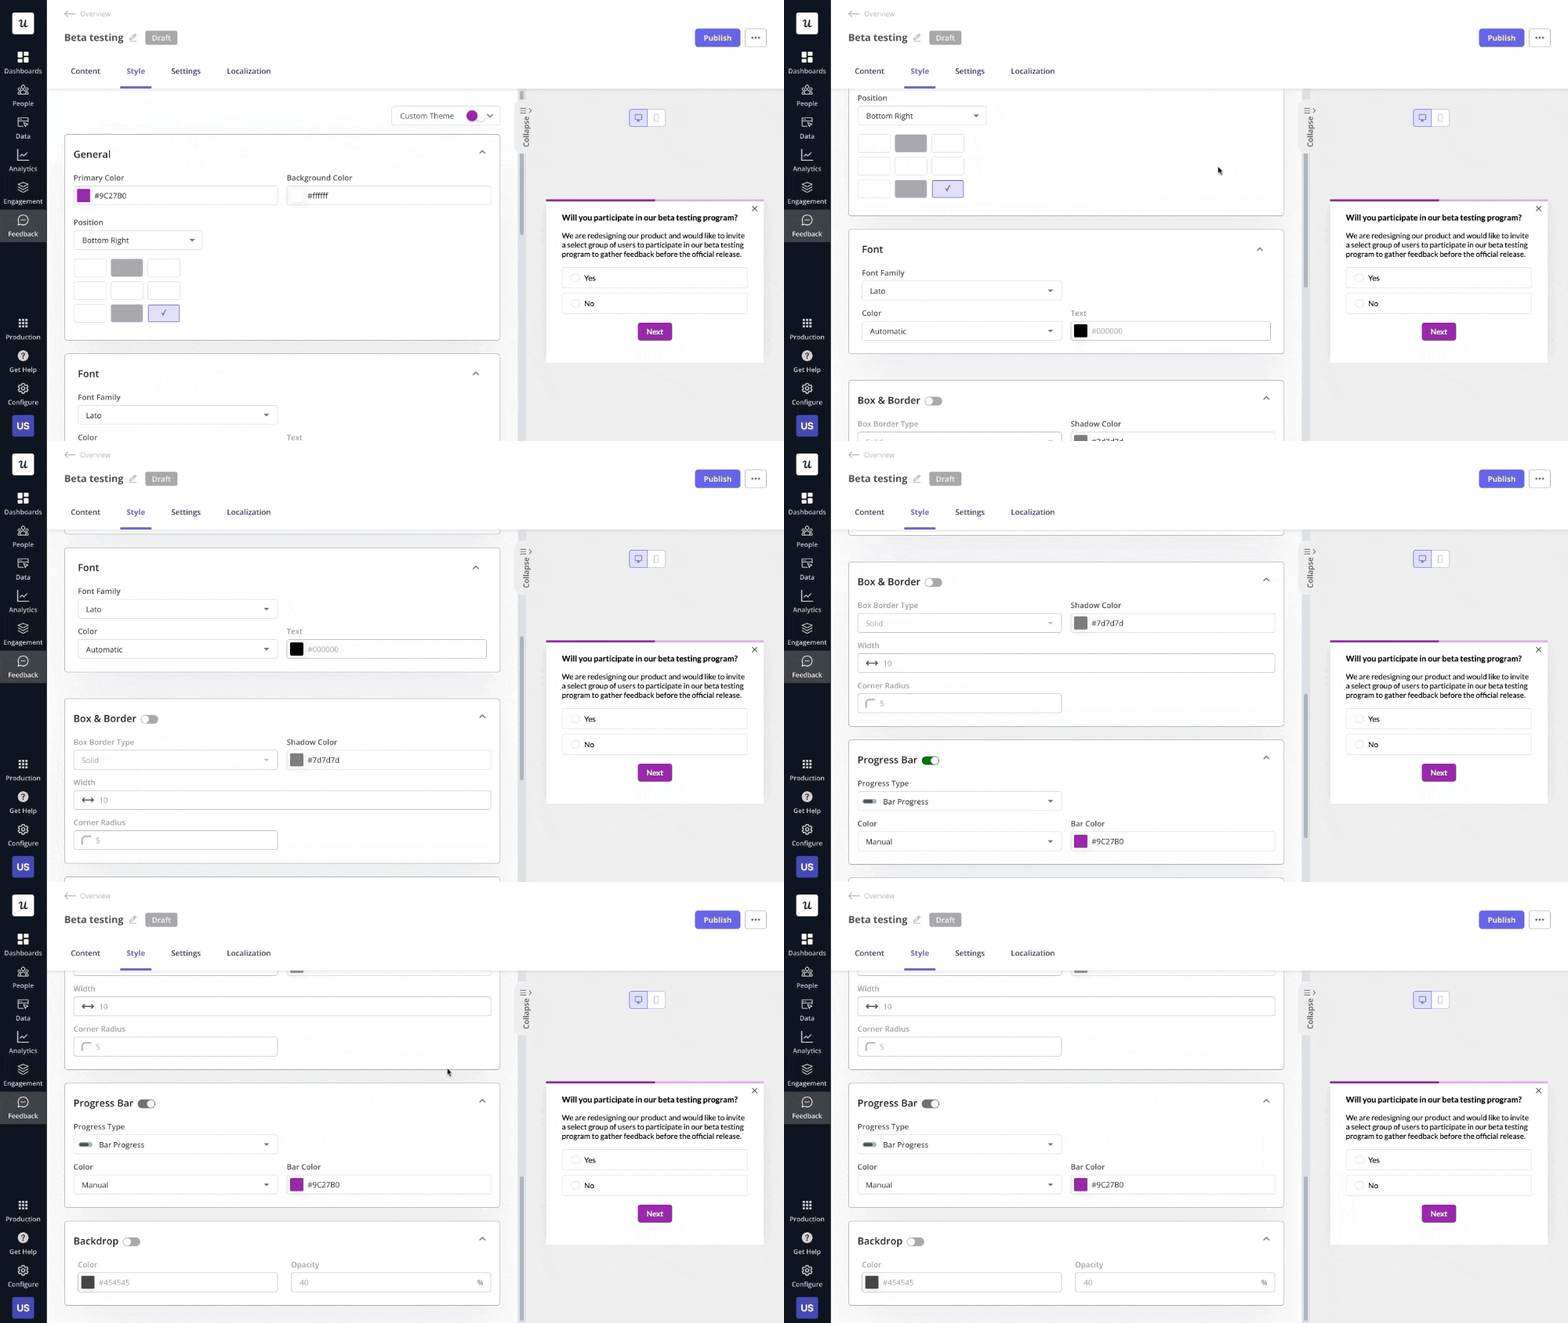
Thanks to visual builders and template libraries that most tools offer, they’re easy to create and customize. You can then trigger them for specific user segments either contextually or at a specific time.
Normally, a survey would consist of closed-ended questions and open-ended ones to collect both quantitative and qualitative data.
Apart from valuable insights, user surveys give you samples of the language that customers use to talk about the product, their problems, and preferences.
This is priceless for marketers who can use it to refine the marketing copy so that it better resonates with their target audience.
Types of product analysis to conduct
How you analyze product analytics data depends on your objectives. Let’s look at a few common types of product analysis along with their use cases.
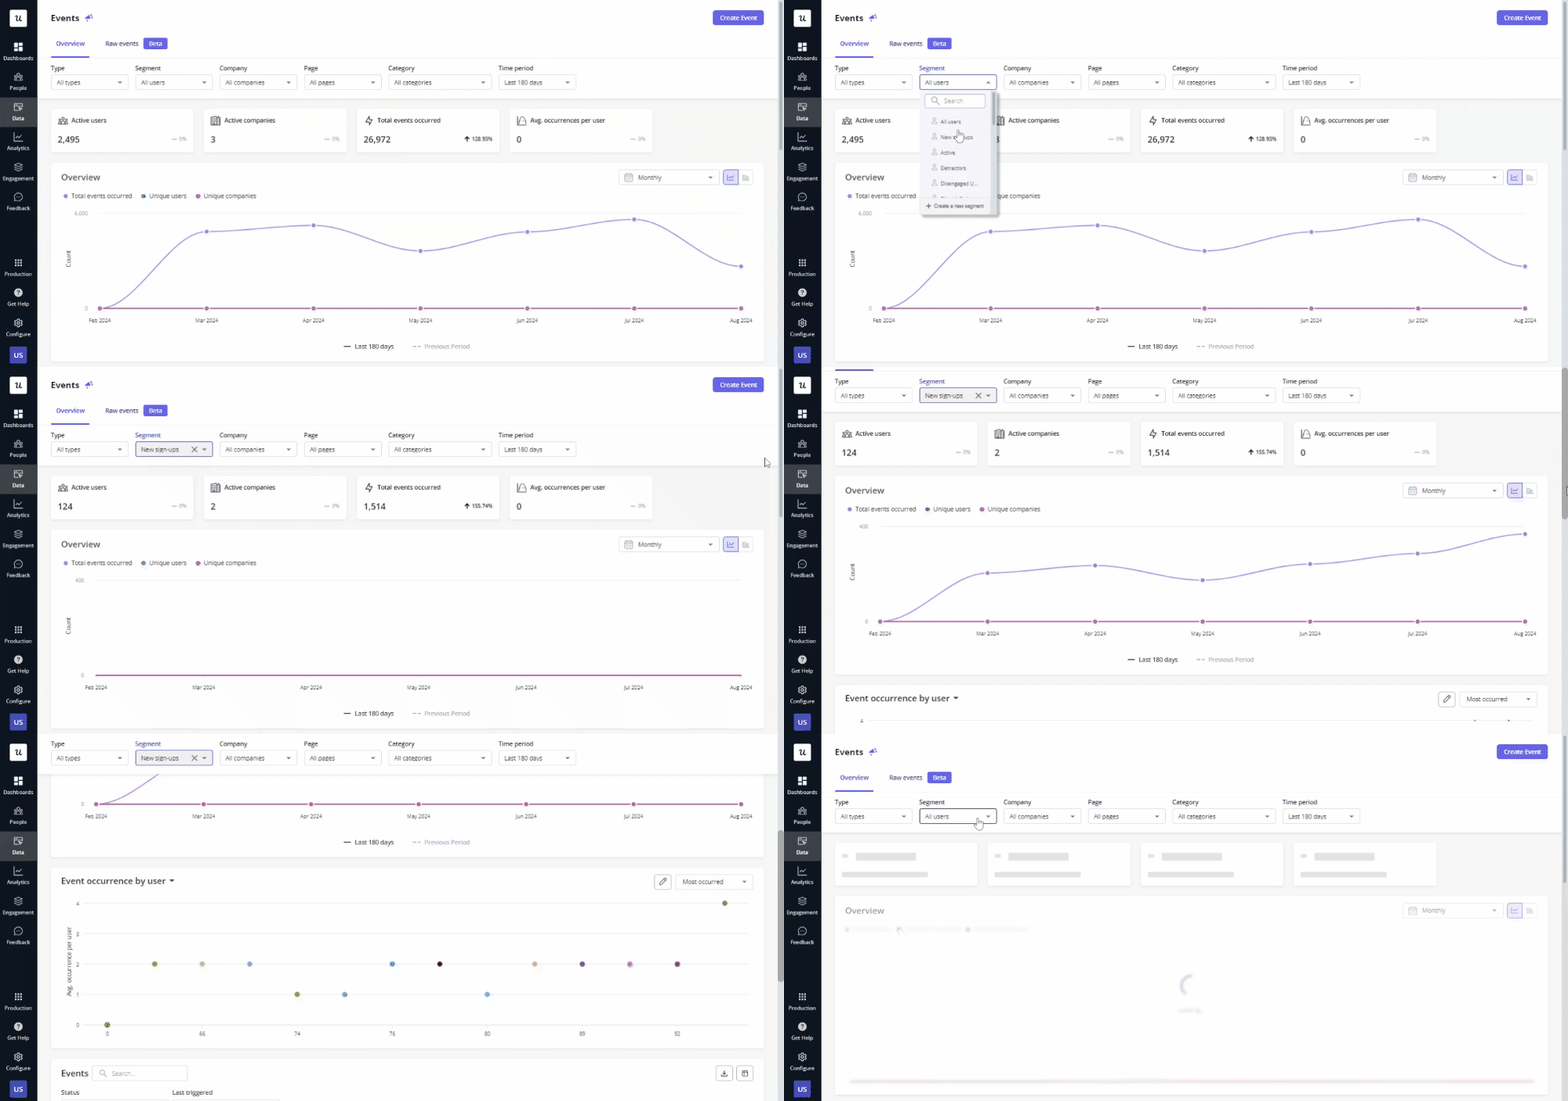
Segment analysis to understand user behavior of similar groups
Segment analysis aims to identify patterns in the behavior of users sharing similar characteristics. For example, users with the same use case, living in the same geographical location, or behaving in a particular way.
Why is this important?
More likely than not, your user base isn’t homogenous. Instead, it’s made up of distinct user groups, each with its own needs and preferences.
Finding trends and patterns for key user segments helps you better understand their unique challenges and expectations, and address them accordingly. This could be through personalized onboarding experiences, contextual in-app guidance, or content localization, to name just a few.
Funnel analysis to identify friction and drop-off points in the user journey
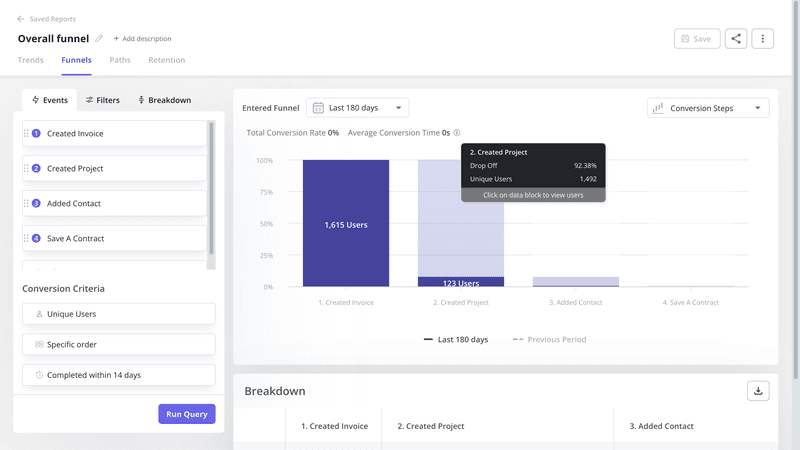
Funnel analysis is all about tracking how users progress from one stage of the user journey to another, towards a predefined goal. For example, how they navigate the website towards the sign-up or make the way through the onboarding flow to activation.
The name comes from the shape of the chart. As users gradually drop off, the bars representing each stage of the journey get narrower towards the end.
If your funnel is very leaky at a particular stage (lots of users drop off), the next bar will be considerably narrower. This makes it super-easy to identify the areas where users experience friction. You can then refine your marketing strategies and tweak the user interface to improve conversion.
User path analysis to monitor user behavior in-app
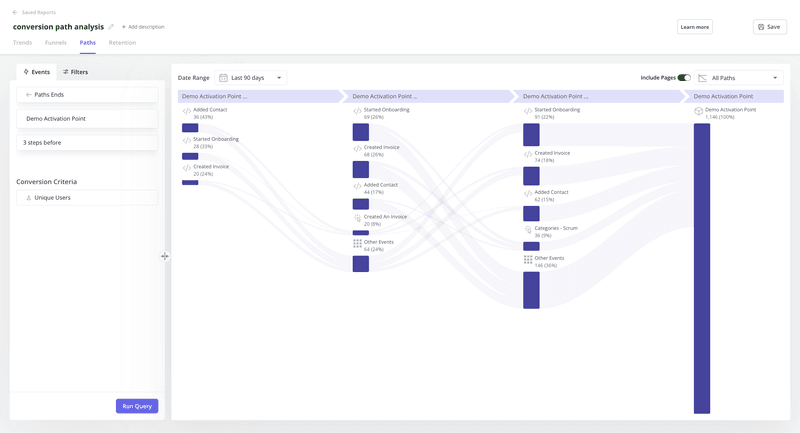
User path analysis is more granular than funnel analysis. It looks at all user actions at each stage of the user journey.
So while funnel analysis can tell you where the friction is, path analysis can help you find its root causes.
Marketing and product teams can also use it to find the most optimal paths for each user segment.
Milestone analysis to track the completion of important user interactions
Milestone analysis focuses on critical events in the customer journey. Milestones are the key interactions with the product that can lead to long-term changes in how the user perceives the product.
For example, completing an activation event is a milestone that increases the chances that the user will stay, while a consistently high NPS score may mean that they’re likely to take part in a referral program.
By tracking these milestones, marketing teams can understand what elements of their product are most effective in retaining and converting customers.
Retention analysis to monitor retention trends
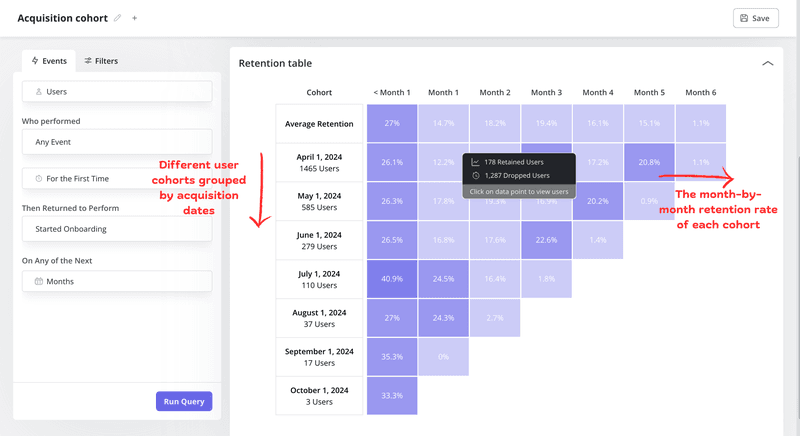
Retention analysis, as the name suggests, focuses on user retention trends over time.
To conduct this kind of analysis, you normally divide your users into cohorts. An example cohort could be all the users that sign up for the product in a particular week.
Next, you track how many of these users come back to use the product on a daily/weekly/monthly basis.
Marketers can use retention analysis to assess if their efforts attract qualified leads. It also allows them to determine when users are most likely to drop off so that they can double down on the effort to retain them.
Apart from tracking trends, retention analysis also helps you find reasons for fluctuations in retention rates or user churn. This requires a more in-depth analysis – for example, funnel or paths analysis.
Feedback analysis to understand user sentiment
Feedback analysis involves two processes.
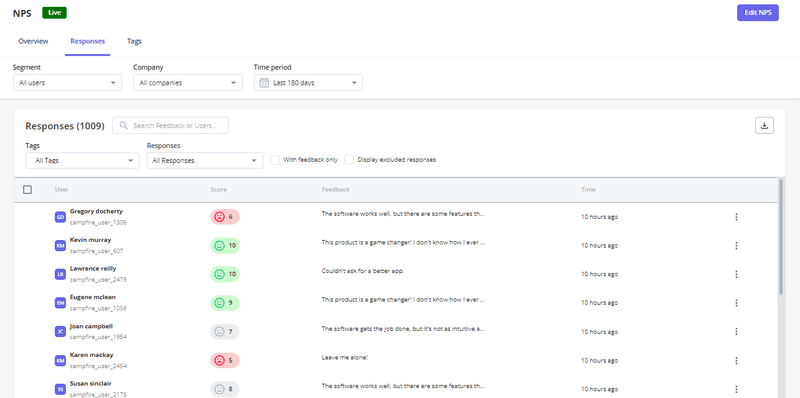
Tracking quantitative data, like the CSAT, NPS, or CES scores, allows you to track your product performance and customer satisfaction levels over time. Visualizing the data can also help you identify reasons for dips – and hopefully, spikes in the trends.
Qualitative feedback, on the other hand, offers marketers insights into the ‘why’ behind the quantitative data trends. That’s how you learn how to improve the product experience to boost customer loyalty and satisfaction.
Qualitative data analysis can be a daunting task unless you have the right tools in your stack. For example, Userpilot allows you to tag NPS responses so that you can identify trends more easily, and its new AI features will soon help you facilitate their analysis even further.
How to optimize performance with product analytics marketing automation?
Even the best insights are of little use if you don’t act on them, so let’s see how you can use them to drive your product growth.
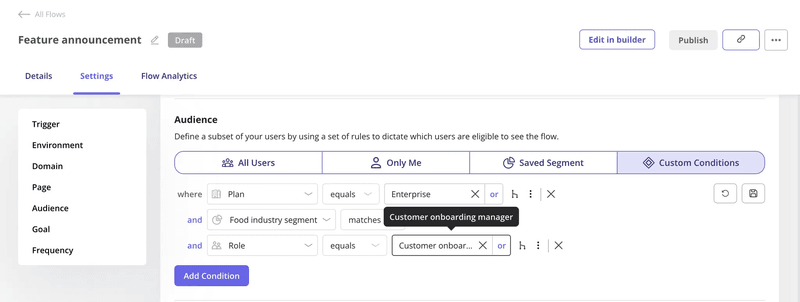
Devise marketing strategies for relevant segments
One way to leverage product analytics is to tailor your marketing strategies for each of your key segments.
For example, if your 2 main segments are small businesses and large enterprise companies, they’re going to need different features to achieve their goals and use different criteria to make their purchase decisions.
For small businesses, it may be the price point, usability, and ability to use the product on the go, while enterprise-level companies will value advanced reporting features and integrations with other tools in their tool stack.
To drive customer acquisition and conversion, you would design marketing campaigns that showcase the relevant features, employing the language that each user segment uses.
Automate onboarding to guide users toward the Aha! moment
User onboarding is one aspect of product experience that benefits massively from personalization and automation.
As different user segments need different features, they’re also going to take different paths to the Aha! moment. Your onboarding flows need to reflect this.
That’s because you want them to experience the product value as quickly as possible. The longer it takes, the higher the risk of losing them.
The good news is that personalized onboarding is easy to deliver.
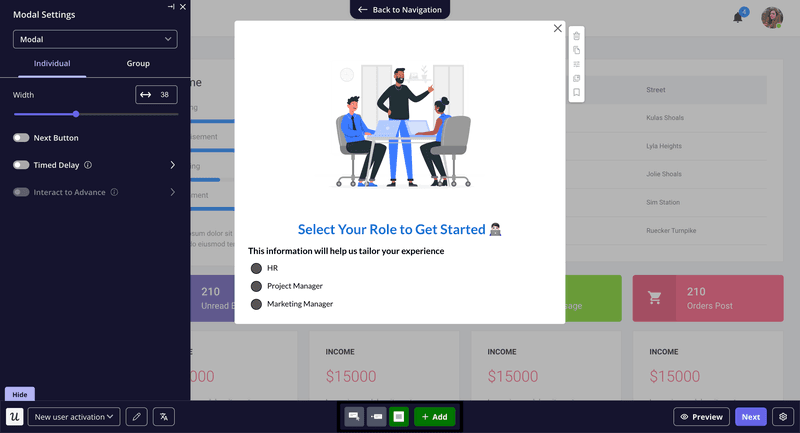
You can start with a welcome survey to collect basic information about the user and their use case and then automatically trigger an interactive onboarding flow that will help them discover the key features.
Increase user engagement with contextual in-app messages
Users who reach the activation stage can still easily churn if don’t keep them engaged. One way to do it is with contextual in-app messages.
For example, you can use them as part of secondary onboarding, to introduce more advanced features or announce new functionality and updates.
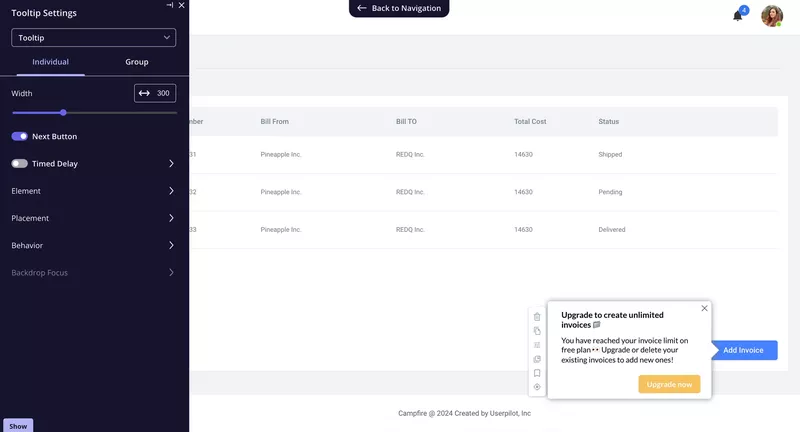
Once users are ready, in-app messages are great for driving upsells and cross-sells. For example, when the user reaches a usage limit, you can trigger a modal, nudging them to upgrade.
Automate survey collection to measure customer satisfaction
Contextual triggering is also great for feedback collection. For instance, if the user engages with a new feature, it can automatically trigger a survey to ask them for their insights.
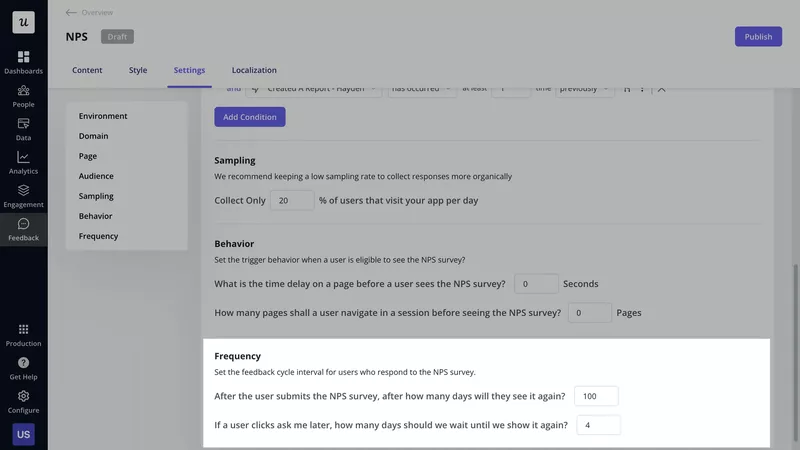
Another way to automate feedback collection is by scheduling your surveys at regular intervals so that you can consistently track user satisfaction. For example, you could set your CSAT or NPS surveys to run every 100 days.
Product analytics metrics to monitor
Talking of key metrics, here are a few that you may want to track.
- Activation rate – the percentage of new users who have reached the activation stage.
- Product adoption rate – the percentage of users who meet your criteria for product adoption (e.g., use the product at least 3 times a week).
- User engagement rate – how often users interact with a product or feature.
- Customer retention rate – the percentage of new sign-ups who keep coming back to use the product again.
- Customer lifetime value – the total average revenue that a customer brings over the duration of their business relationship.
Key features to look for in a product analytics tool
What features should a solid product analytics tool have?
- Relevant analytics features – segmentation, funnel analysis, custom events… whatever you need to achieve your product and business goals
- Real-time data reporting – so that you can act on the insights in a timely manner
- Intuitive UI – for a friction- and frustration-free experience
- Custom dashboards and reports
- Integrations with other (analytics) tools
- Flexible pricing plans – so that you can easily scale up and down your usage
- Quality support and onboarding resources – to flatten the learning curve and help with implementation
The best product analytics software tools for SaaS companies
The three product analytics tools we cover below tick many if not all the boxes above.
Userpilot – product growth tool for desktop apps
Userpilot isn’t solely an analytics solution but a product growth platform. And yet, its analytics features make it a good match for dedicated analytics tools.
On top of that, Userpilot offers user onboarding and engagement features so you can automate your personalized marketing campaigns inside your app like feature announcements, product updates, contextual account expansion, etc.
So, what are the features, really?
- Auto-capture with no-code visual labeler
- Session recordings for actionable insights
- Diverse analytics reports that include trends, funnels, paths, and retention tables
- Analytics dashboards with templates and customization abilities
- Engagement features that come with condition settings for marketing automation
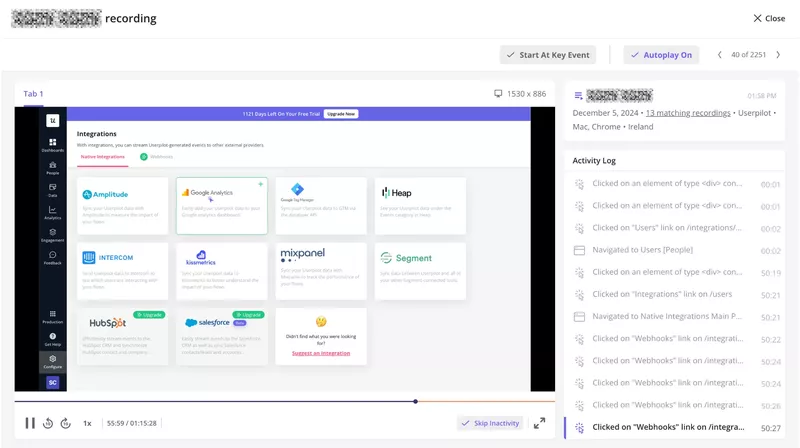
However, Userpilot’s main limitation is that it supports only web apps. But good news is it’ll soon be available for mobile apps.
Amplitude – product analytics solution for mobile apps
If you want a product analytics platform for mobile applications, Amplitude can be a good shout.
As a standalone analytics platform, Amplitude offers comprehensive analytics functionality:
- Segmentation
- Funnel analysis
- Retention and conversion driver analysis
- User timelines
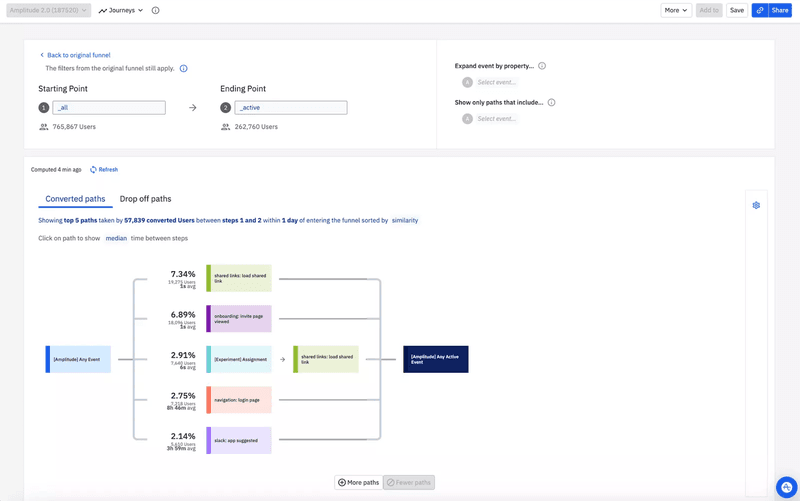
- Pathfinder (for paths analysis)
- Root cause analysis
- A/B test analytics
- Multi-touch attribution
- Predictive analysis
- Integrations with analytics, CRM, and adoption tools
While Amplitude’s analytics features are second to none, it offers no engagement or feedback functionality, you will need to pair it up with other tools.
Google Analytics – free product marketing analytics tool
Google Analytics is a product and web analytics solution used by marketing teams all around the globe.
Considering that it’s a free product, it offers excellent functionality:
- User segmentation
- Page view and event tracking
- Audience reports
- Acquisition reports
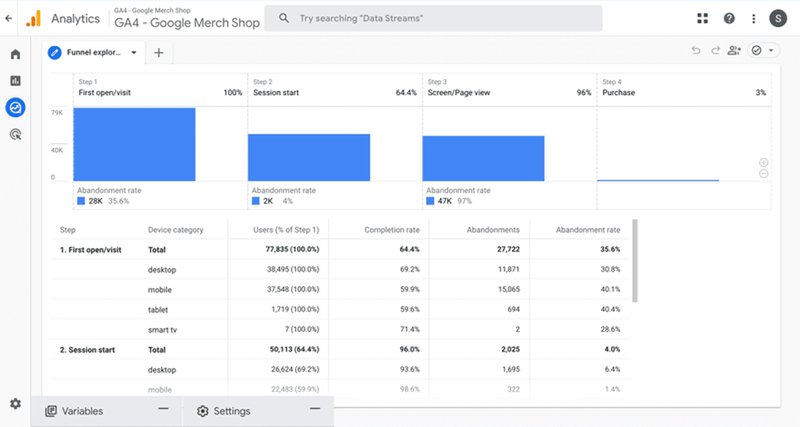
- Funnel analysis and conversion tracking
- Custom data visualization and dashboards
Conclusion
Product analytics enable marketing teams to refine their marketing assets to better communicate the product value proposition to potential and existing customers and improve customer acquisition and retention.
They also enable them to automate their processes and boost their effectiveness and efficiency.
If you want to see how Userpilot can help your marketing team guide and automate their campaigns, book the demo!
Product analytics marketing automation FAQs
What is marketing automation analytics?
Marketing automation analytics involves gathering data from your marketing activities. This includes information like traffic sources, effective channels, campaign KPIs, etc.
What is marketing automation software?
Marketing automation software is tools that help automate repetitive marketing tasks like in-app marketing, email delivery, and lead nurturing. A few popular marketing automation software include Hubspot, Userpilot, MailChimp, etc.
What is the difference between marketing analytics and product analytics?
Marketing analytics focuses on measuring the effectiveness of marketing campaigns (e.g., website traffic, lead generation, etc.). Meanwhile, product analytics focuses on understanding user behavior within the product itself (e.g., feature usage, user engagement, etc.).


