
Think you know how users interact with your product? Think again. Product usage analytics reveals the truth – where users get stuck, what features they love, and why they churn.
This article breaks down everything you need to know:
- The difference between product usage analytics and marketing analytics.
- The main benefits of product usage analytics.
- How to collect and analyze product usage data.
- Key metrics to track.
- How to harness the power of product analytics to improve customer experience.
With that out of the way, let’s dive right in!
Try Userpilot Now
See Why 1,000+ Teams Choose Userpilot

What is product usage analytics?
Product usage analytics is the practice of tracking and analyzing how users interact with a digital product.
This involves tracking user behavior inside the product, for example, how many users use it, how often, which features they use, or how they navigate through the product.
This data can then be used to improve the product, develop better user onboarding experiences, and optimize the overall customer experience.
Product usage analytics vs. marketing analytics
Product usage analytics and marketing analytics focus on different aspects of product performance.
As mentioned, product usage analysis focuses on customer behavior in-app to better understand their pain points, needs, and preferences. Its aim is to identify ways to improve the product, optimize user experience, and drive user engagement.
Marketing analytics, on the other hand, concentrates on assessing the effectiveness of marketing efforts. It involves analyzing data related to customer acquisition, conversion rates, marketing channels, and ROI. Its key objective is to optimize marketing activities and allocate resources effectively to drive customer acquisition and retention.
To achieve their objectives, both kinds of analytics use different tools and data sources and track different metrics.
What are the benefits of product usage analytics?
Product usage analytics is like having a detailed map of your product. It shows you exactly how users are navigating through your features, where they’re getting stuck, and what paths lead to success. This data is invaluable for building a product that users love and driving business growth. Here’s how:
- Prioritize features: Understand which features are most popular and which are gathering dust. This data helps you focus your development efforts on what matters most to users.
- Optimize onboarding: Identify friction points in the onboarding process and smooth out the user journey to increase activation rates.
- Reduce churn: Spot patterns that indicate churn risk and proactively address potential issues to keep users engaged and satisfied.
- Drive product-led growth: Identify power users and leverage usage data to encourage upsells and cross-sells.
How to measure product usage data?
Modern analytics tools enable product teams to easily track various aspects of product usage without writing a single line of code.
Track feature usage to analyze user behavior
Tracking product usage allows you to identify how many users utilize a feature and how often.
Thanks to that, your product team can identify the most valuable features you need to prioritize in the future and those you might need to sunset. Feature usage data can also shed light on issues with the onboarding process, which get in the way of smooth feature discovery.
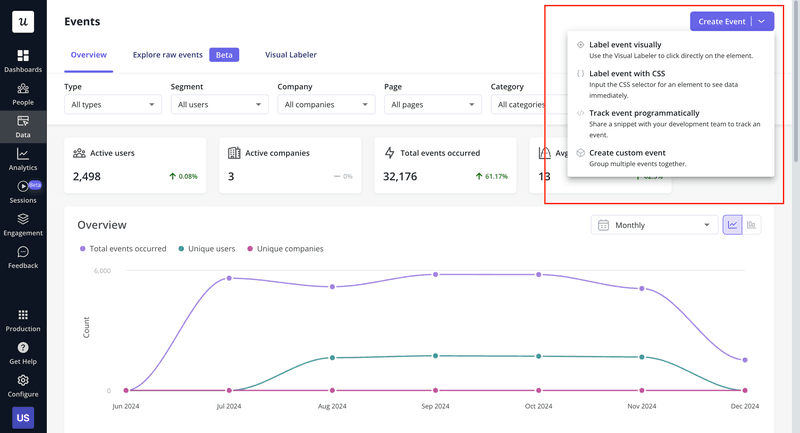
With tools like Userpilot, you can start tracking feature usage from day one with auto-capture. Whenever you need to conduct analysis, you only need to name the events using our no-code visual labeler.
Set up event tracking for important stages in the user journey
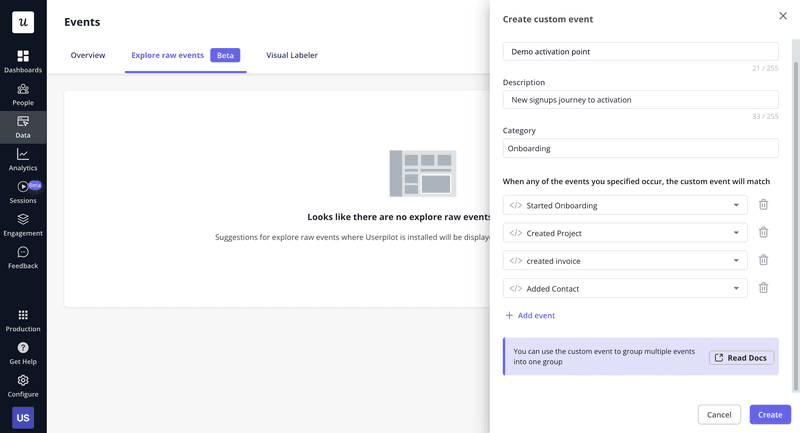
Events are all user’s actions inside the product. These could be individual interactions or combinations of them. We call the latter custom events.
You can leverage event tracking to monitor the user journey inside the product.
All you need to do is decide what events to track in groups and whether they are client- or server-side events. Let’s say you want to check the new user journey to upgrading. This involves key actions such as
- Finishing onboarding checklist (client-side event)
- Reaching the usage limits of their current plan (server-side event)
- Click “Upgrade” (client-side event)
- Finish payment (server-side event)
Then you can use Userpilot to create custom events to track these specific events in groups to see how many new users have utilized your product and eventually upgraded.
Trigger customer surveys to gauge usage frequency
Another way to collect product usage data is through surveys.
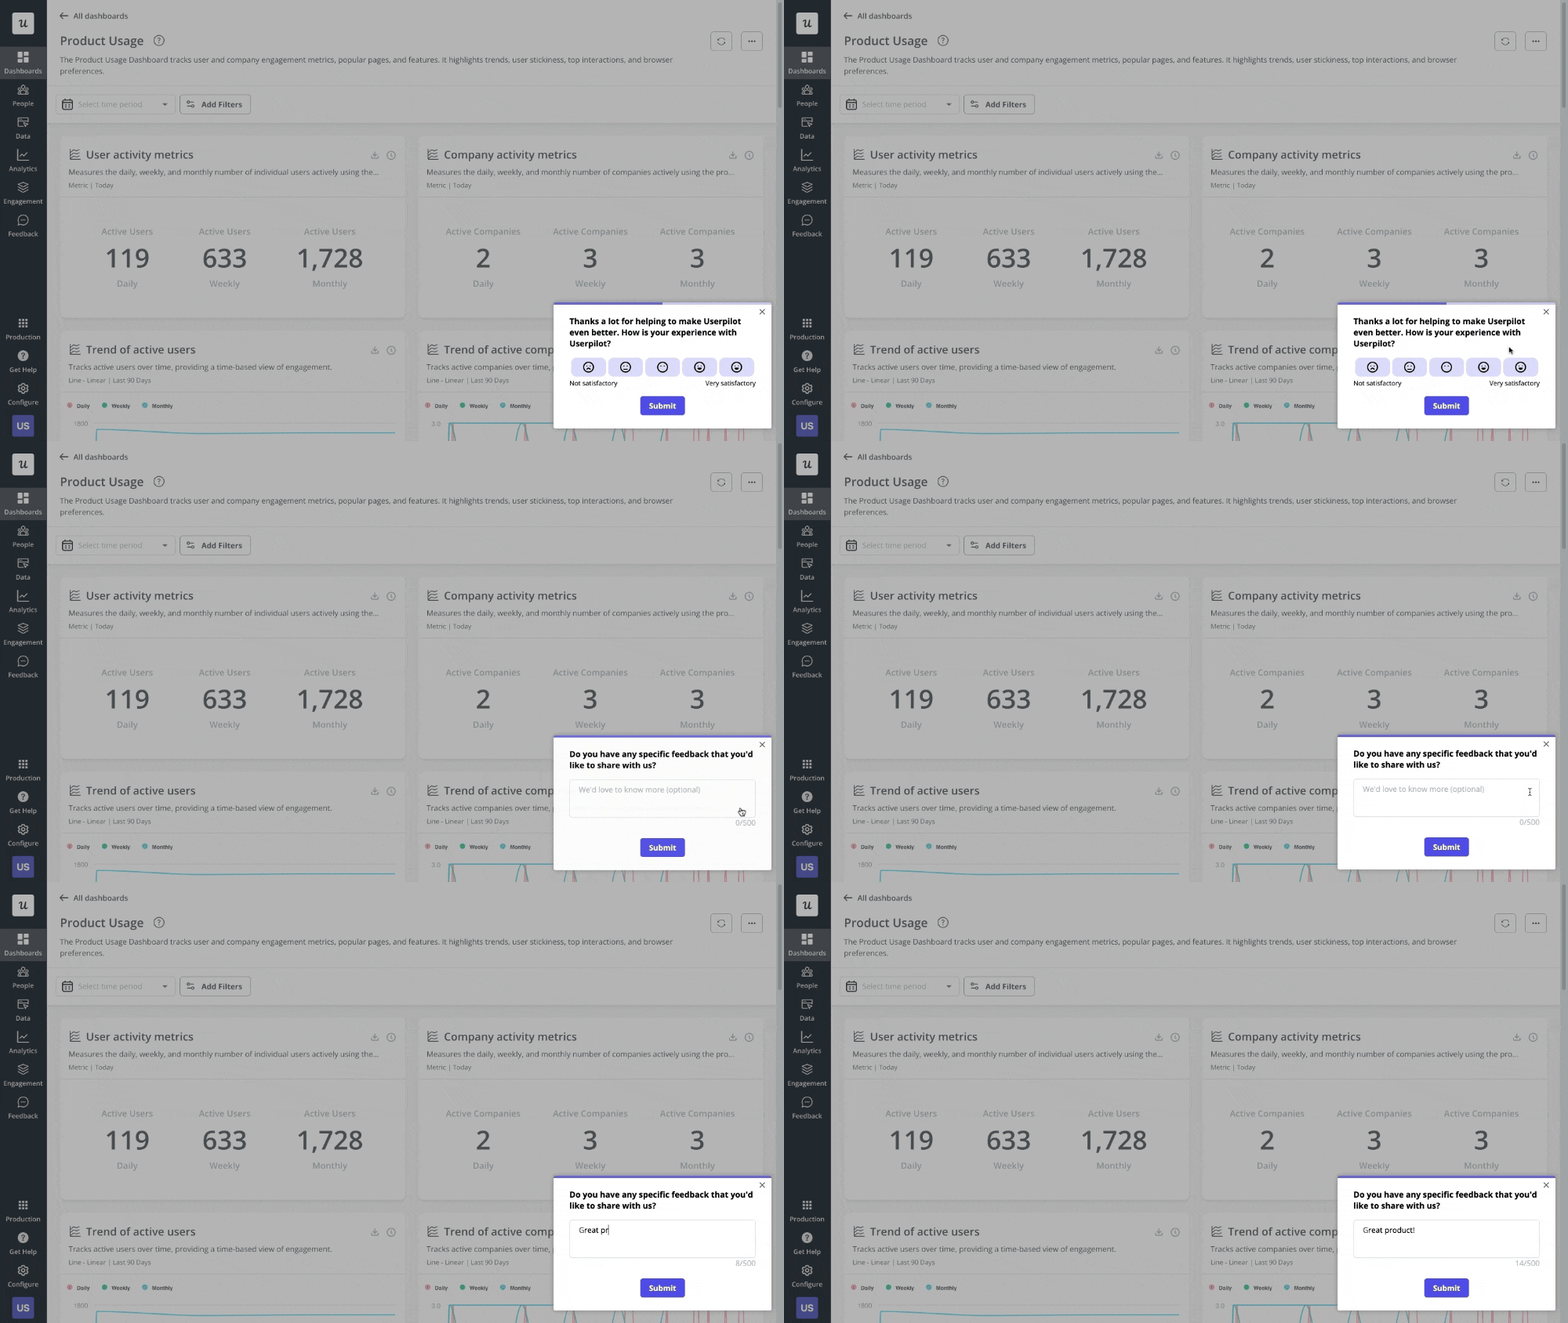
In-app surveys are easy to create, and you can trigger them for specific user segments at a specific time. For example, you could trigger them contextually when the user engages with a feature.
Surveys could offer valuable insights both directly and indirectly. In addition to the actual user responses, the response rate could be a good indication of user engagement and loyalty.
A word of warning, though. Asking users about their product or feature usage isn’t always reliable, so it’s best to use this method in conjunction with quantitative methods like feature or event tracking.
Use session recordings to examine product usage
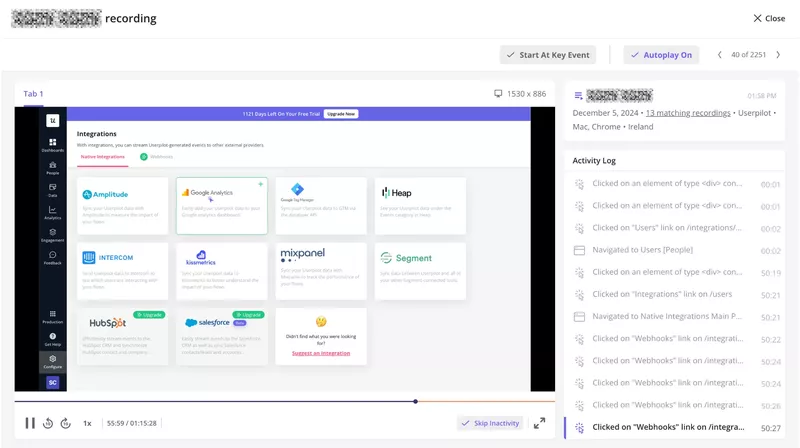
Session recordings are a goldmine of product usage data. Think of them as “user experience surveillance” (but in a good way, of course!). Instead of just seeing numbers and charts, you get to watch real users interacting with your product. This lets you uncover a whole layer of insights that traditional analytics just can’t capture.
See where users get stuck, what features they ignore, and how they actually navigate through your product. Are they struggling to find that key button? Are they misinterpreting your onboarding prompts? Session recordings give you the answers.
For example, you want to boost activation rates? You can segment new signups and watch how users behave during their first session and see where they drop off.
Important product usage metrics to track
What exactly is on your product usage analytics dashboard depends on your focus or goals. However, I don’t know of product teams that wouldn’t track the metrics below.
Number of active users
The number of active users is an engagement metric that is an indication of customer satisfaction. If your customers use the product regularly, it’s a sign it delivers value (and users know how to realize it).
Teams normally track:
- Monthly Active Users (MAU) – the number of unique users that engage with your product in a month.
- Weekly Active Users (WAU) – the number of unique users that interact with the app in a week.
- Daily Active Users (DAU) – the number of unique users that engage with the product at least once a day.
What DAU, WAU, or MAU good figures are, depends on your product and the user segment. For example, a freelancer is likely to use accounting software once a month, whereas an account will do it daily.
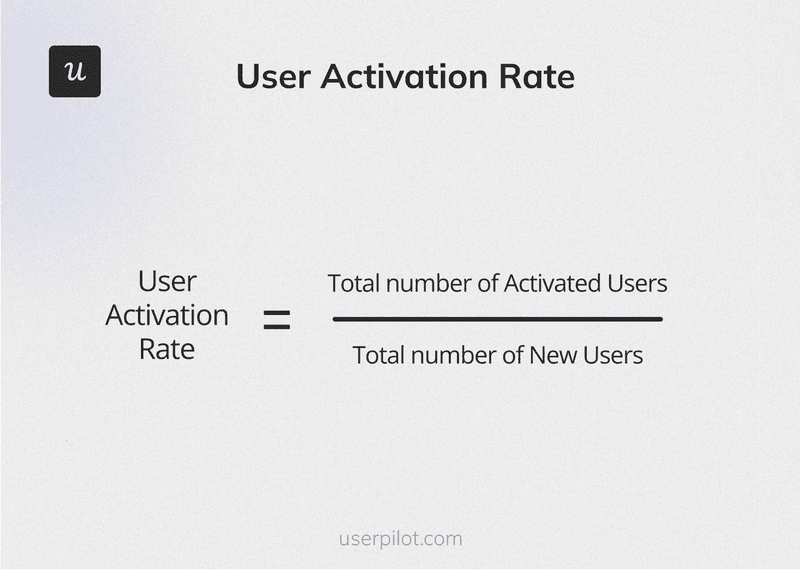
Activation rate
Activation rate is the percentage of the total number of users who signed up over a period who achieved the activation milestone.
The metric is important because it shows you how effective your user onboarding is.
If your users fail to reach the activation stage or it takes a lot of time, it’s an indication of friction that stops them from experiencing the product value. This will eventually lead to user churn.
Feature adoption rate
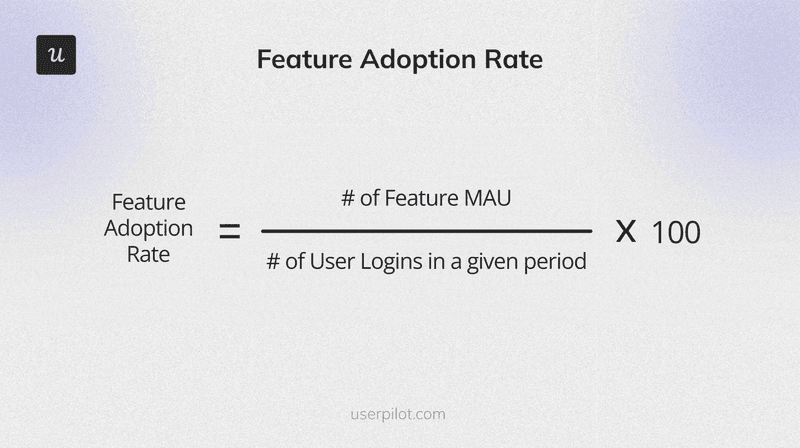
Feature (or product) adoption tells you how many users are likely to have incorporated the feature into their workflows and use it as a go-to solution to their problems.
We calculate the feature adoption rate by dividing the number of the feature’s monthly users by the total number of logins over a period of time and multiplying it by 100.
Tracking the metric can help you identify how valuable users find the feature so that you can make informed decisions about their future development. It can also help you identify ways to improve user onboarding.
Retention rate
The customer retention rate tells you how many customers keep using the product (and paying their fees). It helps teams assess how well the product satisfies user needs. If they are satisfied and see it as a good value for money, they have no reason to leave.
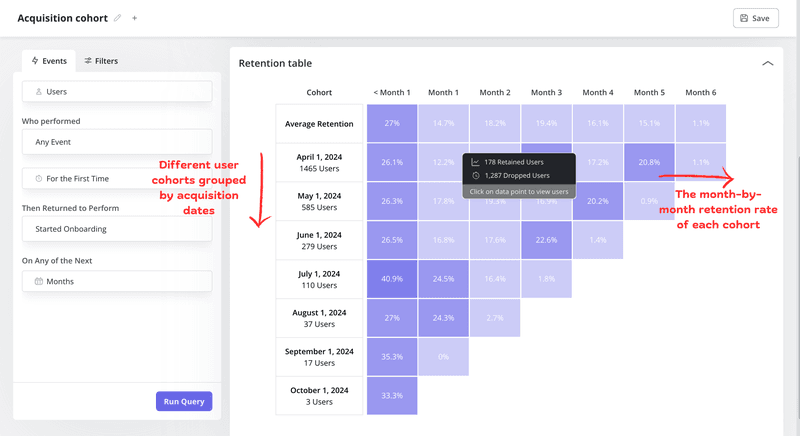
To calculate the retention rate, deduct the number of users acquired during the period from the number of users at the end of the period and divide it by the total number of users at the beginning of the period.
Or more actionable, use a retention table to monitor and compare retention rates across different cohorts and benchmark your efforts.
How to leverage product usage analytics to improve the customer experience?
Now that we know how to collect product usage data and the metrics to track, let’s look at a few specific ways you can use it to make your product better.
Identify friction points in the customer journey
Product usage analysis can help you create frictionless user experiences.
While a little bit of friction might be desirable, for example, to qualify some leads, unnecessary friction slows down users on their way to activation and adoption.
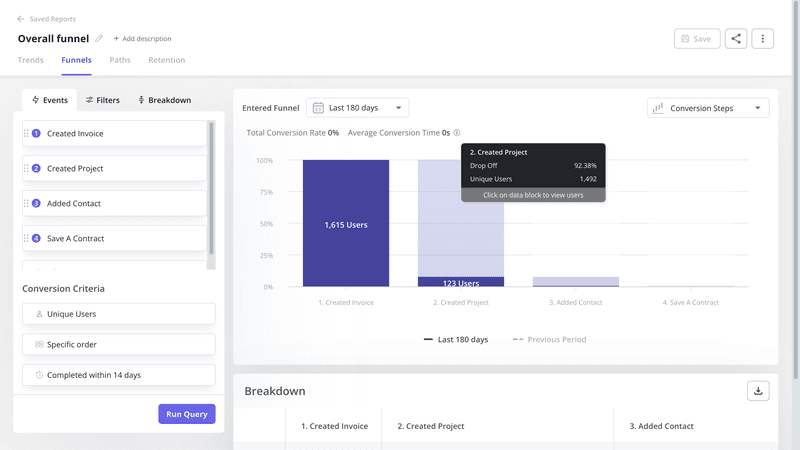
The product analytics tool that you need to discover friction is funnel analysis.
The funnel is a visualization of user progress from one stage of the journey to another. As users drop out, the funnel chart bars representing subsequent stages get narrower. If there’s a big drop in conversions from one stage to another, you will see it immediately. That’s your friction point.
To identify the root cause of friction, look closer at product usage at the difficult stage. Carry out Paths/Journeys analysis and study user session recordings for granular insights.
Create detailed user segments to personalize experiences
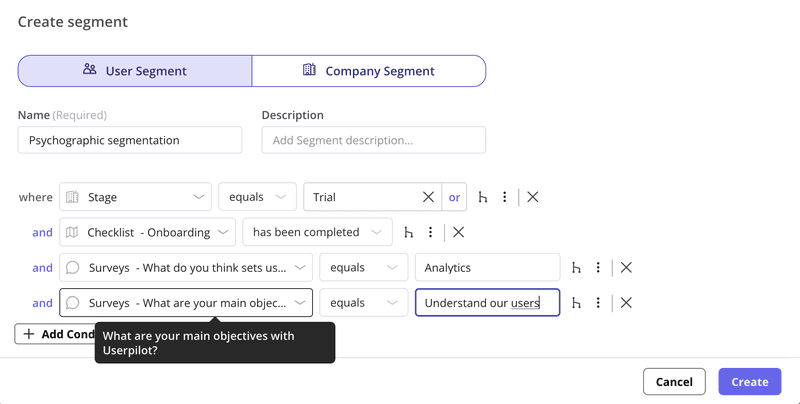
Thanks to product usage analytics, teams are able to create accurate user segments based on their in-app behavior. For example, you could create segments based on whether users have engaged with a specific feature or reached a milestone.
Segmenting your user base allows you to tailor their experiences to their unique needs and the stage in the customer journey they’re at.
For instance, you could customize the onboarding experiences for new users to help them discover only the key features that are relevant to their use cases. For more advanced users, on the other hand, you’d focus on improving the discovery of more complex functionality.
In this way, you increase the chances of them adopting the product and converting to paid customers. Personalization also helps you build stronger customer relationships and increase their loyalty.
Optimize the onboarding process for new users
Analyzing the product usage of existing users allows teams to optimize the onboarding experiences for new customers.
How so?
Tracking the product interactions of the most successful users, for example, those who require the least time to adopt the product enables you to identify the most effective behaviors and paths.
You can then tweak the in-app onboarding flows to guide users with similar use cases along the most optimal paths and increase their activation and adoption rates.

Identify and target users receptive to upsell messages
With product usage analytics, you can also single out the users who are ready to upgrade to the paid or higher plans.
You could do it by analyzing the actions of users leading up to their conversions. Next, you could bundle them up into custom events, and track which users complete them.
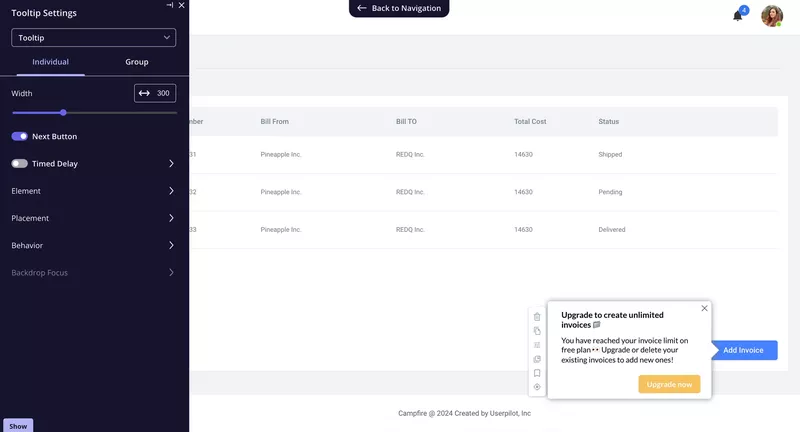
If your engagement or adoption tool offers event-based triggering, you could automatically target such users with contextual upsell messages to drive account expansion.
Conclusion
Product usage analytics are an indispensable tool for product teams aspiring to build products that deliver on their value proposition and delight customers.
If you want to see how Userpilot can help your team extract actionable product usage insights and act on them, book the demo!
Product usage analytics FAQs
What is product usage?
Product usage refers to how customers interact with your product. It’s about understanding what they do within your application, which features they use, how often they use them, and how they navigate through different functionalities. Essentially, it’s about observing and analyzing user behavior within your product.
How to calculate the usage of a product?
Calculating product usage involves tracking various metrics that provide insights into user behavior. Here are a few examples:
- Daily Active Users (DAU) / Monthly Active Users (MAU): This measures how many unique users interact with your product daily or monthly.
- Stickiness: Calculated as DAU/MAU, this shows how frequently users return to your product.
- Session Duration: This measures the average length of time users spend using your product during a single session.
- Feature Adoption: This tracks the percentage of users who adopt and actively use specific features.
- User Retention: This measures how many users continue to use your product over a given period.
What is product data analytics?
Product data analytics is the process of collecting, analyzing, and interpreting data on how users interact with your product. It goes beyond simply tracking usage metrics. It involves:
- Identifying patterns and trends: Uncovering insights into user behavior, such as common user journeys, pain points, and areas of engagement.
- Understanding user needs: Discovering what users are trying to achieve with your product and identifying unmet needs or areas for improvement.
- Making data-driven decisions: Using insights to inform product development, feature prioritization, and marketing strategies.


