A Guide to Customer Journey Analytics: How to Analyze & Improve Customer Journeys
Customer journey analytics help product, marketing, and customer success teams improve the customer experience so that users can achieve their goals and the companies – their business objectives.
In the article, we explain:
- What a customer journey and customer journey analytics are.
- How customer journey analytics differ from customer journey mapping.
- The benefits of customer journey analytics.
- How to conduct the analysis.
We also examine a few product analytics tools to help you analyze your customer journeys.
Let’s get right to it!
Try Userpilot Now
See Why 1,000+ Teams Choose Userpilot

What is a customer journey?
In SaaS, the customer journey is a sequence of stages that the customer goes through, from the moment they find out about the product until they become paying customers, and beyond.
And beyond?
Yeap! For a SaaS business to thrive, it needs to be able to retain customers and leverage them for new customer acquisition, for example, via referrals and word-of-mouth recommendations.

Is your customer journey analytics strategy complete?
Mapping the journey is just the start. Take this quick 4-step assessment to see if you’re truly unlocking the power of customer journey analytics.
What is customer journey analytics?
Customer journey analytics is the process of collecting, analyzing, and interpreting data on the customer interaction with the product throughout its lifecycle.
Its primary goal is to gain an understanding of customer behavior inside the product and identify opportunities to improve the customer experience to advance product and business goals.
Customer journey analytics vs customer journey mapping
Customer journey analytics and customer journey mapping are 2 interconnected but different processes.
In a nutshell, customer journey mapping is the process of outlining all the steps in the customer journey along with user actions, feelings, challenges, and so on.
As such, it’s an essential part of customer journey analytics. It’s impossible to accurately analyze progress along the user journey if you don’t know what the journey looks like. It would be like trying to plan your overseas holidays without a map of the places worth visiting.
The benefits of customer journey analytics
Customer journey analytics are essential for customer and product success.
First of all, it allows you to better understand how customers use the product and what they value most about it. Such insights can help you prioritize your product initiatives to make your product more useful.
It doesn’t stop there.
Customer journey analytics enables organizations to improve the customer experience by identifying and addressing user pain points and friction in the customer journey that stops them from realizing the product value.
Streamlined user experience and personalized interactions translate into higher customer satisfaction, retention, and loyalty.
Higher retention means also higher customer lifetime value, but that’s not the only way customer journey analytics can help you improve your revenue stream.
Marketers can use customer journey data to optimize marketing campaigns and identify the best customer acquisition channels, which reduces CAC. Further down the funnel, savings can be made by reducing the load on the customer support teams.
And don’t forget about the extra income from cross- and upsell opportunities that customer journey analytics can help you identify.
How to do a customer journey analysis?
Customer journey analysis is a journey itself. Let’s look at the key steps it involves.
Adopt the right analytics tools
In the context of digital products, all customer interactions with the product and the brand happen in the digital space. So to be able to track and analyze them, you need the right tool stack.
What tools exactly do you need?
The main ones include:
- Product analytics platform – to track user behavior inside the product.
- Web analytics tool – to keep a pulse on web traffic and website engagement.
- Session recording tools – for detailed analysis of user interactions.
- Social media monitoring tools – to listen to what your existing and prospective customers have to say about your brand.
- Survey tools – to collect customer feedback via multiple channels.
- Journey mapping tools.
On top of that, you need a CRM or CDP platform to integrate the data in one place.
Map your entire customer journey
Once you have all the toys, I mean tools, in place, let’s start by mapping out the entire customer journey. As mentioned above, you need to know exactly what you’re analyzing.
What information does the map include?
- The main stages of the journey – like awareness, consideration, interest, sign-up, onboarding & activation, adoption and use, retention, advocacy & expansion.
- The touchpoints where user interactions happen – e.g. the paid ads, the landing page, the sign-up form, etc.
- User actions at all the touchpoints along with their feelings and challenges.
To help you structure customer journey mapping, tools like Miro or Canva have ready-to-use templates. Use them as you will have a few of these to create – one for each user persona!

Collect customer data
Next, it’s time to collect the data for the journey analysis.
This includes quantitative data, gathered via web and product analytics tools. For example, you’re most likely to track user behavior on your website as well as product usage data inside the product.
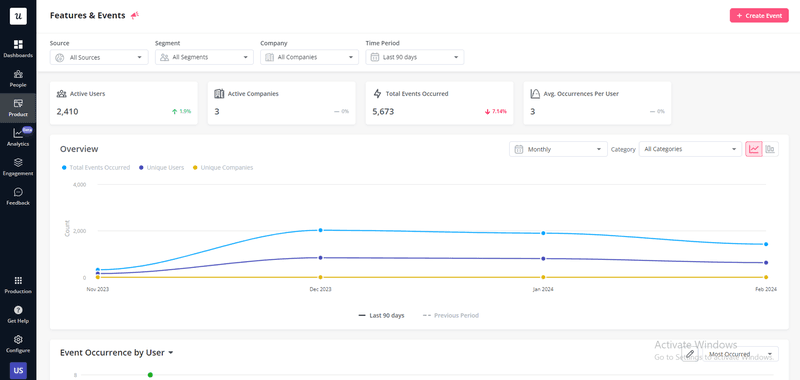
When it comes to qualitative data, it’s mostly user feedback. This can come from different sources:
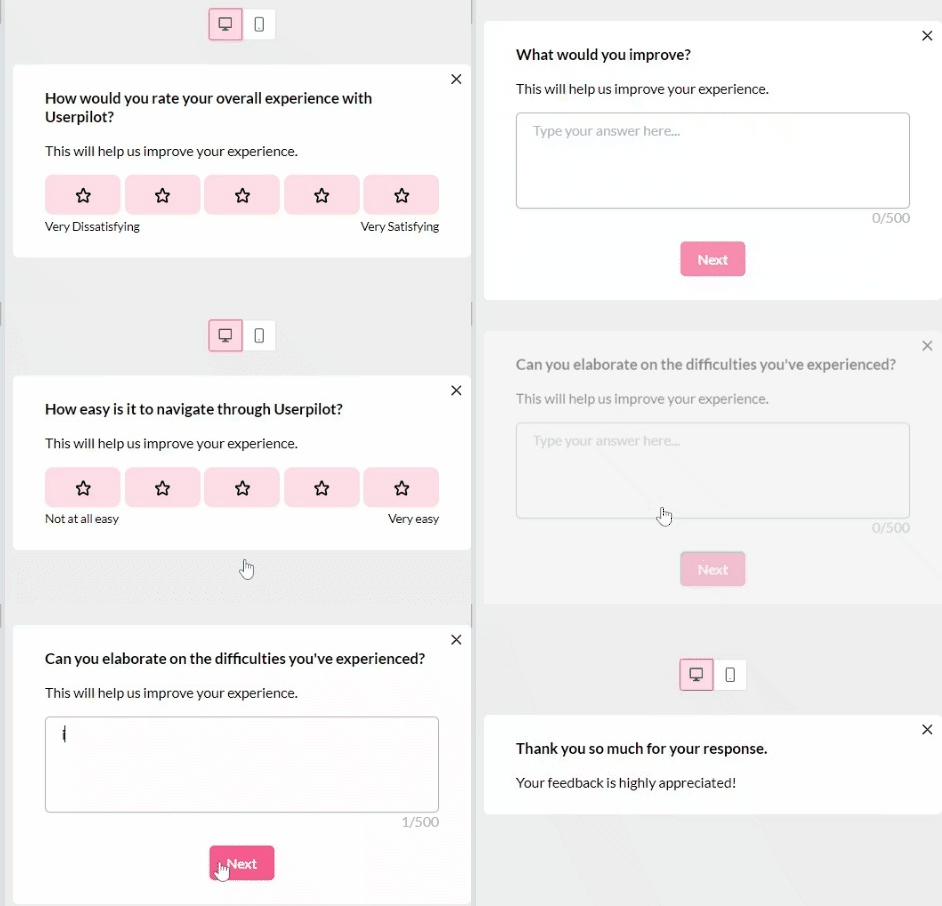
- In-app surveys.
- Email surveys.
- Usability testing sessions.
- Interviews and focus groups.
- Interactions with the customer-facing teams.
- Social media & forum posts.
- Reviews.
Analyze data
As the data starts flowing in, you can start analyzing it. You can do it from multiple angles.
Analyze drop-offs in the customer journey with funnel analysis
Customer journey analysis often starts at a high level with funnel analysis. This allows teams to identify the general areas where users experience friction.
How does it work?
In the funnel chart, each stage of the journey is represented by one bar. As the users gradually drop off, the bars get narrower. This is normal unless you can see that lots of users drop during a particular stage.
If that’s the case, it may be an indication that they’re facing roadblocks that stop them from progressing. That’s where you need to conduct a more granular investigation to find the root cause of the friction.

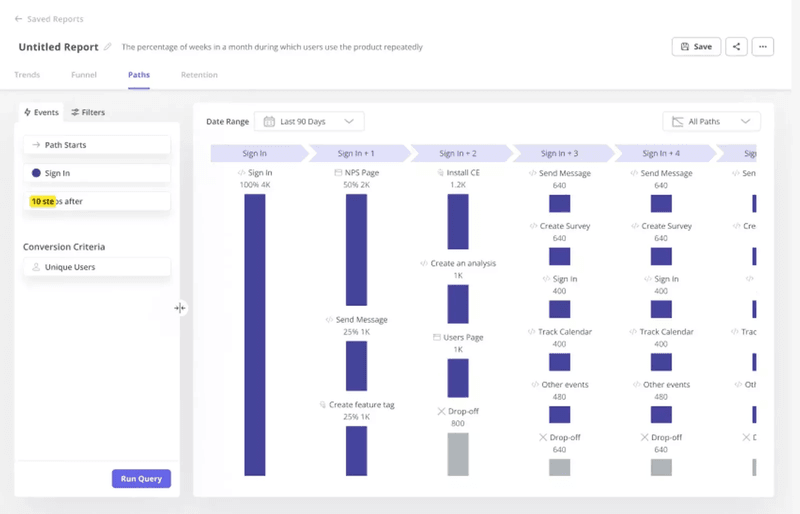
Analyse the main customer journey map with paths
One of the more granular analysis methods is path analysis.
In short, this allows you to map out all user actions inside the product at each stage of the journey.
There are 2 main applications of this kind of analysis. You can use it to:
- Analyze the paths of the users that drop off to find out why they go astray.
- Analyze the paths of the power users to find the happy paths that others could replicate.
Analyze customer experience with surveys
When it comes to qualitative feedback, the analysis is a bit more time-consuming. That’s because it may be difficult to extract actionable insights from the captured data.
Fortunately, more and more products offer tools for automating qualitative data analysis.
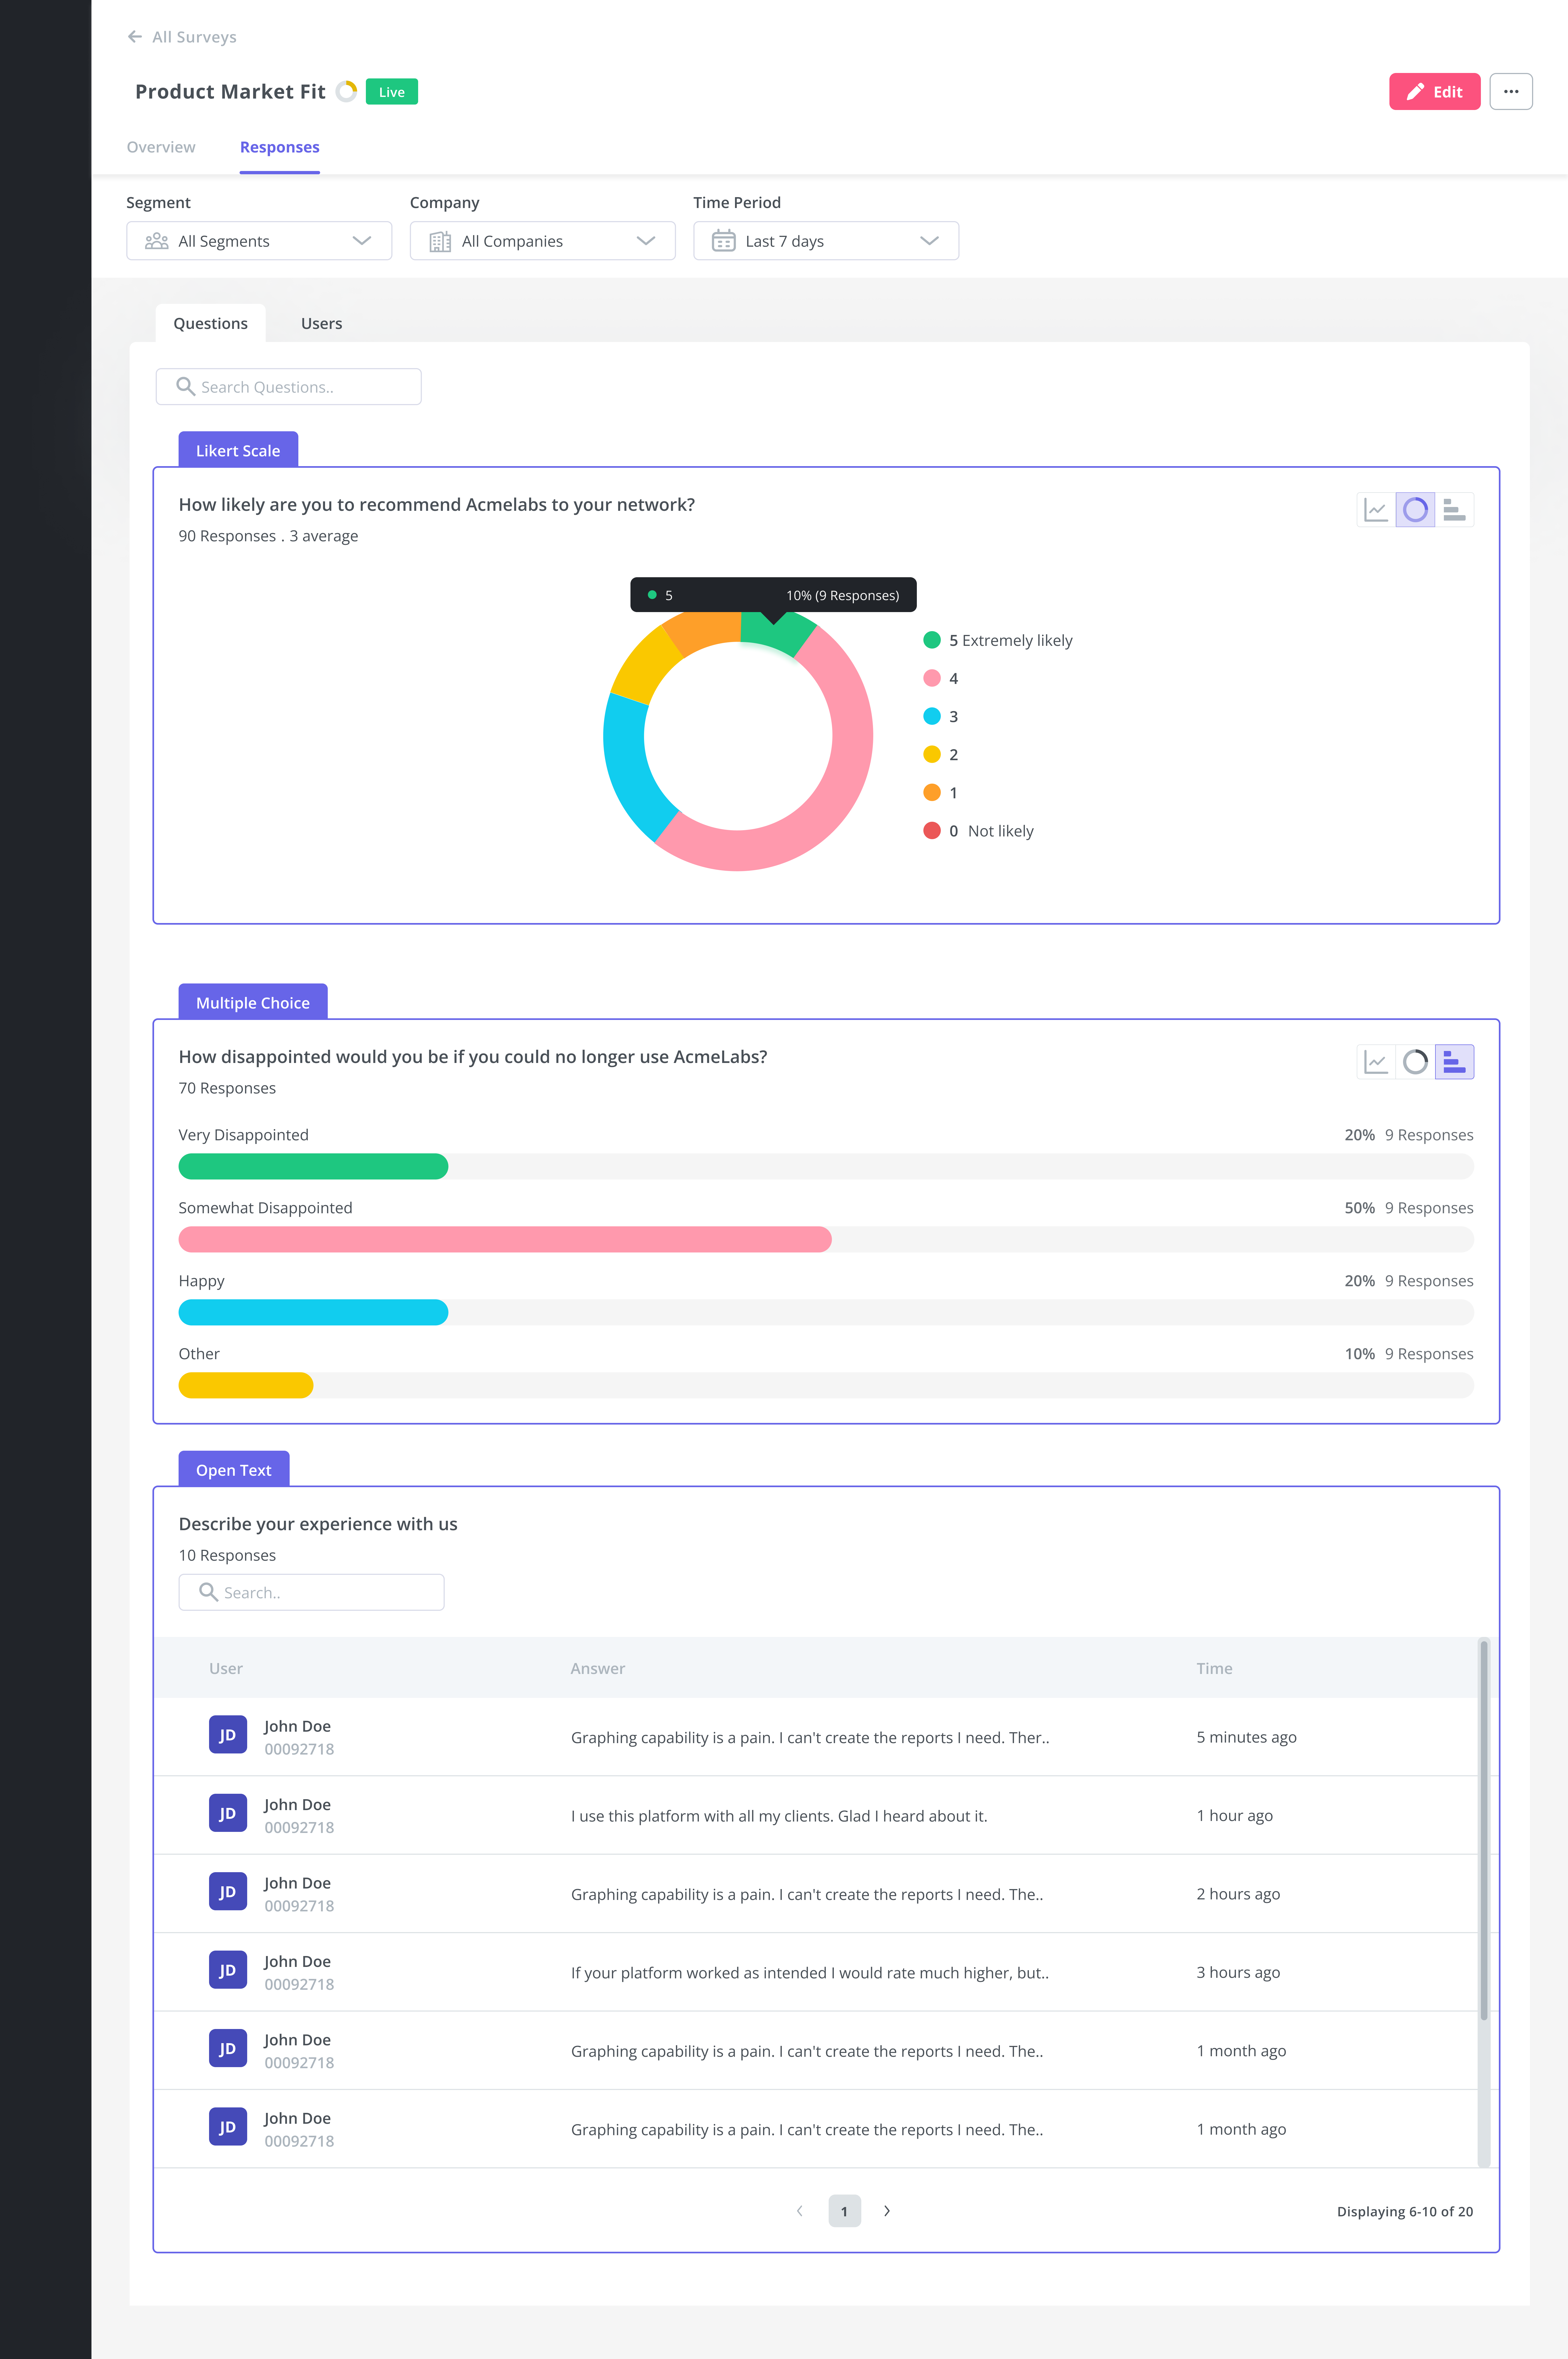
For example, with Userpilot, you can tag the qualitative NPS responses to spot trends in user sentiment more easily, and we’re working on more advanced survey analytics that will allow you to cut through the noise and get the insights you need to make informed decisions.
Make improvements to the customer journey
Using customer journey analytics only makes sense when you act on the insights. So having analyzed all the data, it’s time to implement necessary changes to the customer journey.
What these changes look like depends a lot on the issues you’ve encountered.
For example:
- If you’re struggling to attract new customers, you may make changes to your content marketing strategy or invest in SEO.
- To convince prospects it’s worth giving you a shot, you can showcase case studies and testimonials from successful customers.
- Users aren’t signing up for the free trial? Optimize the landing page UI and if they’re dropping off during the sign-up, you may need to simplify the process.
- If there’s an issue with activation or adoption, interactive walkthroughs, and onboarding checklists could be a solution.
- To boost account expansion, contextual in-app messages, like tooltips, can nudge users in the right direction.
You get the drift.
Test different flows
How do you know that the changes will improve customer experience and drive the desired behaviors?
You don’t until you try them out with real users. Doing this with a whole user population, however, can be risky, so it’s a good idea to run some experiments and validate your ideas before the total rollout.
A/B testing is one possible way to do it.
Let’s imagine you’re onboarding flow needs improving because it fails to activate enough users. You tweak your onboarding checklist and release it to half of the users from a previously selected sample. For the other half, you trigger the old version and compare their performance.
In Userpilot, you can also compare 2 new versions head-to-head or manipulate a range of variables in the multivariate tests.

Customer journey analytics solution for leveraging customer journey analytics
As mentioned before, analyzing a customer’s journey is much easier with the right tools. Let’s look at 3 different ones that will cover most use cases.
Userpilot
Userpilot is a product adoption platform that offers advanced analytics features as well as feedback collection and user engagement tools.
This means you can use it to collect and analyze both qualitative and quantitative data and act on the findings to improve the user experience and drive conversions.

Its analytics capabilities include:
- Customer segmentation.
- (Custom) event tracking.
- Funnel and path analysis.
- Retention and trend analysis.
When it comes to feedback, you get:
- In-app survey template library.
- Visual editor for easy customization.
- NPS dashboard.
- AI-powered automatic localization.
The engagement functionality includes:
- UI patterns and flows (tooltips, modals, slideouts, driven actions, banners, and hotspots).
- Interactive walkthroughs and onboarding checklists.
- Resource center for self-service support.
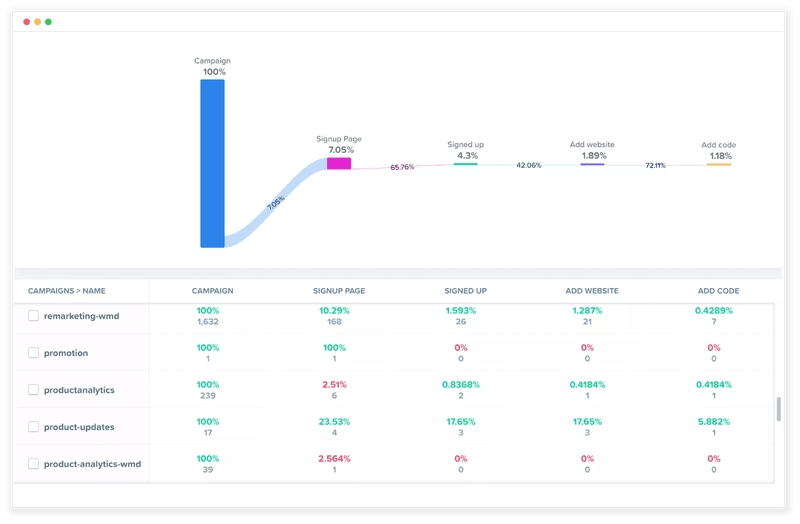
Woopra
Woopra is a real-time customer analytics service used by businesses to track and analyze the way users interact with their websites, applications, products, and services across multiple devices and customer touchpoints.
Its functionality enables teams to map and analyze customer journeys, helping them to identify critical paths, drop-off points, and opportunities for optimization to improve the customer experience.
Google Analytics
Google Analytics is a well-known free analytics platform. While its latest edition, GA4, supports in-app event tracking, many teams still use it for web traffic analysis.
With GA, you can analyze:
- How users find your website (organic, paid, referral).
- Which pages do they visit and in what order?
- What actions they perform on each page.

Conclusion
Customer journey analytics play an important role in creating frictionless customer experiences, increasing customer satisfaction, and driving business outcomes.
If you want to find out more about Userpilot and its customer journey analytics capabilities, book the demo!

