14 Product KPIs & Metrics to Track (Formulas, Averages & Tips)


What are product key performance indicators (KPIs)?
Product Key Performance Indicators (KPIs) are specific, measurable values that help you understand how well your product is performing.
These indicators give you insights into various aspects of your product, from user satisfaction to financial performance. Based on them, you can make informed decisions to improve your product and achieve your business goals.
14 Product management KPIs & metrics for product managers to track
In this section, you’ll discover 14 essential KPIs and metrics that all product managers should monitor.
1. User activation rate
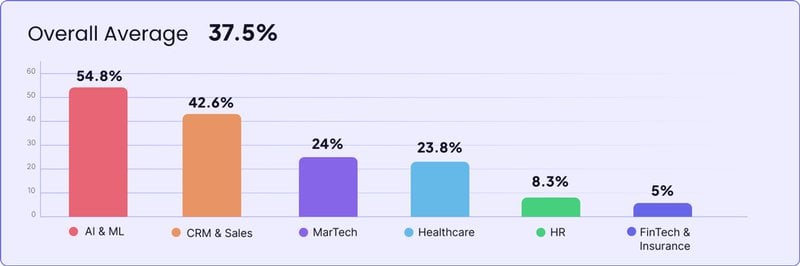
User activation rate measures the percentage of users who take a key action that signifies gaining value from your product. This activation metric indicates how effectively you turn signups into active users.
To calculate it, divide the number of activated users by the number of new users. Then, multiply the result by 100 to get a percentage.
According to our product metrics report, which analyzed 547 companies, the average user activation rate is 37.5%.
Here are some tips to help you improve user activation:
- Simplify your signup process. A complicated signup process can deter potential users. By making it straightforward and quick, you can reduce barriers to entry and increase activation rates.
- Collect customer data to personalize their experience. Personalization makes users feel valued and catered to, increasing their likelihood of engaging with your product.
- Use interactive walkthroughs. These can guide users through your product’s key features and benefits, ensuring they understand how to use it effectively.
- Guide users to activation events with onboarding flows. Well-designed onboarding flows can lead users to essential actions. For example, The Room increased new user activation by 75% by optimizing its onboarding process.
- A/B test different onboarding flows. Experimenting with various onboarding strategies can help you identify the most effective approach for activating users.
2. Time to Value
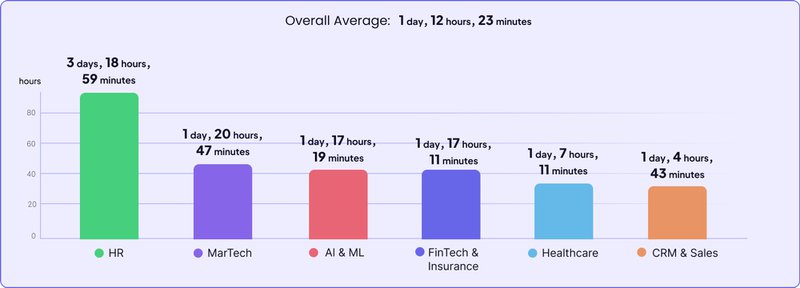
Time to Value (TTV) measures how quickly a new user gains value from your product. It’s an essential product management metric because a shorter TTV can lead to higher user satisfaction and retention.
The average TTV across various industries is one day, 12 hours, and 23 minutes.
Here’s how to reduce TTV:
- Streamline the onboarding process. Reduce the number of steps a user needs to get started and provide pre-built templates to minimize manual entry.
- Offer personalized guidance and support. Tailor in-app guidance and support based on user behavior and survey results to address specific needs.
- Highlight the key features. You can use hotspots, banners, and tooltips to draw users’ attention to key features.
3. Onboarding checklist completion
Onboarding checklist completion measures the percentage of new users who finish all the tasks on your onboarding checklist. This metric indicates how effectively new users are being guided through the initial stages of using your product.
To calculate it, divide the number of users who completed the checklist by the number of users who started it and multiply the result by 100.
According to our report, the average onboarding checklist completion rate is 19.2%.
Here are some tips for user onboarding checklists:
- Keep the checklist short and focused. A concise checklist helps users complete the onboarding process without feeling overwhelmed. Focus on the most critical tasks that will provide immediate value.
- Ensure the checklist is visually appealing. A well-designed and visually engaging checklist can make the onboarding process more enjoyable and encourage users to complete it.
- Customize the checklist based on customer segmentation. Tailoring the checklist to different user segments ensures the tasks are relevant and beneficial to each group.
4. The core feature adoption rate
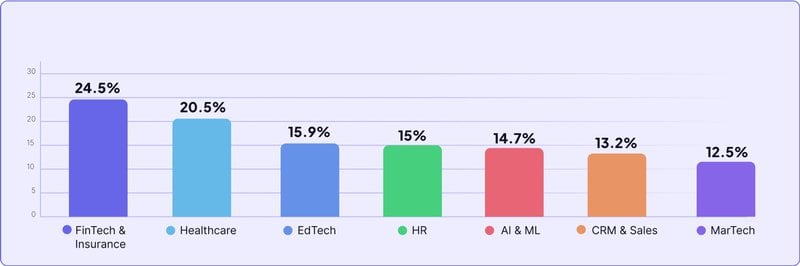
The core feature adoption rate is the percentage of users actively using key product features. This feature adoption metric is crucial because it indicates how well users integrate key functionalities into their regular usage.
To calculate the core feature adoption rate, divide the number of feature monthly active users by the number of user logins in a given period and multiply the result by 100.
The average core feature adoption rate is 24.5%.
Here is how you can increase user adoption:
- Include interactive in-app guides. Interactive guides can help users understand and use core features more effectively. These guides provide step-by-step instructions and highlight important functionalities.
- Collect user feedback to understand friction points. Gathering user feedback can help you identify where they encounter difficulties. This insight allows you to make necessary adjustments to improve the user experience.
- Iterate on core features based on user behavior. By continuously analyzing how users interact with core features, you can make data-driven improvements that enhance usability and encourage higher adoption rates.
5. 1-month retention rate
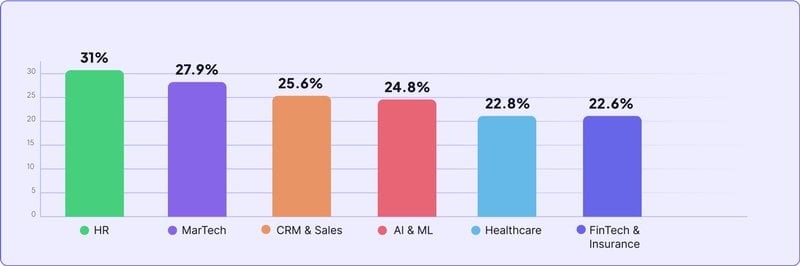
The 1-month retention rate measures the percentage of users who continue to use your product one month after their initial user engagement.
This retention KPI is important because it reflects the product’s ability to keep users engaged and satisfied over time.
To calculate the 1-month retention rate, divide the number of users who return to your product after one month by the number of users who signed up a month ago and multiply the result by 100.
The average 1-month retention rate is 46.9%.

Here is how you can improve retention rates:
- Deliver a fantastic onboarding experience. A great onboarding experience sets the tone for the user’s journey with your product. Ensuring that users understand and can quickly gain value from your product is key to retaining them.
- Provide proactive support and guidance. Offering timely and helpful guidance can prevent users from becoming frustrated and leaving.
- Offer incentives and rewards for continued use. Incentives, such as discounts, exclusive features, or rewards, can motivate users to keep using your product and stay engaged over time.
6. Net Promoter Score (NPS)
NPS measures the likelihood that users will recommend your product to others through an NPS survey.
You can calculate NPS by subtracting the percentage of detractors (those who rate you 0-6) from the percentage of promoters (those who rate you 9-10).
This metric is important because it clearly indicates user satisfaction and customer loyalty.
The average NPS is 35.7.
Here are some best practices:
- Segment NPS responses. By segmenting NPS responses based on user demographics or behaviors, you can gain deeper insights into which groups are more satisfied and which need more attention.
- Analyze qualitative feedback to understand the reasons behind scores. Reviewing the comments and feedback accompanying NPS scores helps you understand the reasons behind users’ ratings.
- Act on the feedback. Taking concrete actions based on user feedback shows customers that their opinions are valued and can lead to product improvements that enhance their overall experience.
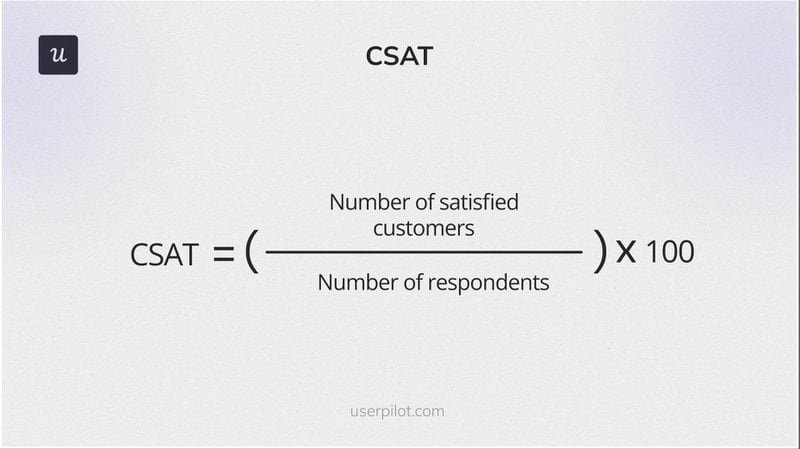
7. Customer satisfaction score (CSAT)
CSAT measures customers’ satisfaction with your product or service.
Here are some tips for conducting CSAT surveys:
- Couple scores with qualitative responses. Collecting qualitative feedback alongside scores can help you understand the reasons behind customer ratings and identify specific pain points.
- Identify patterns and act on them. Analyzing the feedback to spot trends or recurring issues allows you to make informed decisions and effectively address customer concerns.
- Create good survey questions. Use multiple question types such as open and close-ended and wording that doesn’t hint at a specific answer.
- Use a CSAT survey template. Using a well-designed template ensures you ask the right questions and gather relevant information.
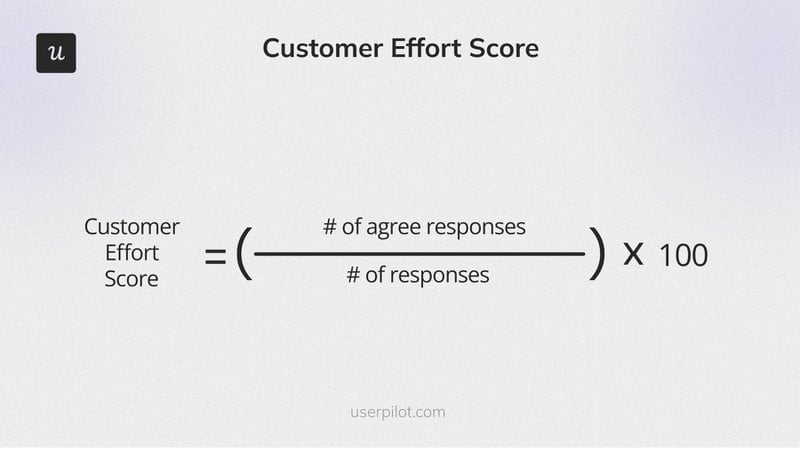
8. Customer effort score (CES)
Customer Effort Score (CES) measures how easy it is for users to engage with your product. This metric is important because it highlights friction points in the user experience, which can directly impact customer loyalty and satisfaction.
Here’s how product managers can improve this metric:
- Ensure your app is easy to navigate. A clear layout and intuitive design make it easier for users to find what they need, reducing effort and frustration.
- Reduce the number of steps required to complete key actions. Streamlining processes so users can achieve their goals with fewer steps can significantly lower effort scores.
- Provide self-service options and proactive assistance. Offering resources like FAQs, resource centers, and chatbots allows users to solve problems independently. On the other hand, proactive assistance ensures they receive help before encountering issues.
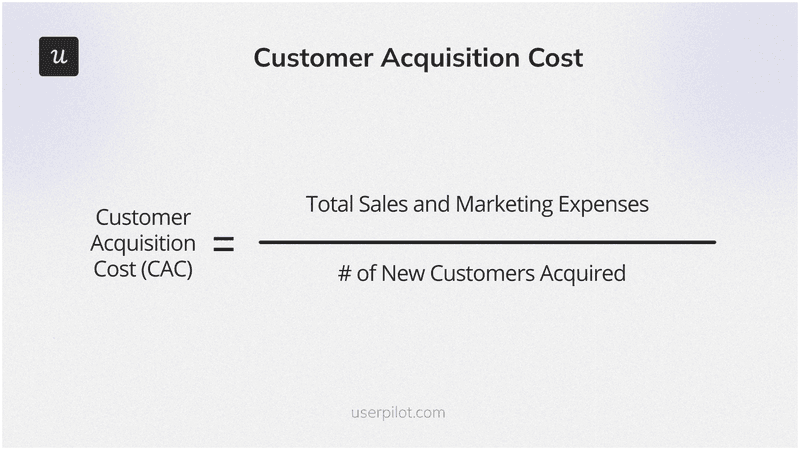
9. Customer acquisition cost (CAC)
Customer Acquisition Cost (CAC) measures the total cost of acquiring a new customer, including marketing, sales, and other related costs. As a result, it helps businesses understand the efficiency of their customer acquisition strategies.
Here’s how you can reduce CAC:
- Optimize marketing channels. By analyzing the performance of different marketing channels and identifying the most cost-effective ones, you can allocate your budget more efficiently and reduce CAC.
- Implement lead scoring. Lead scoring helps you focus on potential customers who are more likely to convert, thereby improving the efficiency of your sales efforts.
- Streamline sales processes. Simplifying and optimizing your sales processes can reduce the time and resources needed to close deals, ultimately lowering your overall CAC.
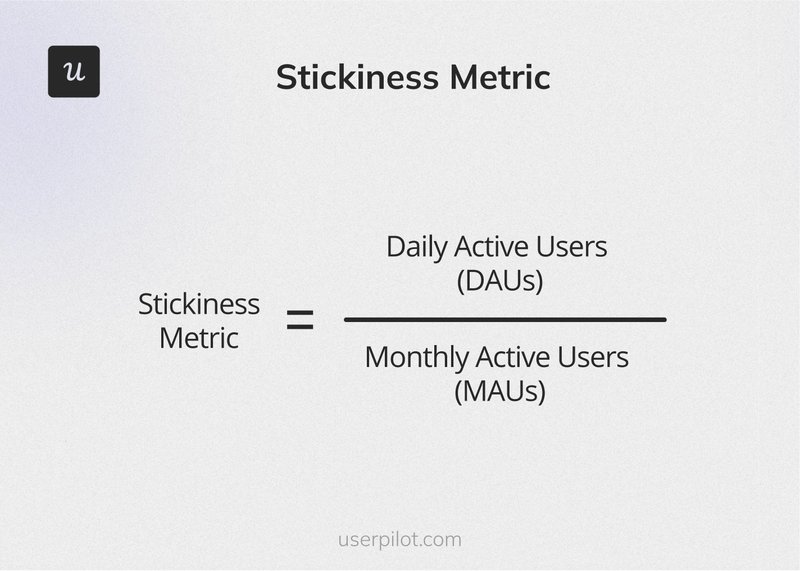
10. User stickiness
Stickiness measures how often users return to your product and is one of the indicators of customer satisfaction.
Here’s how to increase product stickiness:
- Create personalized onboarding flows. Tailoring the onboarding experience to individual users can help them see the value of your product more quickly, increasing their likelihood of returning.
- Encourage engagement through gamification. Incorporating game-like elements such as points, badges, and leaderboards can make using your product more enjoyable and motivating for users.
- Provide continuous value. Introducing new features and improvements that address user needs keeps your product relevant. Additionally, offering educational content such as webinars and articles can help users get more out of your product.
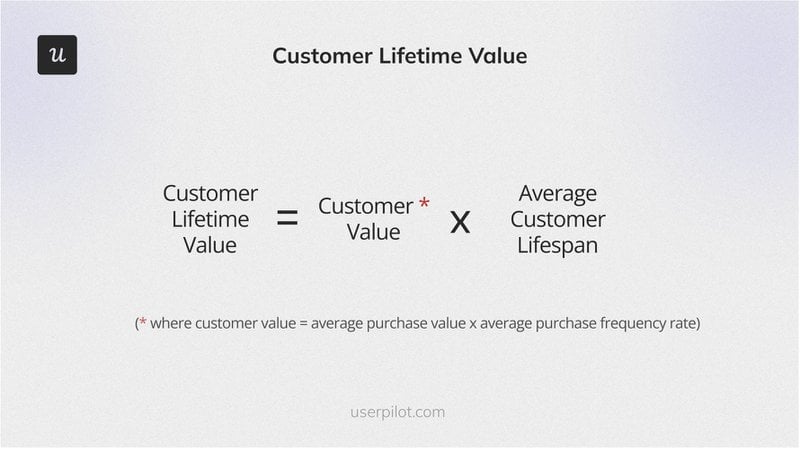
11. Customer lifetime value (LTV)
Customer Lifetime Value (LTV) measures the total revenue a business can expect from a single customer account throughout its lifetime. It helps businesses understand the long-term value of their customer relationships, guiding strategies for customer acquisition and retention.
Here are some tactics to increase LTV:
- Regularly improve product quality. Continuously enhancing your product ensures that it meets and exceeds customer expectations, encouraging long-term loyalty and repeat purchases.
- Implement effective upselling and cross-selling. Offering additional products or services that complement the original purchase can increase the average purchase value and frequency.
- Optimize pricing strategies. Setting competitive and attractive prices can enhance user retention and attract new customers, thus increasing the overall LTV.
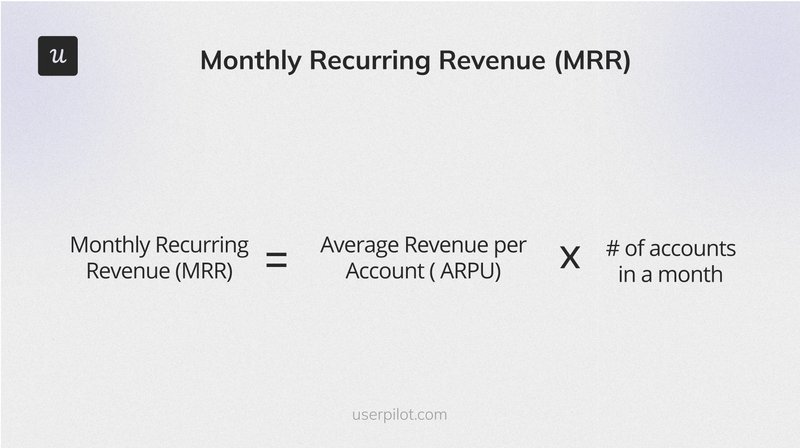
12. Monthly recurring revenue (MRR)
Monthly Recurring Revenue (MRR) is the total predictable revenue your business generates monthly from all active subscriptions.
It’s a critical metric for subscription-based businesses as it helps track consistent revenue streams and growth over time.
Here are some tips to improve this metric:
- Focus on customer retention. Keeping existing customers is often more cost-effective than acquiring new ones. Implementing strategies to improve customer satisfaction and reduce customer churn can significantly boost your MRR.
- Introduce add-ons and premium features. Offering additional products or services that complement the original subscription can increase the average revenue per user (ARPU).
- Streamline your sales process. Simplifying and optimizing your sales process can make it easier for potential customers to subscribe, increasing the number of active subscribers.
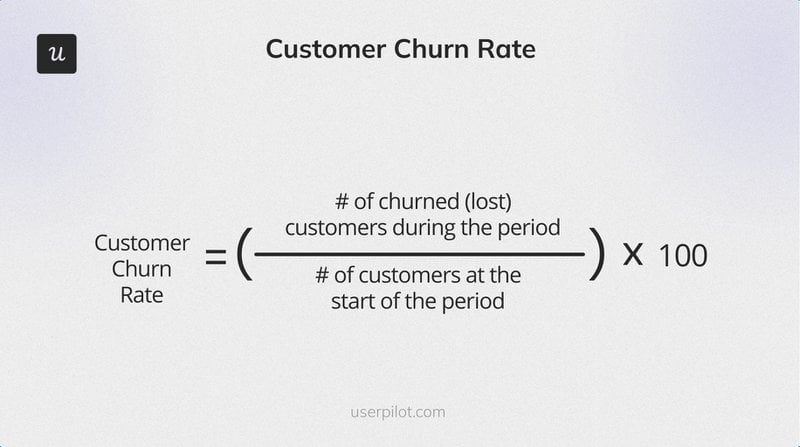
13. Customer churn rate
Customer churn rate measures the percentage of users who stop using your product or service during a specific period.
It’s an important product management metric because it helps you understand how well you retain customers, directly impacting your business’s growth and revenue.
Here are some tips for reducing churn:
- Delight customers from the start. A strong onboarding experience ensures that customers quickly understand and gain value from your product, which reduces the likelihood of them leaving.
- Understand and address customer pain points. Regularly gathering feedback and analyzing customer behavior helps you identify and resolve issues that may cause dissatisfaction.
- Implement customer success programs. Proactively supporting and engaging with customers to ensure they achieve their desired outcomes can significantly reduce churn.
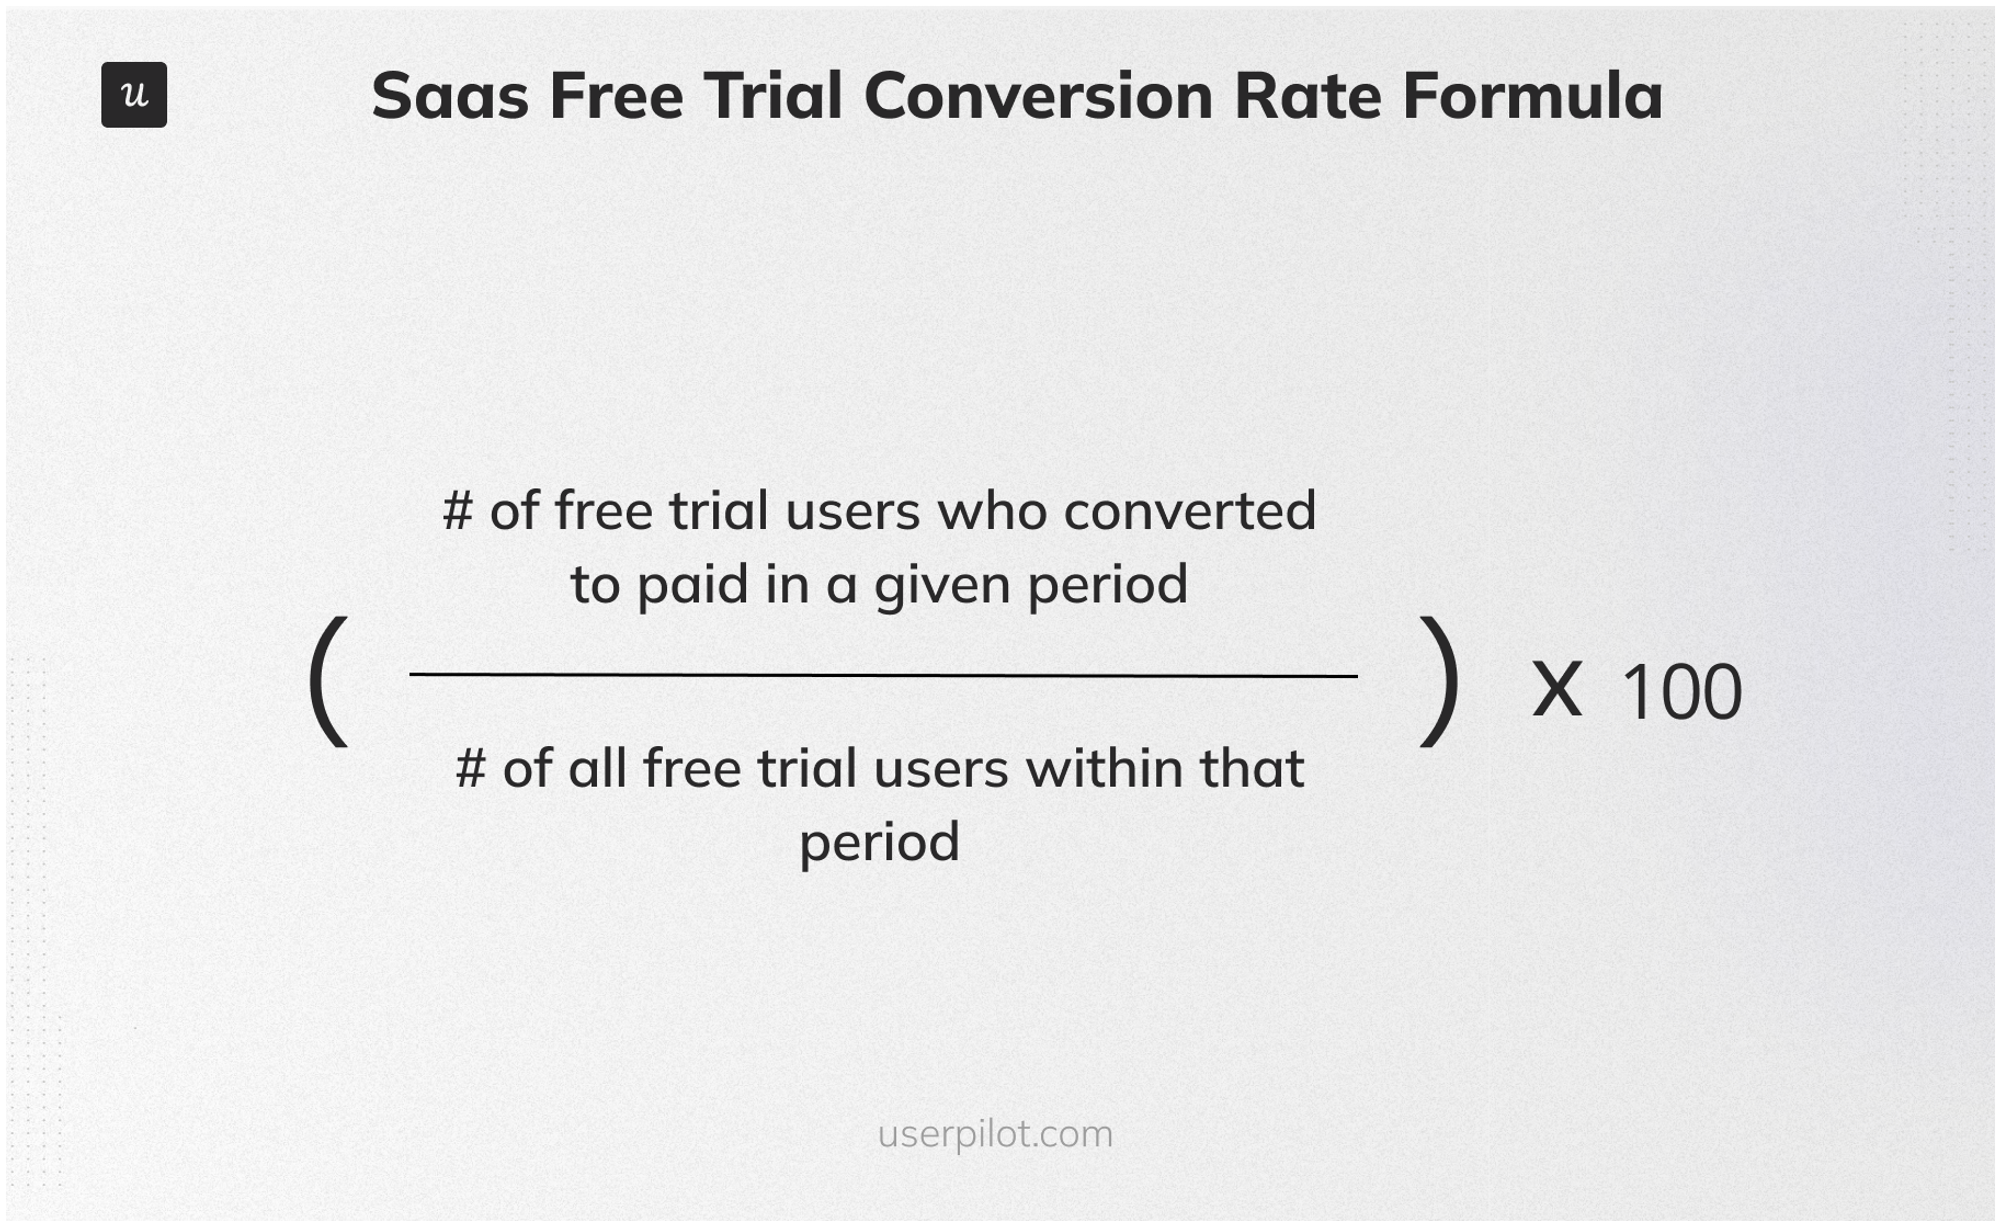
14. Free trial-to-paid conversion rate
The free trial-to-paid conversion rate measures the percentage of users transitioning from a free trial to paying customers.
It’s an important metric because it indicates how well your product and onboarding process convince users to commit financially, directly impacting your revenue and growth.
Here are some tips for optimizing your conversion rate:
- Optimize your onboarding process. A smooth and effective onboarding process ensures that users quickly understand how to use your product and see its benefits, which can lead to higher conversion rates.
- Showcase value early. Highlighting your product’s core benefits and unique features early in the trial period can help users recognize its value, making them more likely to convert.
- Offer personalized recommendations, tips, and support. Tailoring guidance and support based on user behavior and needs can enhance users’ experiences and encourage them to transition to a paid plan.
Conclusion
Product management is nothing without the metrics to guide you. If product managers are flying blind, then you’re asking for trouble. But tracking these product management KPIs is not enough—you must find ways to improve them.
With Userpilot, you can collect customer feedback, track user behavior, and act on the results. Book a demo now to find out how Userpilot can help you.
About the author