Engagement Data in 2026: The Bottleneck Moved from Collecting to Deciding


Collecting engagement data used to be a manual process for most product teams. Analysts would generate a large report, dig into a handful of segments, and spend the next two weeks preparing an improvement plan. Just getting your hands on the data was a challenge when instrumentation took weeks and dashboards lived behind engineering tickets, leading most reports to use stale metrics by the time they were finished.
While gathering engagement data is exponentially faster nowadays, interpreting and acting on the data is still slower than you’d expect. Deciding which drop-off actually matters, which segment is worth chasing, and what to build next all take a ton of time. Thankfully, AI-assisted analysis can help with the interpretation side of things too now, not just by surfacing a number but by ranking it against everything else competing for resources.

What engagement data AI looks at
Before AI can tell you anything useful about product engagement, it needs quantitative metrics that show what happened and qualitative feedback that explains why.
1. Quantitative metrics
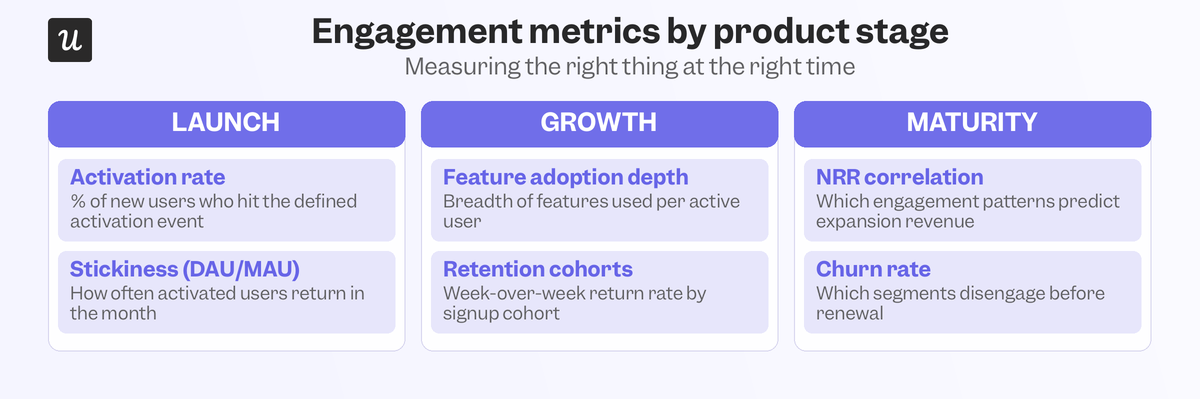
Quantitative data include metrics like product usage, session duration, activation rate, DAU/WAU/MAU, stickiness ratio, cohort retention analysis, and funnel conversion. This is the behavioral data that AI analyzes first because it’s already structured as numbers and thus easier for machines to parse without complex linguistic interpretation.
2. Qualitative signals
Net Promoter Scores, in-app survey responses, open-ended feedback, sentiment analysis, and session replay data give AI further context that quantitative metrics alone can’t provide. A retention cohort might show 40% of users churning at week three, but the number alone doesn’t say why. Qualitative signals explain whether those users hit a bug, never understood the product, or found a faster path to the same outcome somewhere else.
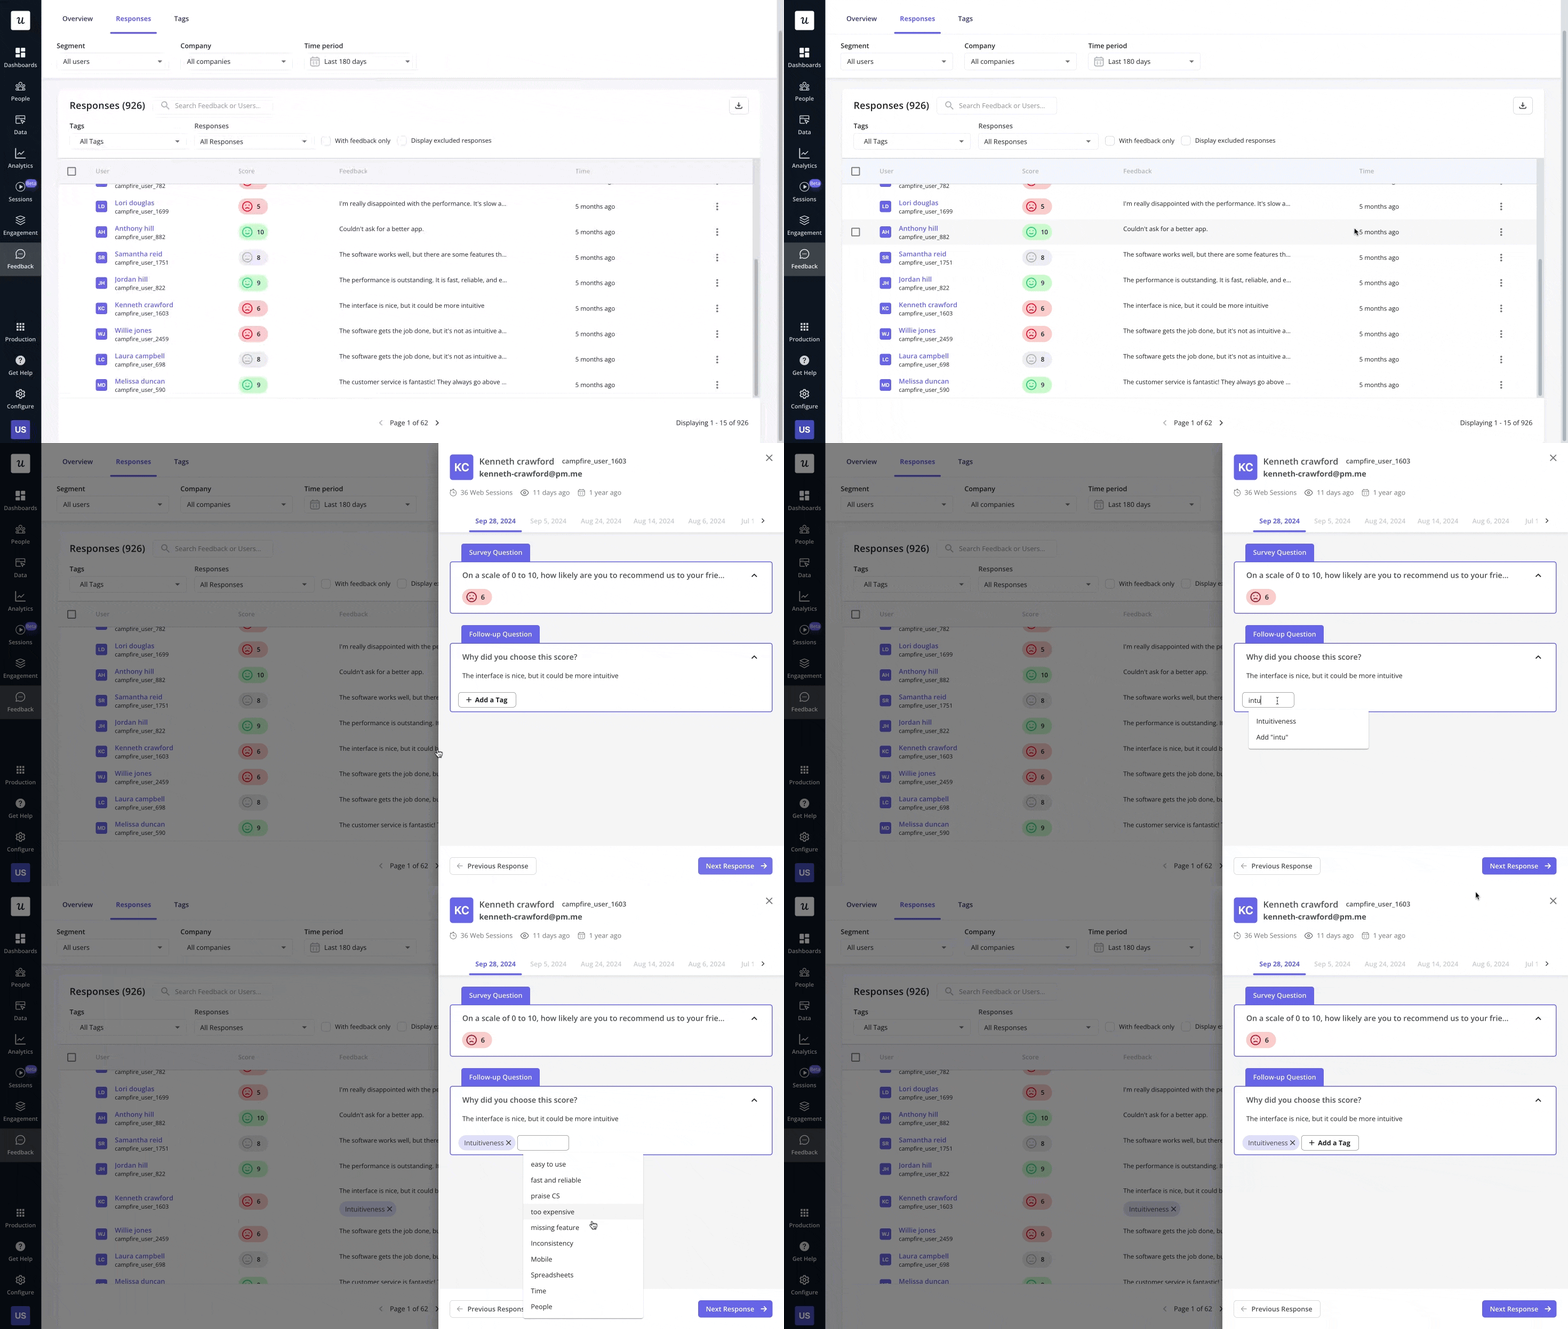
Both quantitative metrics and qualitative feedback are important because AI interpreting numerical data alone produces confident-sounding analyses of incomplete data.
How AI delivers real-time engagement data
Collecting engagement data used to be the bottleneck. Technological advancements have made it possible to track real-time engagement data that can keep up with user activity.
1. Autocapture removes the instrumentation backlog
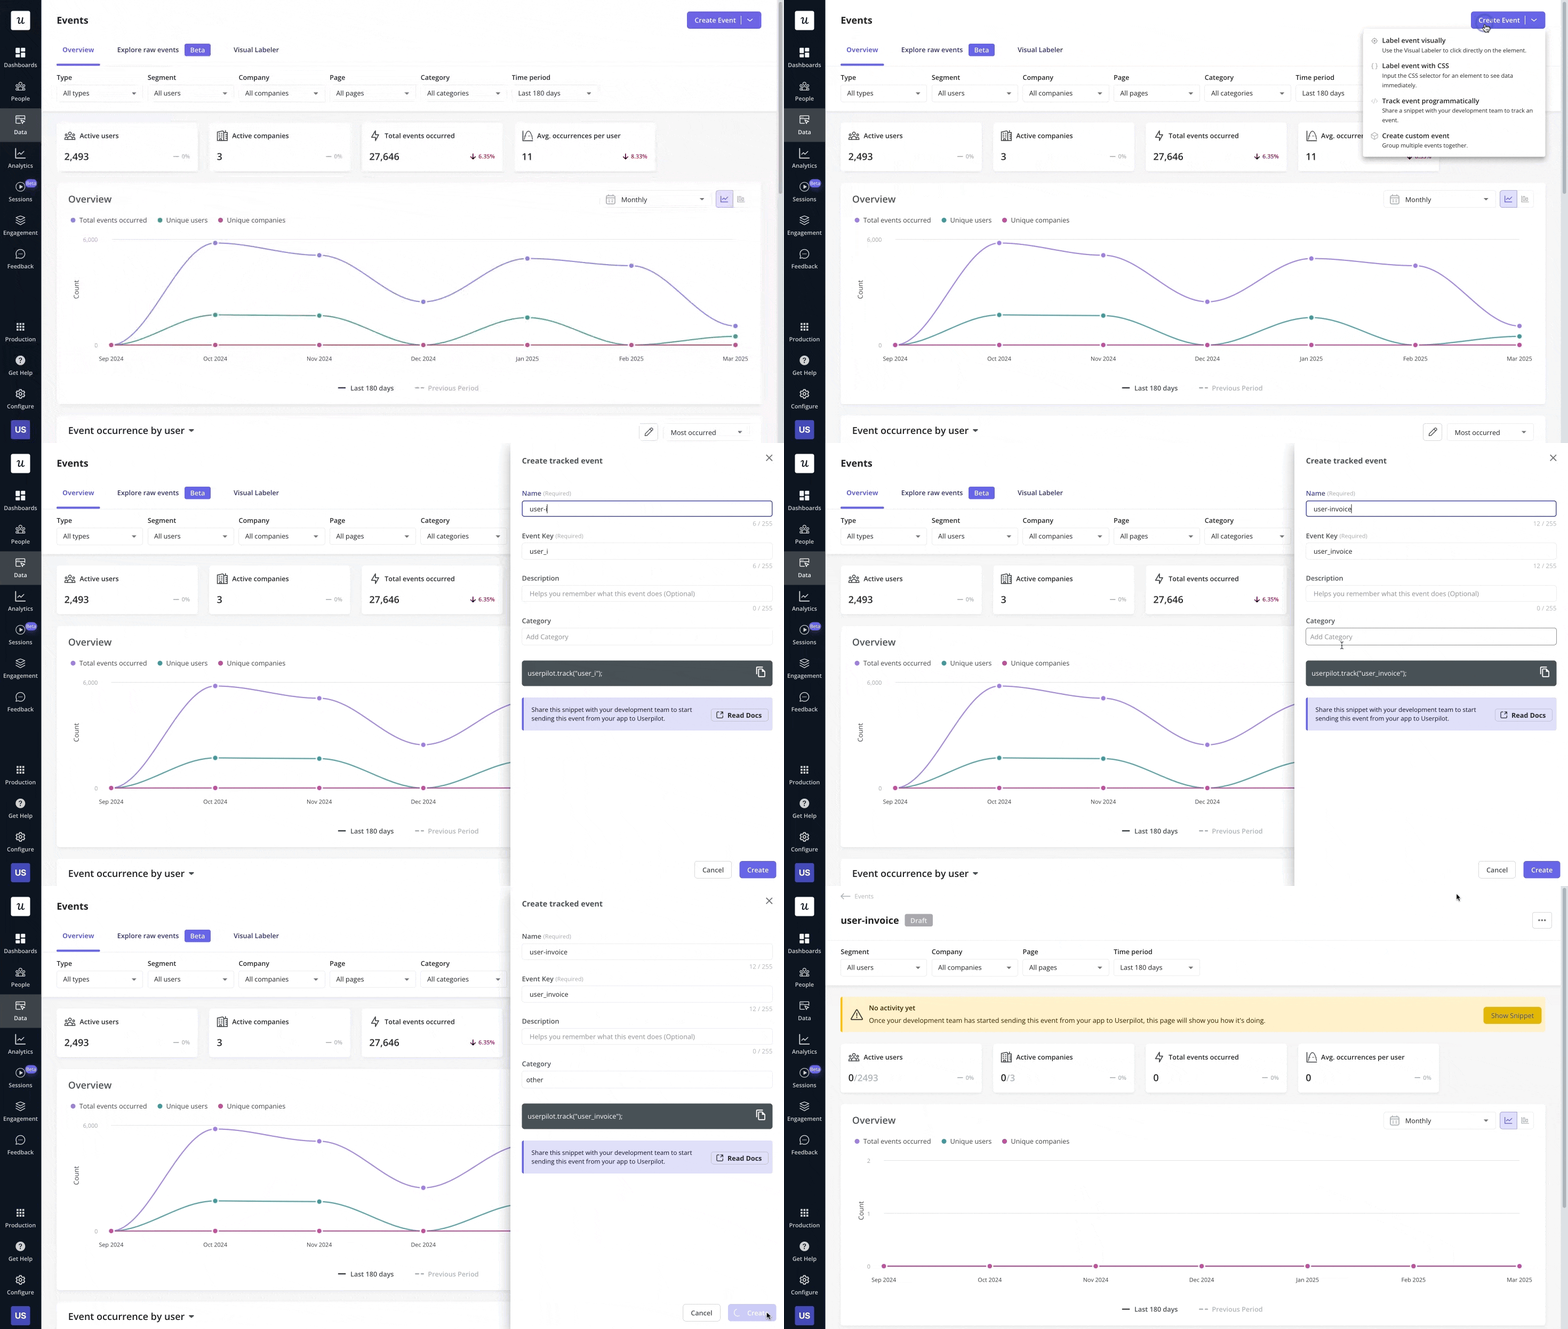
Getting meaningful behavioral data used to require defining events upfront, writing tracking code, deploying scripts, and waiting weeks before any analysis could begin. Autocapture eliminates that cycle by capturing clicks, inputs, and feature interactions automatically. This makes feature usage charts, inactive user segments, and churn prediction signals available for immediate analysis.
2. Funnel and path reports that update as users move
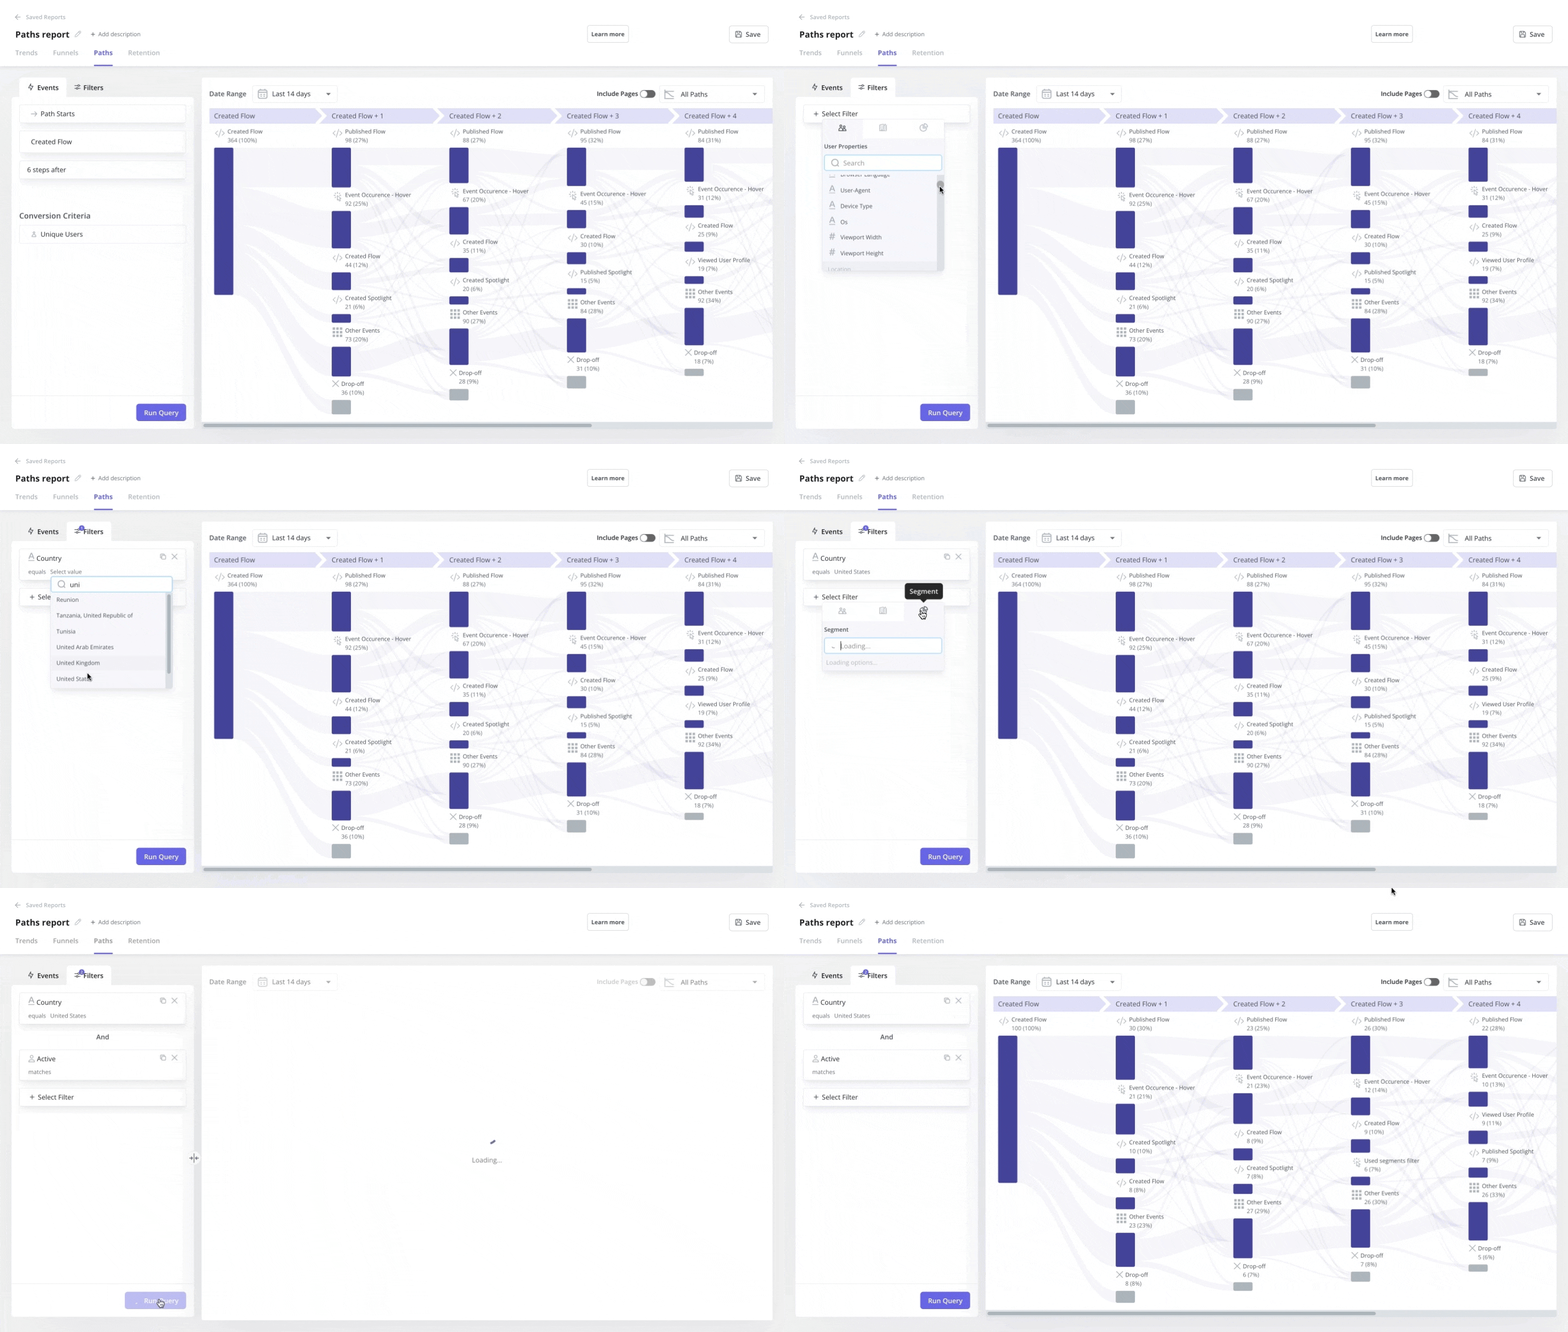
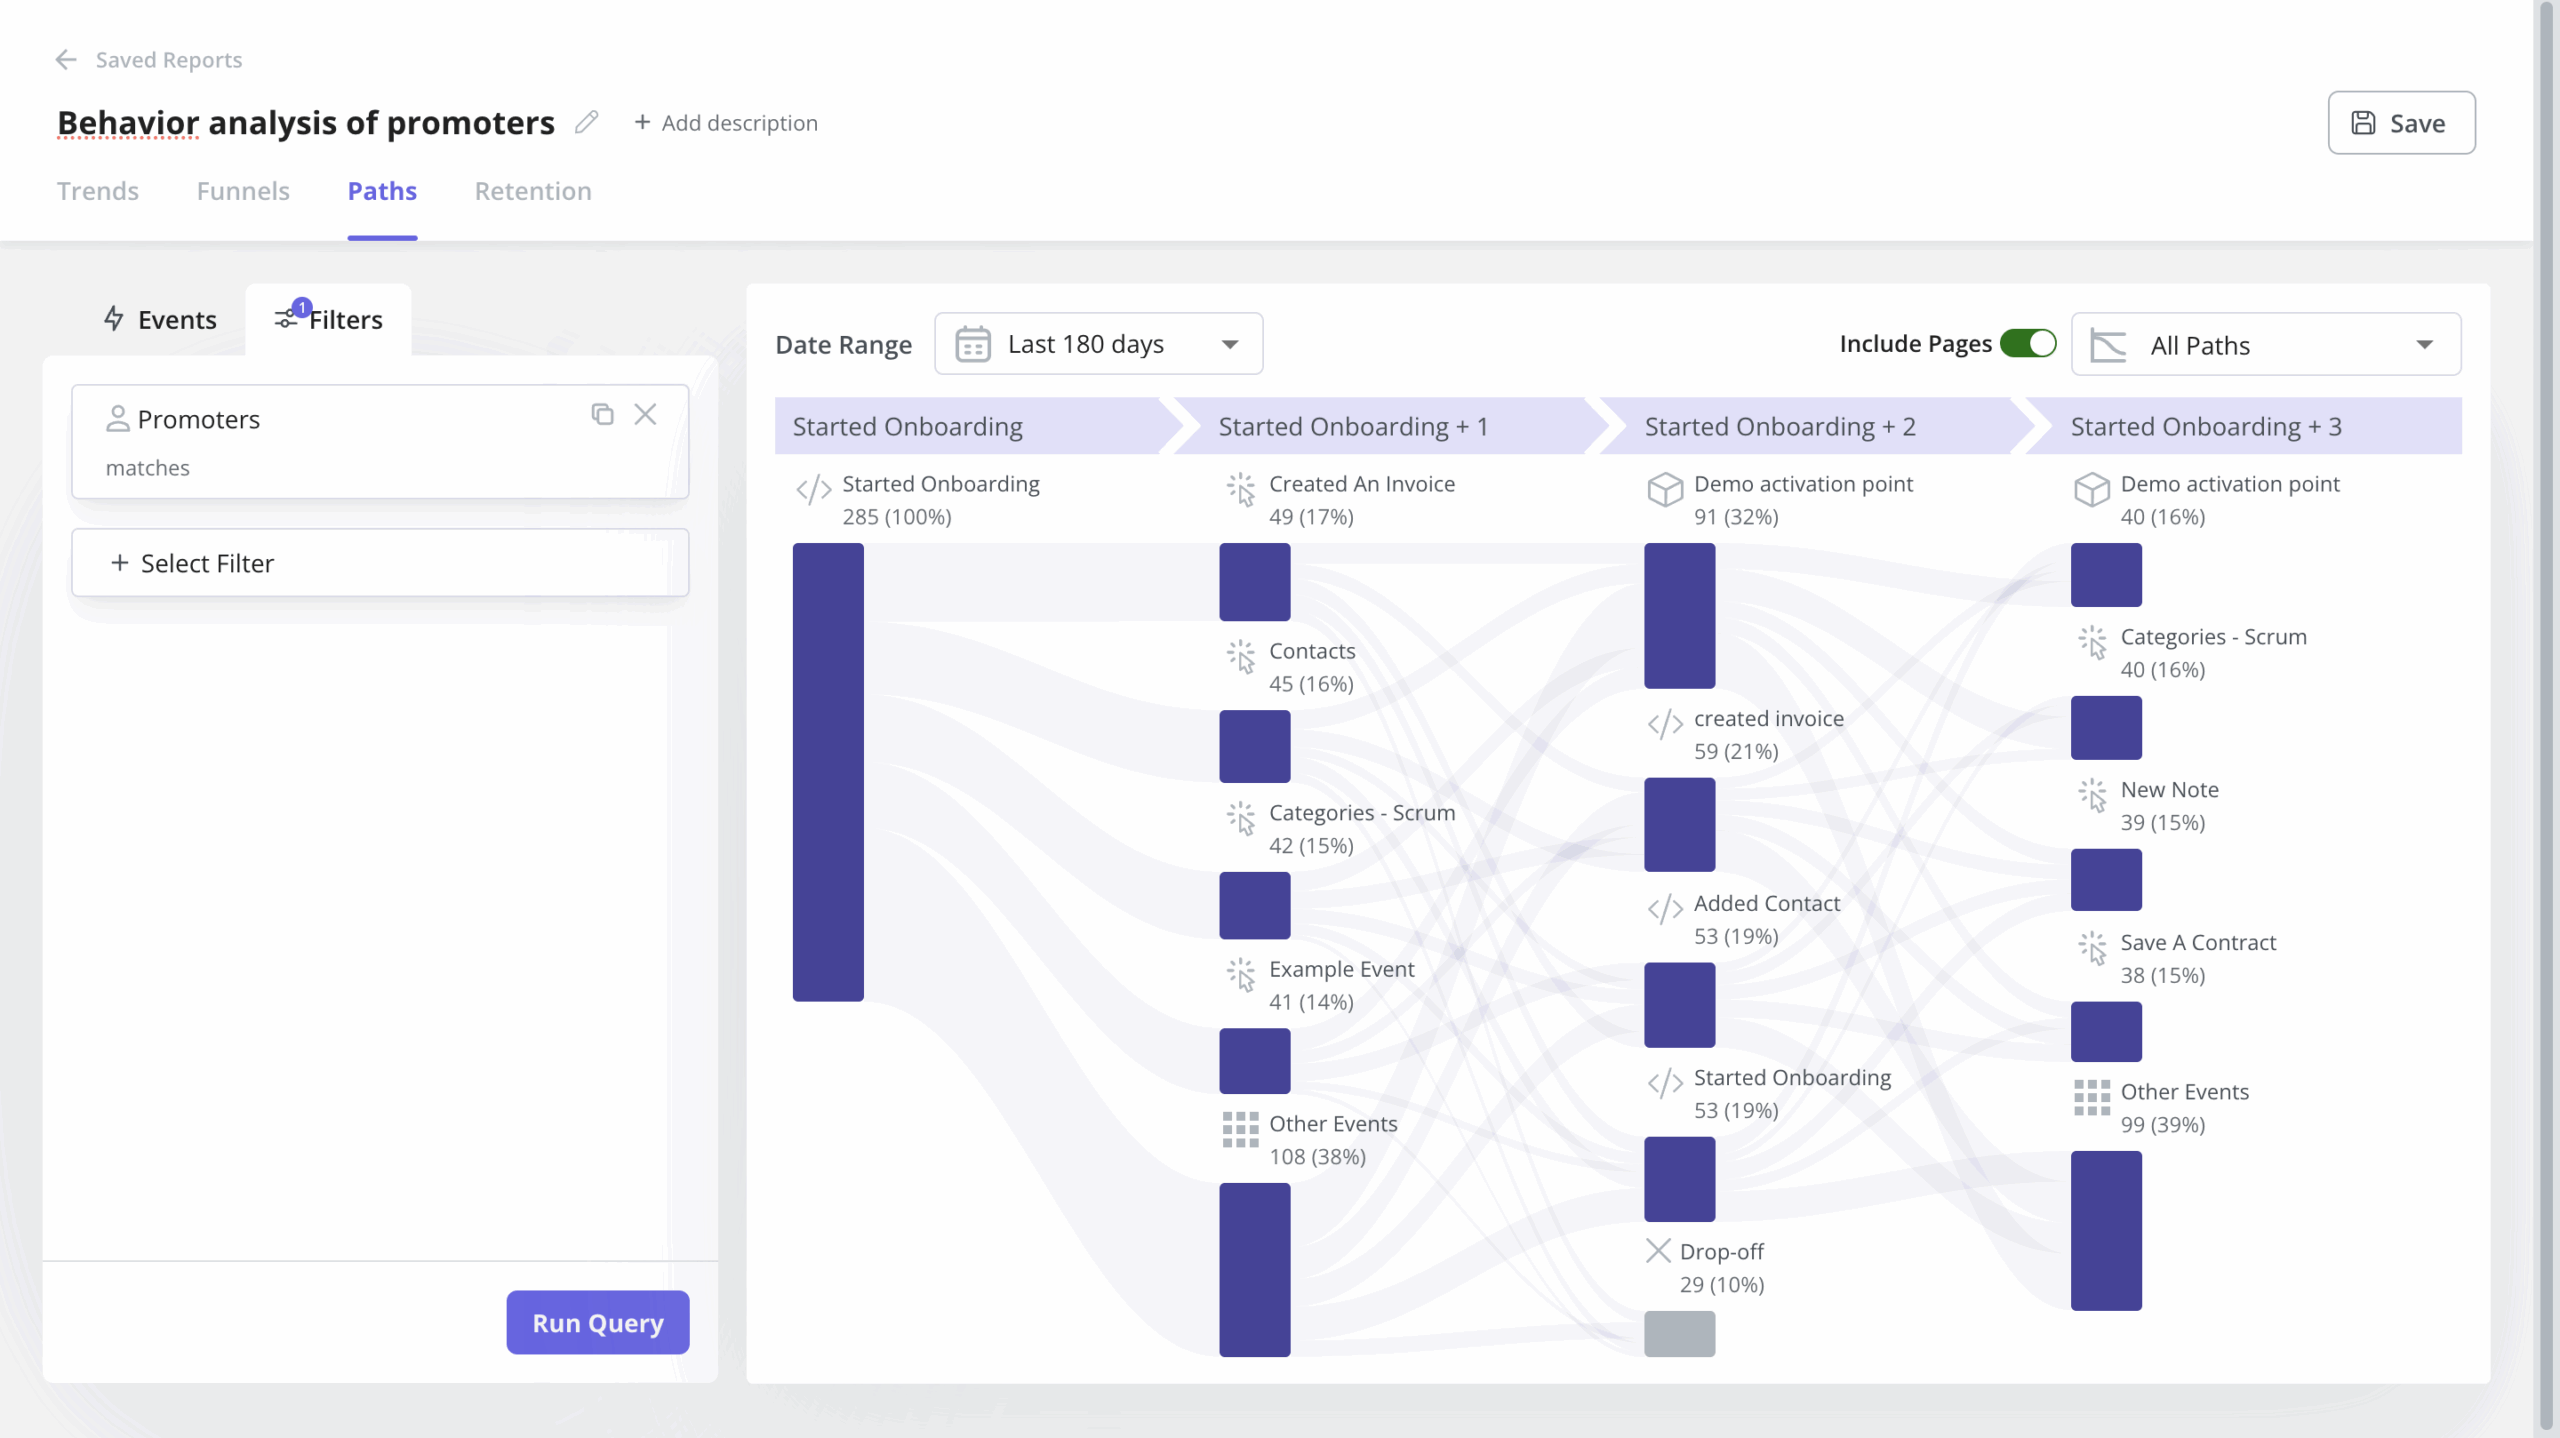
Rather than building funnel reports after the fact, AI generates and updates them continuously as users move through the product. This means drop-offs surface in real time instead of on a monthly or quarterly basis. Path analysis reveals what users actually do, not what the flow assumed they’d do. The divergence between the two is often where the most important friction points live.
3. Session replays surface at the moment they’re relevant
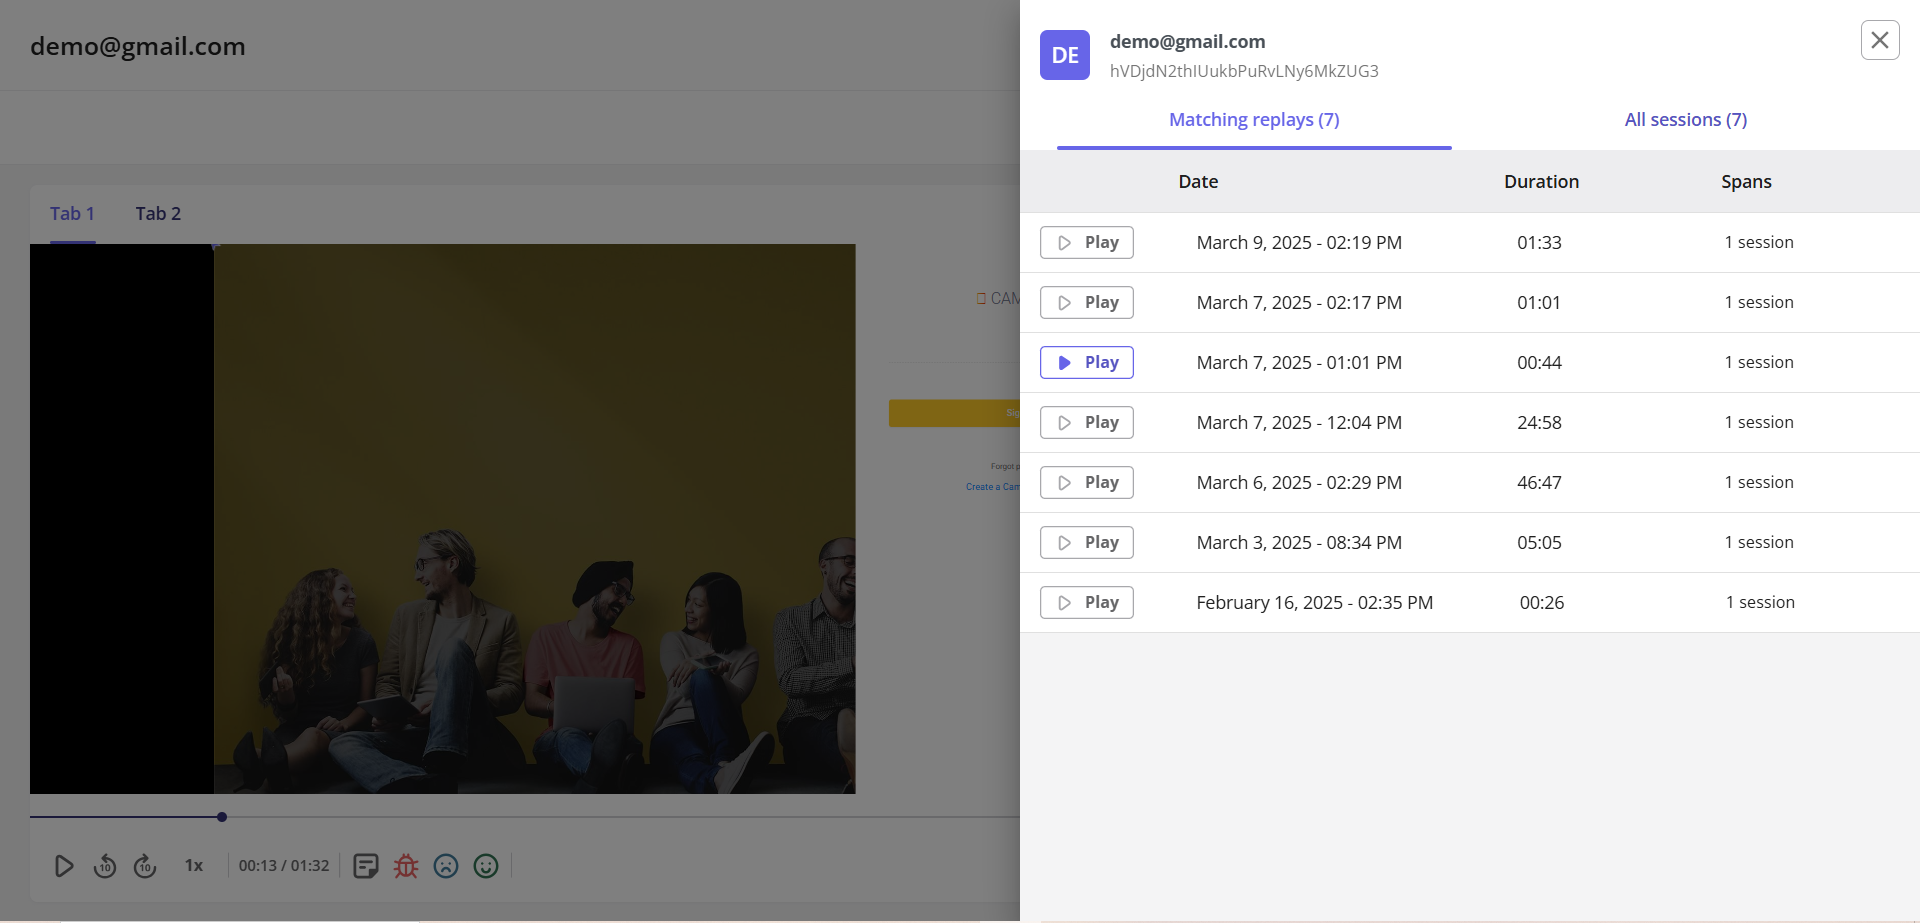
Instead of manually searching through recordings, AI flags the session replays that are most worth watching. It looks for recordings that feature rage clicks, failed interactions, or exits at high-drop-off steps. These are the signals that used to take hours of skimming through recordings to find manually. The signal-to-noise problem that made session replay time-consuming at scale has largely been resolved, with relevant context coming to you on its own.
4. Qualitative signals triggered by behavior, not just time
Welcome surveys at signup capture key data like the user’s role and job to be done, providing segmentation data that makes every downstream flow feel personalized while informing future data analysis. That data comes from the signup flow itself, the earliest opportunity to ask a new user what they’re actually trying to do with the product. A well-built welcome screen doesn’t just greet users; it collects the data points that will set the tone for the rest of their journey.
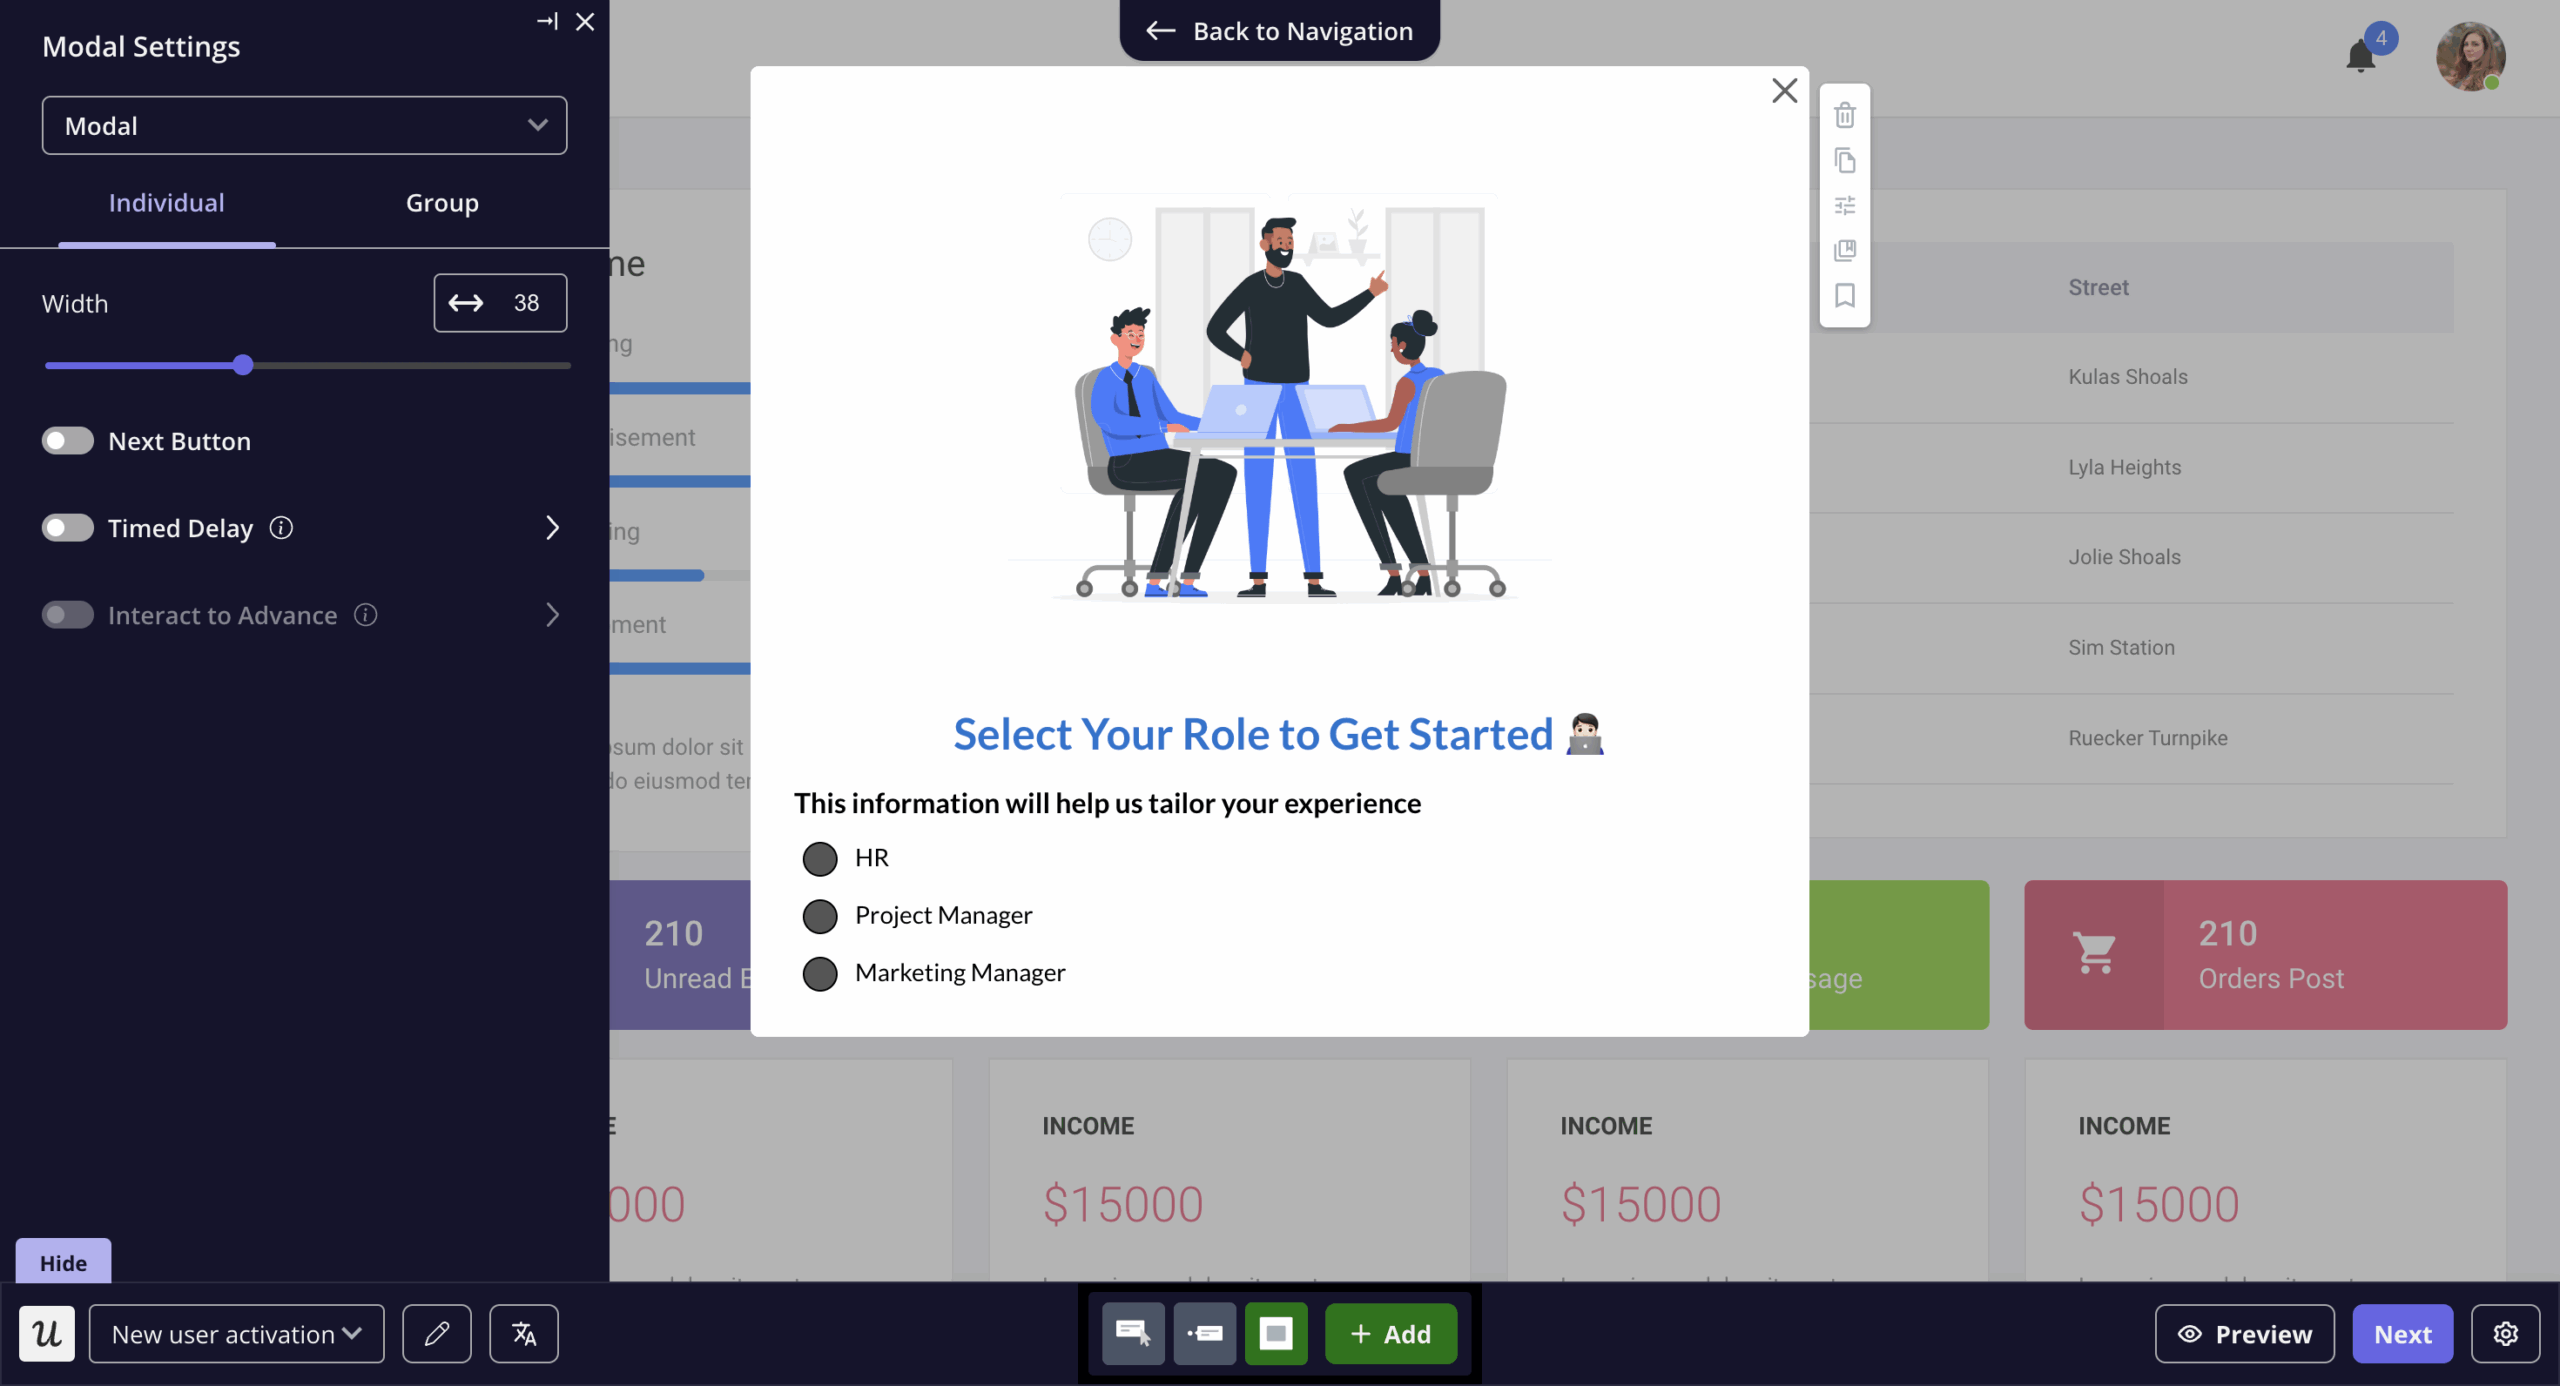
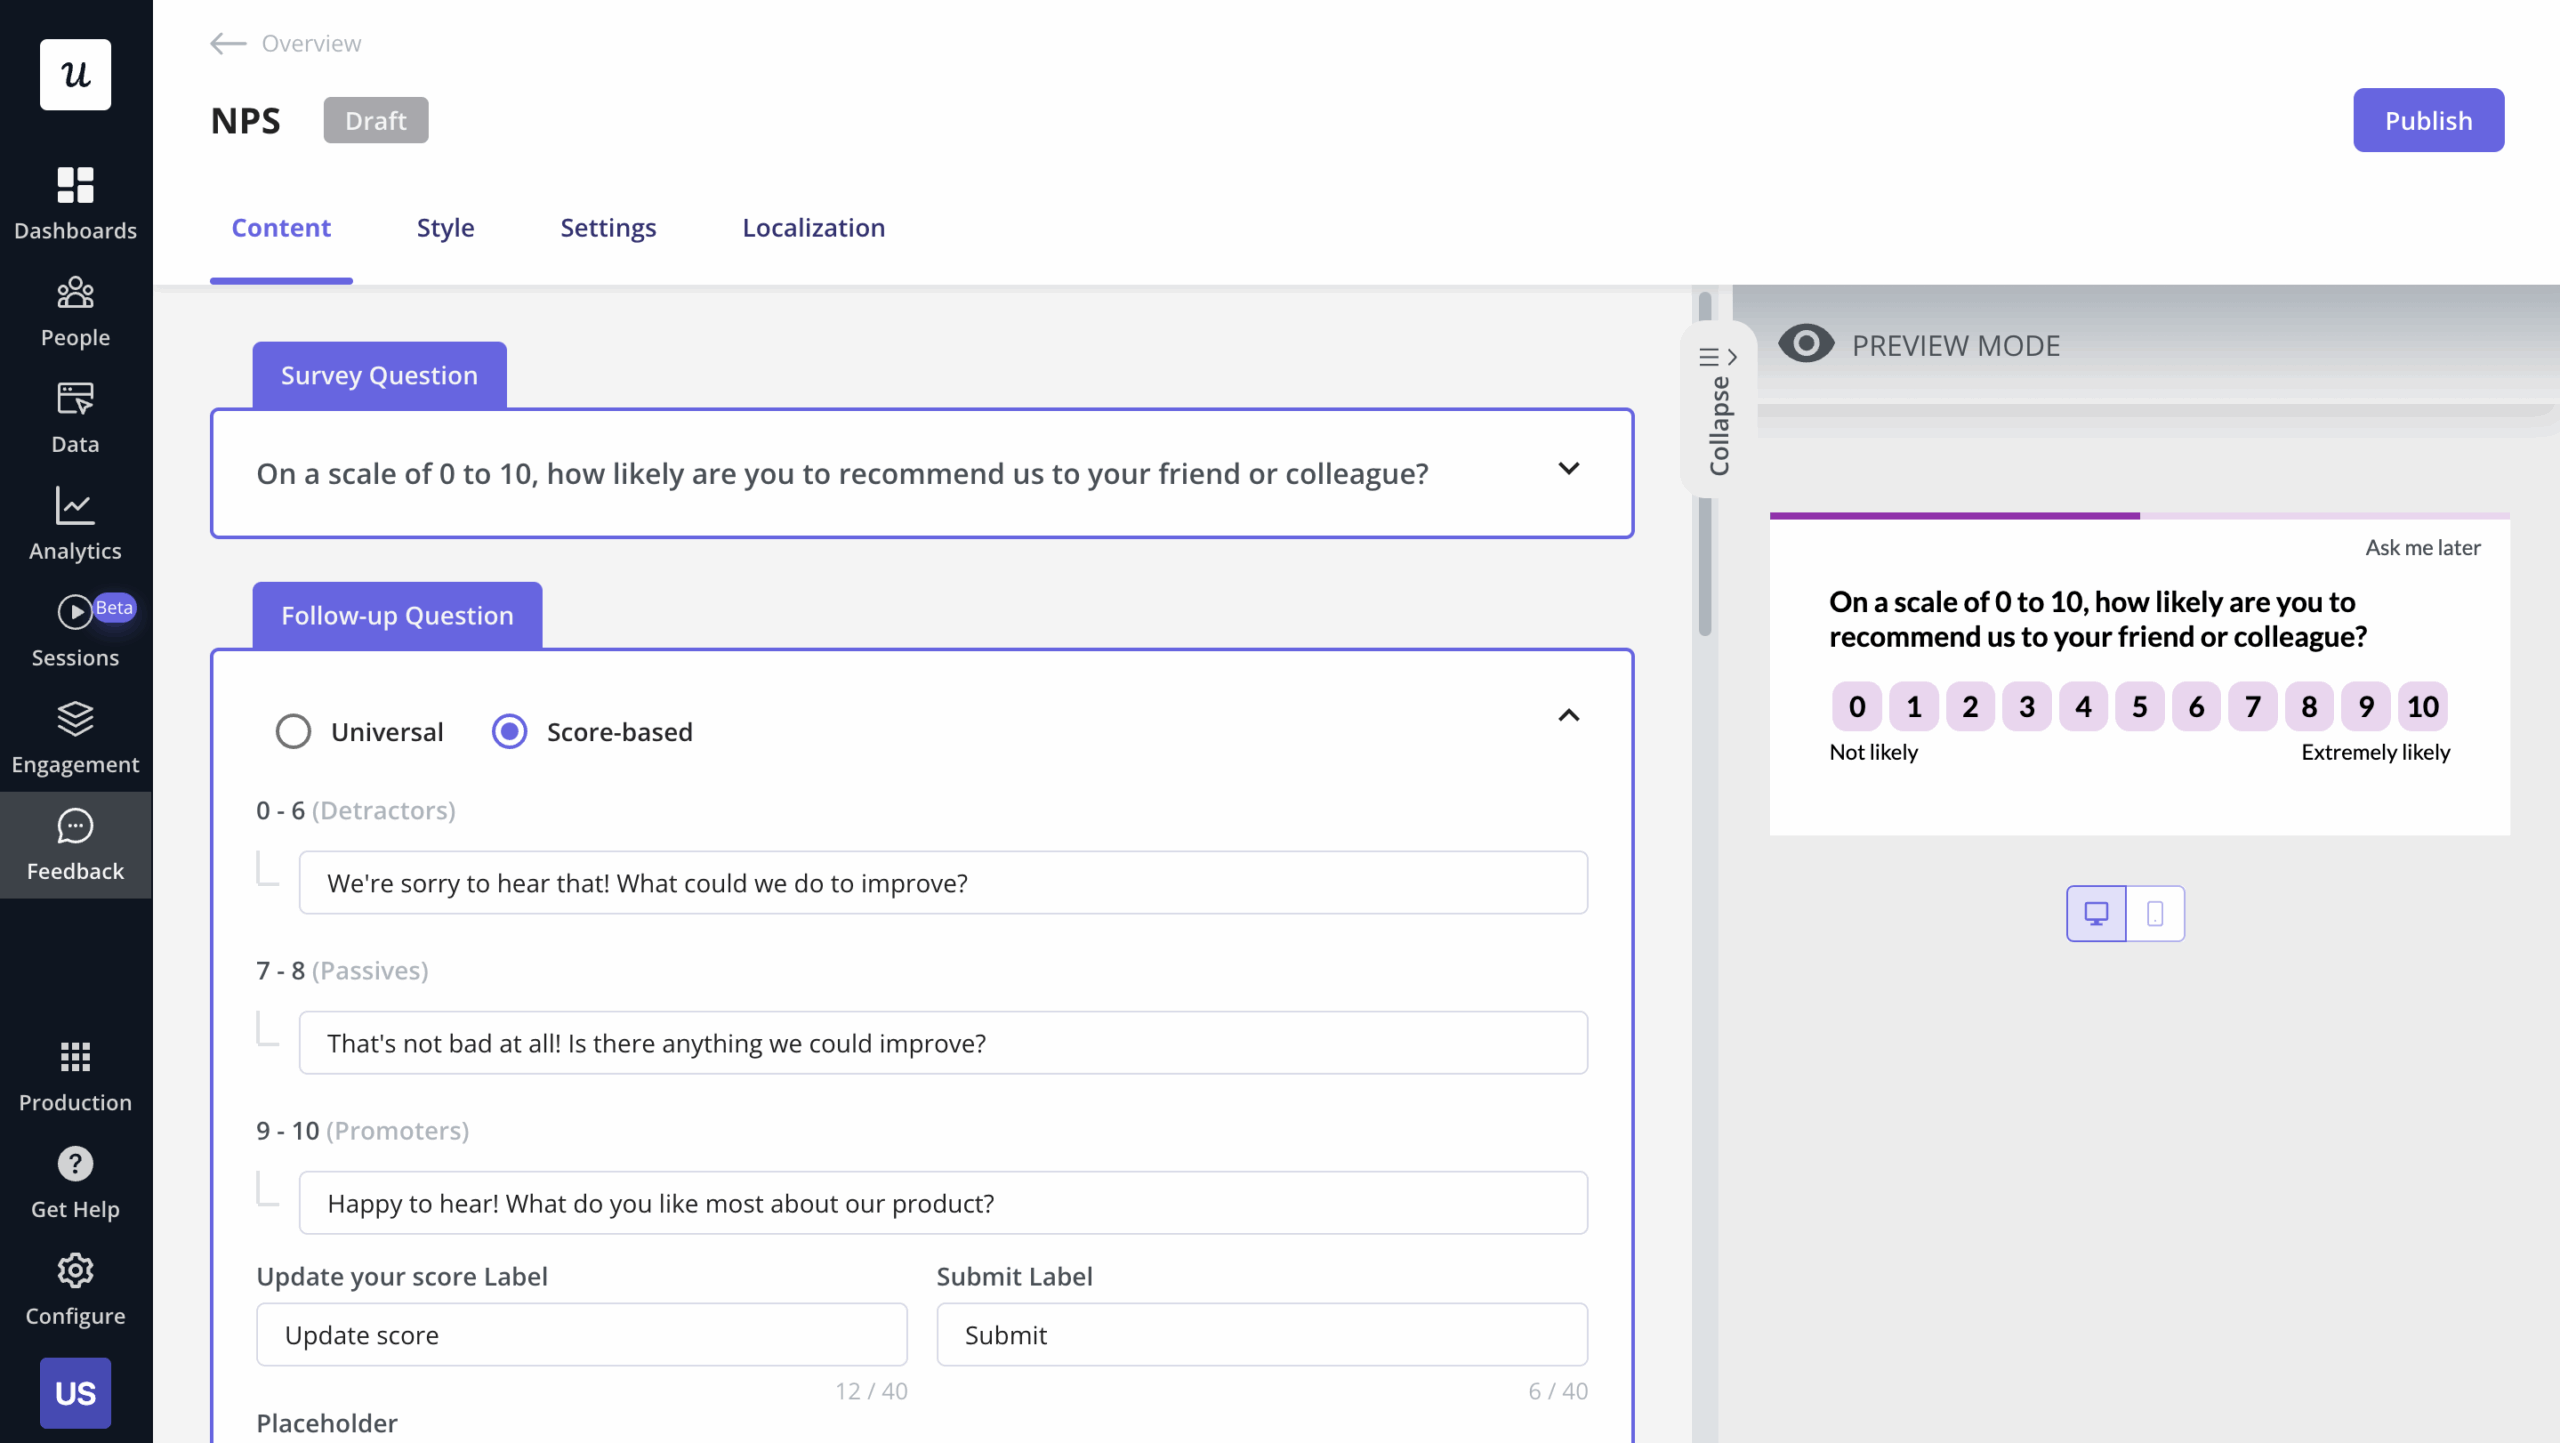
Everything traces back to whether that first JTBD question was asked well. Get it right, and every later personalization decision has a real reference point to start from. These in-app surveys should fire based on behavioral triggers instead of arbitrary timing. The best times to survey users are after they’ve completed a key action, hit a friction point, or reached a usage milestone. Well-timed surveys provide qualitative feedback that’s fresh and specific enough to act on immediately.
How AI interprets engagement signals
Numbers don’t interpret themselves, but what used to take a senior analyst days can now be assisted with AI in a matter of hours (if not minutes).
1. AI segments audiences before surfacing any metric
AI doesn’t just report that engagement is up. It breaks down which segments are driving that boost in engagement instead of operating on the topline metric alone. A feature with rising usage month-over-month can look like a win, unless you see the segment breakdown shows that the spike is coming from a plan tier you’re phasing out, while your strategic segment’s adoption has quietly dropped 20%. That’s the kind of mistake that used to make it into a product roadmap before anyone caught it.
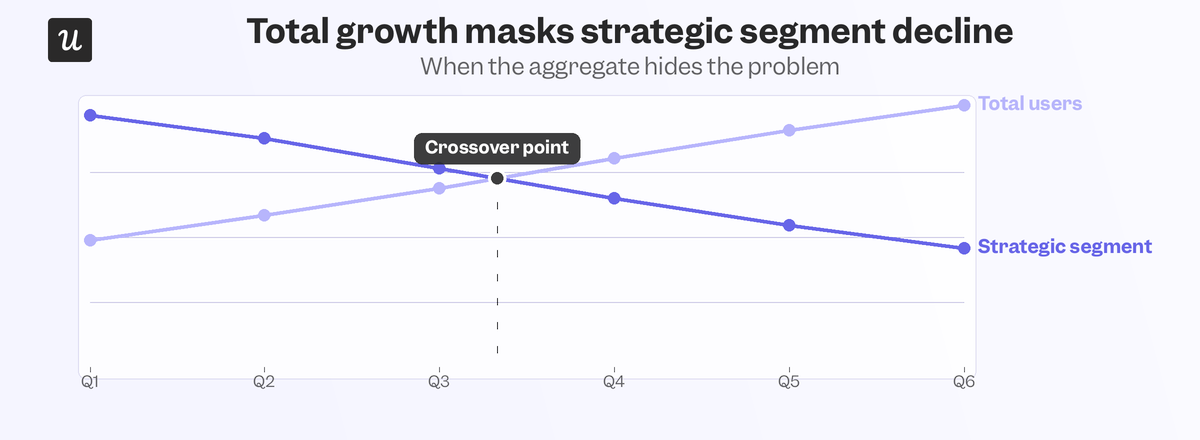
Segment-level analysis is how that connection actually gets made, and it’s now what runs by default instead of as a manual step someone has to remember to do after the fact.
2. AI reads behavioral context, not just raw numbers
A spike in time-on-page could mean users are immersed in the product, or it could indicate that they’re too confused to find what they need in a timely manner. A rise in clicks reads the same way, either active exploration or persistent frustration. AI layers qualitative context on top of the quantitative metrics to differentiate between engagement created from value and engagement that indicates friction.
Dr. Sara Weston, Associate Professor of Psychology at the University of Oregon, highlighted the importance of understanding context before interpreting data:
“If engagement went up 15% but nobody converted, bought, or stayed longer, you’ve built a shiny distraction. This is the part of data science that doesn’t look like data science. No model. No code. Just a series of questions that keep you from getting excited about the wrong number. The best analysts I know spend more time interrogating the question than running the analysis.”
That interrogation of “What does this metric actually mean and for whom?” now happens automatically before a finding ever gets surfaced to a human.
3. AI connects signals to outcomes, not just usage
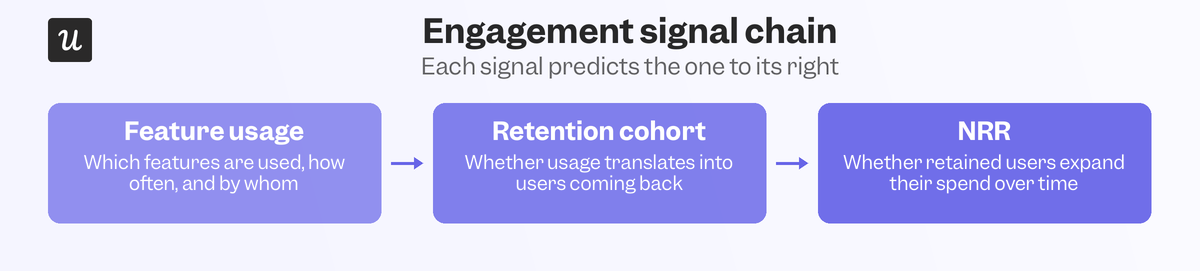
Every engagement signal gets traced forward now, following the customer journey from end to end. Does this feature’s adoption correlate with 90-day retention? Does an NPS score at week two predict trial-to-paid conversion? An engagement metric that doesn’t ask these questions and identify downstream impact is nothing more than a vanity metric in a fancy suit. AI filters for the signals that predict conversion, retention, activation, expansion, or churn and surfaces those instead of optimizing for whatever looks good on a dashboard.
How AI-powered flows act on engagement data
Beyond the inherent value of providing real-time insights, AI can also be used to act on the engagement data you collect from your users.
1. Personalized onboarding from activation patterns
JTBD data from the welcome flow, when combined with real-time path analysis, identifies what activation looks like for each segment. This makes it possible to build personalized onboarding flows targeted to those specific paths. Checklists, interactive walkthroughs, and hotspots can then be deployed based on behavioral signals and user segments instead of calendar schedules. The goal is to close the gap between what a user signed up to do and what they actually do in the first week, shortening time to value for each segment separately.
2. In-app interventions at the moment of friction
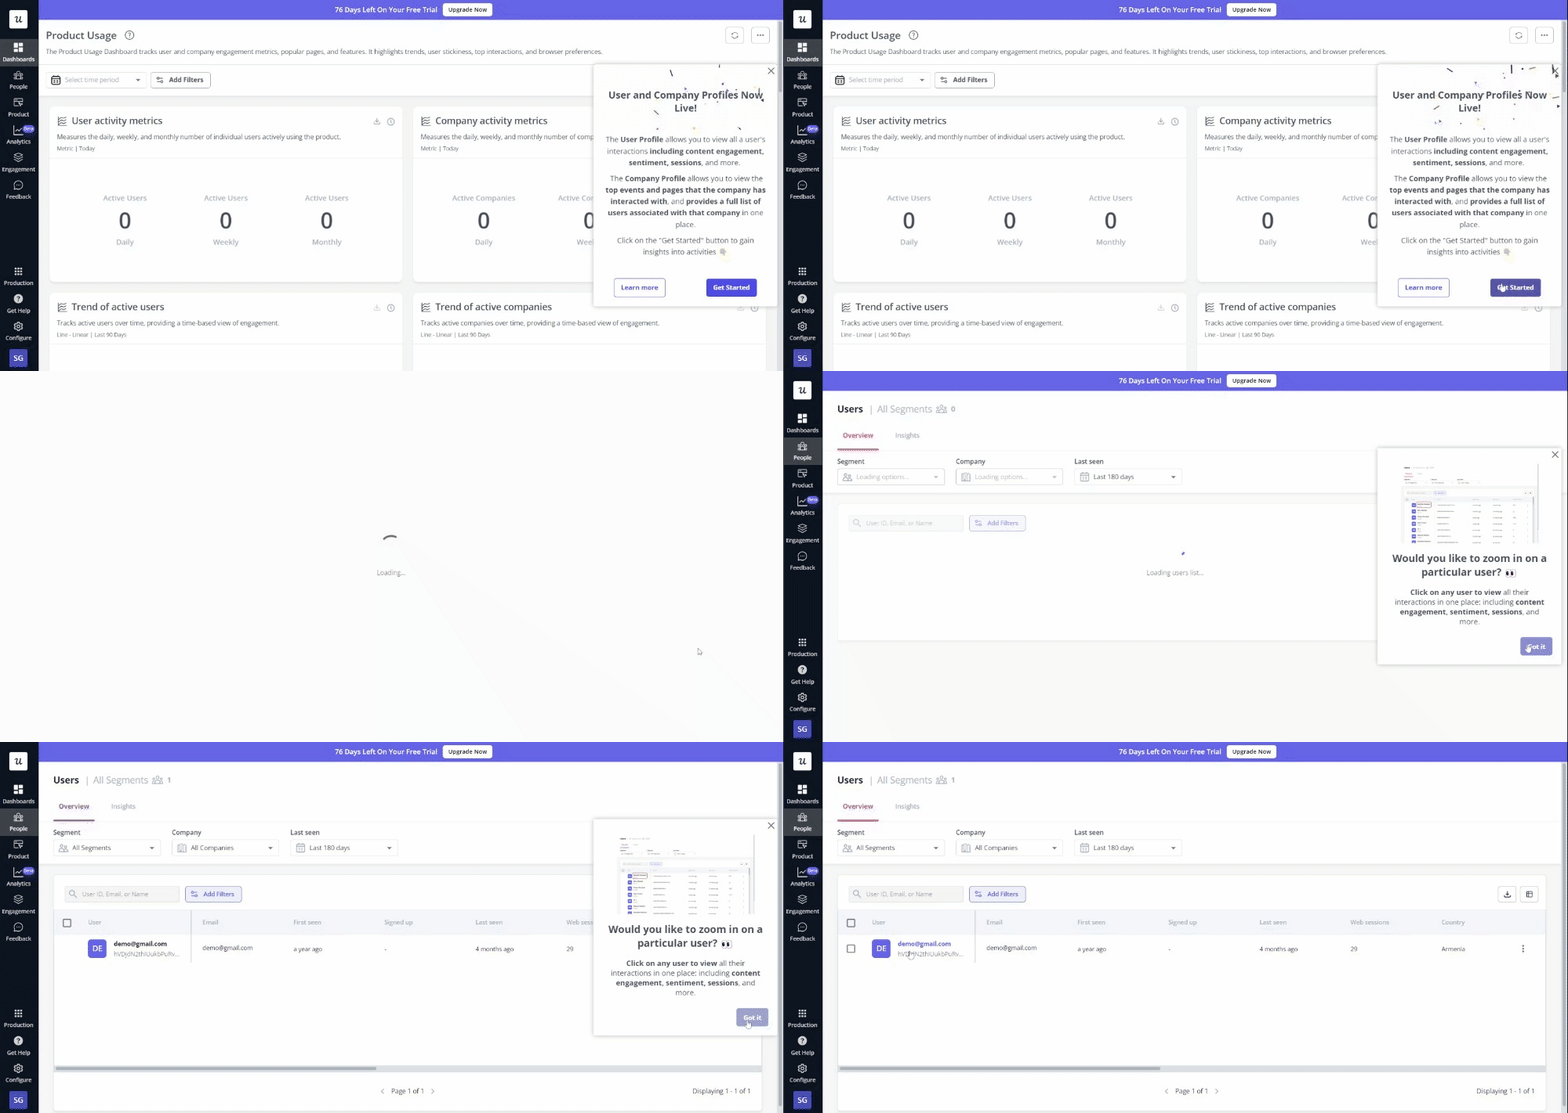
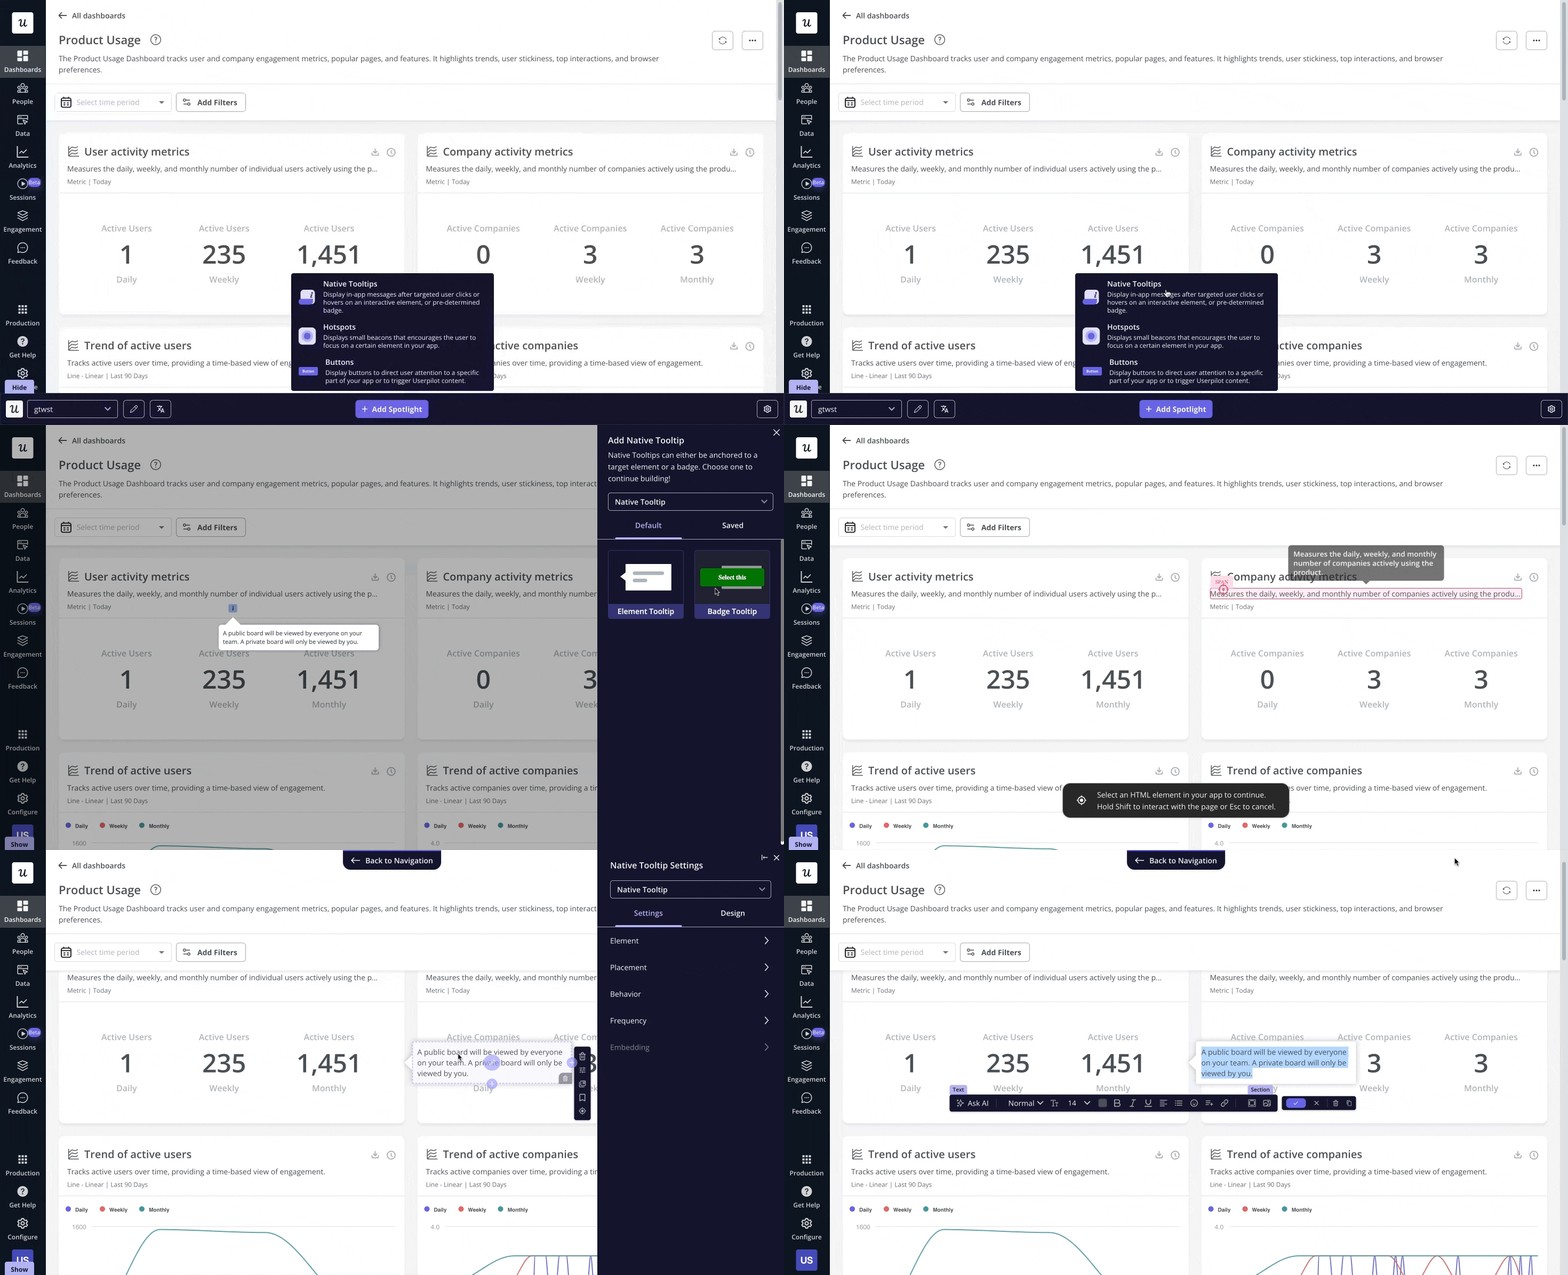
When we launched Userpilot’s email feature, the funnel showed a sharp drop-off rate at domain verification. Within a few hours, I built a targeting tooltip and showed it to users, highlighting the exact steps, so it was clear what to do next. That cut friction and supported users in real time, without pulling in our dev team at all. The loop from signal to fix is short enough now that friction points get handled in real time instead of queued for the next release cycle.
In-app messaging can provide contextual onboarding within the product itself, targeted to the exact step where the behavioral data showed people getting stuck.
3. Re-engagement flows for users going quiet
Behavioral data identifies at-risk users before they formally churn. Drops in session frequency, detractor NPS responses, or incomplete activation all trigger user re-engagement flows before it’s too late to save unhealthy accounts. Since inactive users are (by definition) outside the product, in-app marketing won’t reach them. That’s why automated personalized emails targeting the same behavioral segment should handle the job instead, sending a message based on exactly where someone dropped off rather than a generic newsletter blast.
Grammarly sends simple re-engagement emails with a writing report showing zero activity (adding gamified FOMO that most users respond to).

4. A/B testing that closes the feedback loop
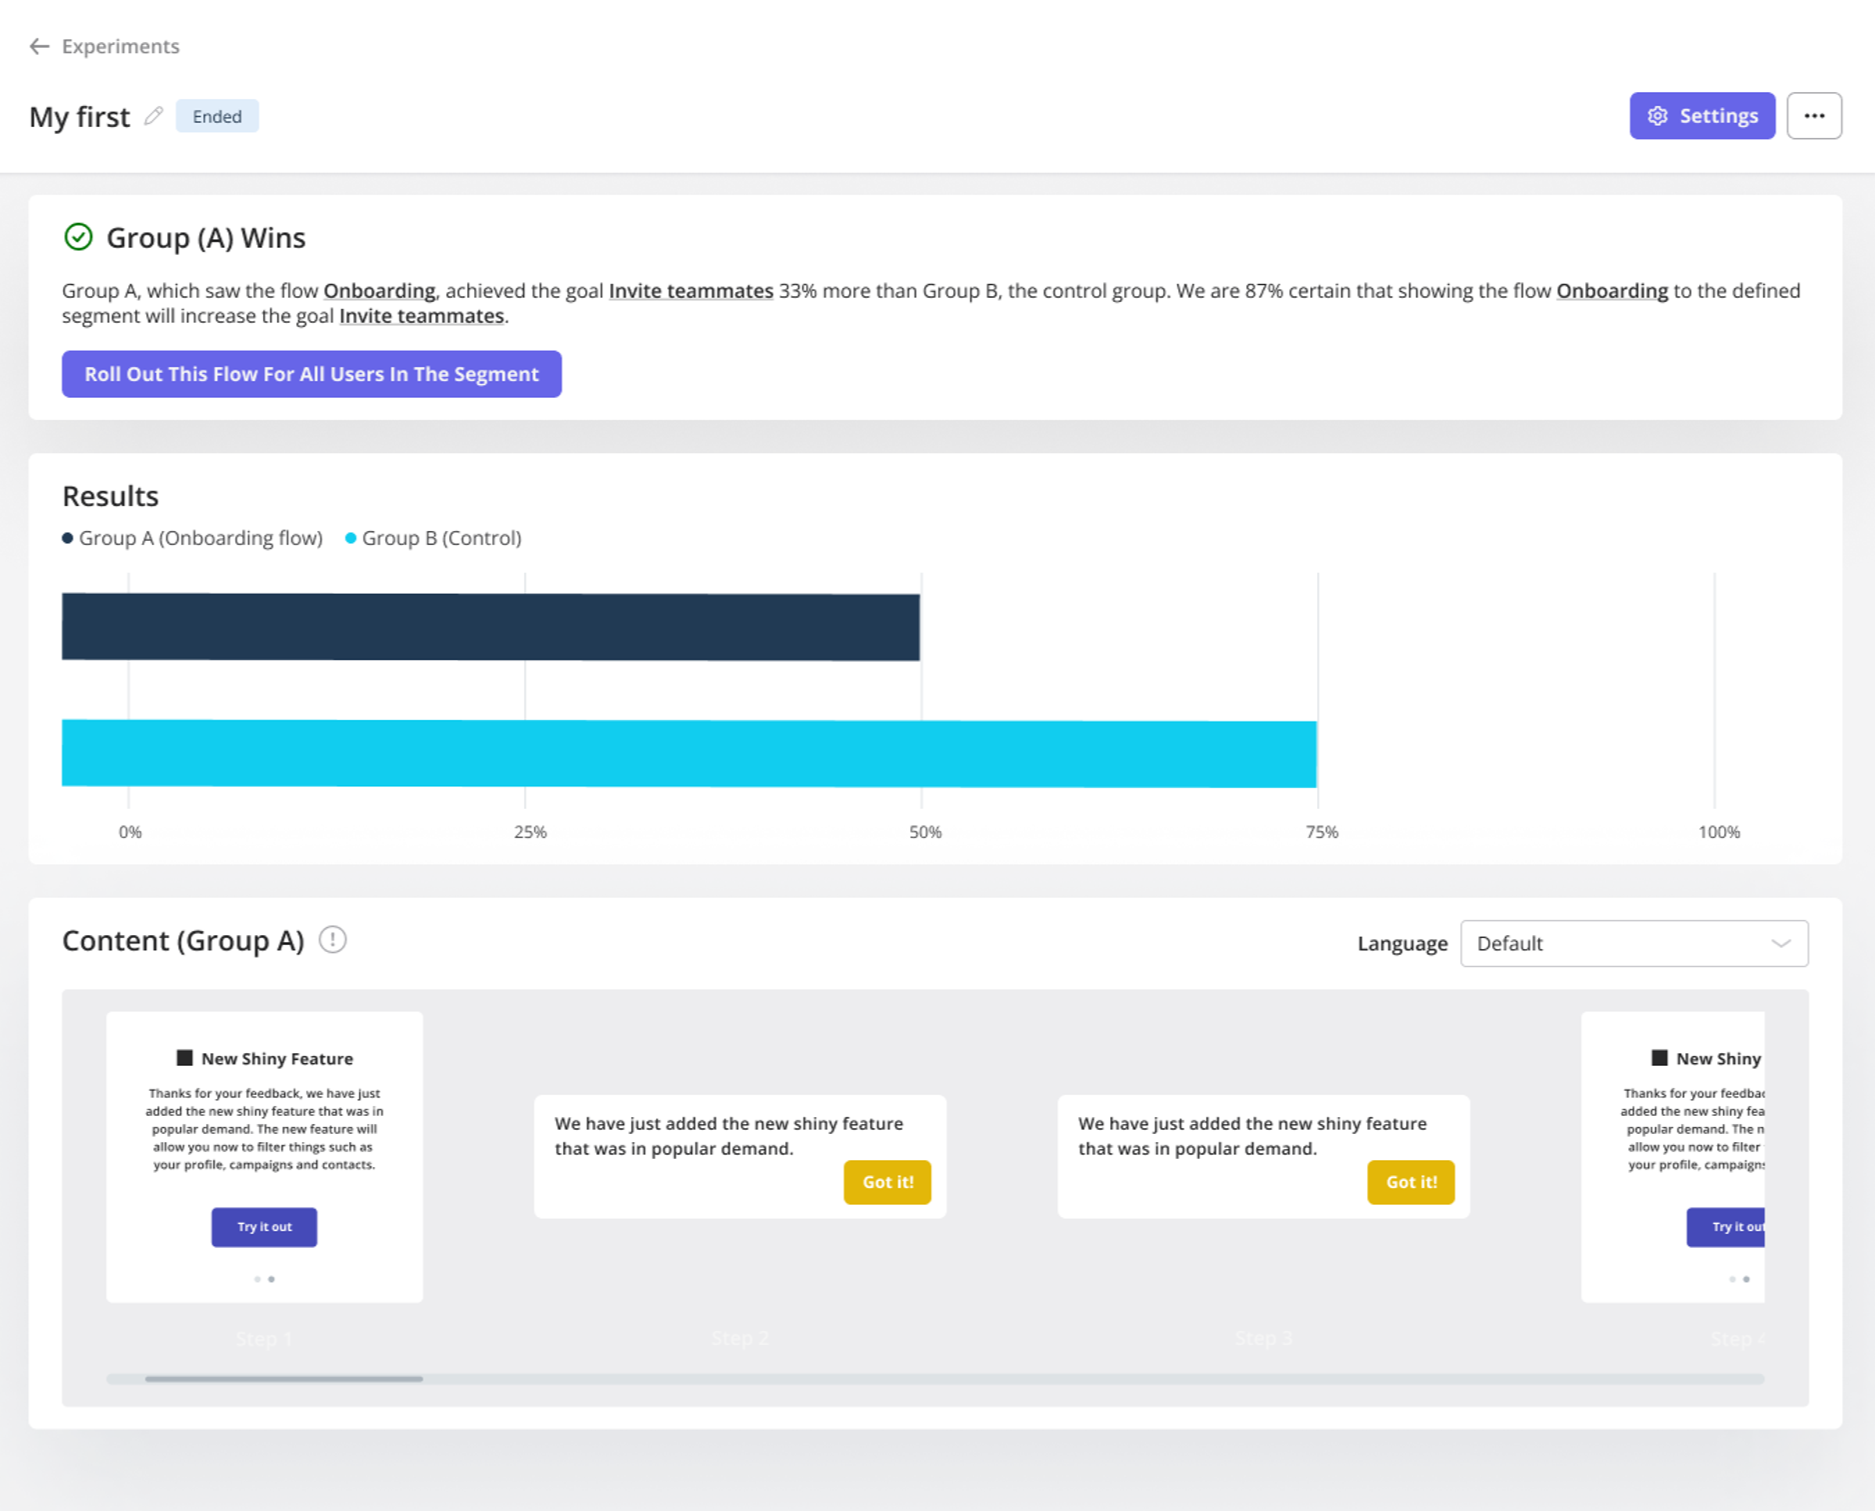
AI surfaces where to intervene, but A/B testing confirms whether the intervention actually worked. Testing product tours, in-app messages, or UI/UX changes against a control group converts behavioral hypotheses into confirmed improvements while allowing you to revert changes with a detrimental impact. Userpilot supports controlled, head-to-head, and multivariate testing, then connects results back to the same engagement metrics the hypothesis was based on.
What to watch for when using AI
The output quality depends on the input quality. AI doesn’t fix bad inputs, it just analyzes them faster. As such, AI analysis is only as good as the events it has access to. If you feed the machine raw pageviews and download counts, it will confidently optimize for the wrong signals. Activation rate, retention cohorts, and feature-specific events give it tangible outcome-based metrics to work with.
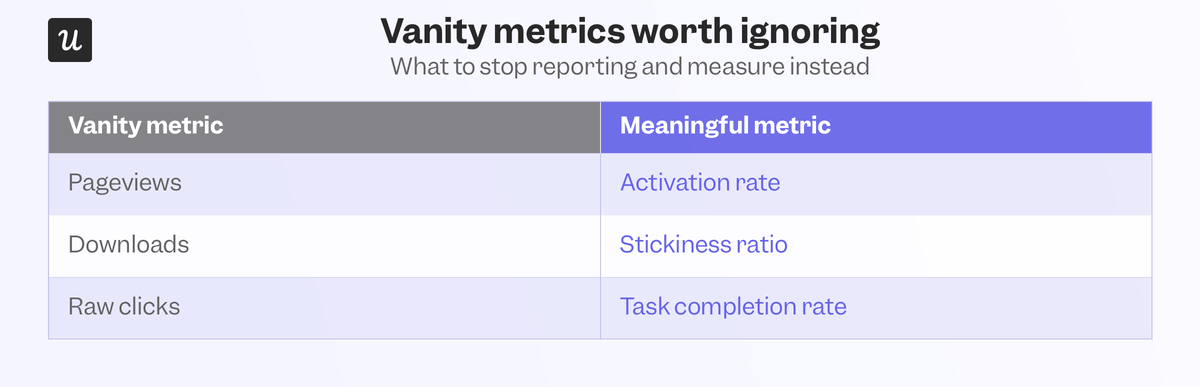
The same is true for session recordings. If you’re not capturing rage clicks and failed interactions in the event data stream then AI has nothing to flag, leaving friction points undetected until you hear about them in a churn survey. The diagnostic depth of AI-powered analysis scales directly with how comprehensive and segmented the data it’s given is. More data is usually better, but there comes a point where adding vanity metrics just creates distractions instead of contributing anything substantial.
Where this leaves you
Engagement data was always supposed to tell you what to build, what to fix, and who to prioritize, but manual analysis used to be so slow that most teams ended up relying on gut instinct and competitor research. AI closes that gap with real-time behavioral capture, instant pattern interpretation, and flows that act on user behavior. These advancements have compressed a process that used to take weeks into something that now runs continuously in the background without you noticing.
If you want to see what that looks like within your own product, book a Userpilot demo and we’ll walk you through it!
About the author