12 Best Product Analytics Tools Shortlisted for Actionable Insights: Tried and Tested

Too many teams buy product analytics tools that are either overkill or too limited for their needs.
For this reason, I set out to compile 12 platforms for different product analytics use cases, based on their core features, pros, cons, and pricing ranges.
Let’s look into each of them, as well as my process for choosing the right tool for your business.
How we shortlist product analytics software
I selected these product analytics tools across three main categories of analytics needs. Each tool was evaluated for its best-fit use case, core features, and pricing. They include:
- All-in-one product growth platforms that combine product analytics with in-app guides to take action on insights (e.g., triggering personalized in-app tutorials).
- Product analytics suites that track user events and behaviors at scale for deeper reports. I also included Datadog’s RUM (Real User Monitoring) for a developer-focused product usage analytics.
- Visual and qualitative analytics that focus on session replay, heatmaps, and user experience analytics.
Best product analytics tools with detailed reviews and use cases
Now, let’s dive into each tool, covering what each is best at, key features, pros, cons, and pricing structure.
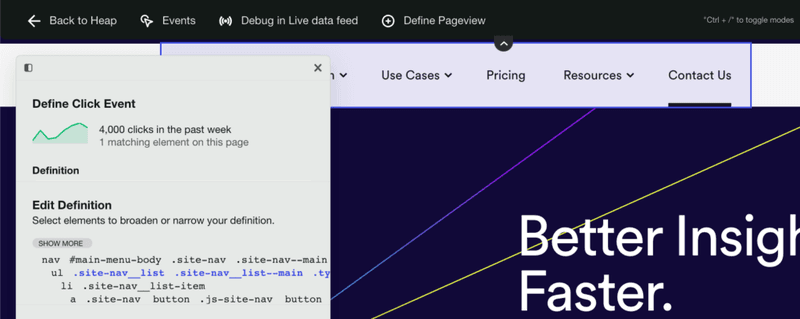
Heap: Digital analytics platform with auto-capture
Best for: Product teams, marketers, and data analysts who need to deeply understand user behavior across web and mobile platforms without manual tracking
Heap automatically captures all user interactions with less manual setup.
Main features
- Automatic capture of all interactions: Heap logs every user action (click, tap, swipe, page view, etc.) once you install it on your site or app. This means you can always analyze them retroactively.
- User segmentation: It includes robust segmentation tools that group data by user properties or behaviors. This lets you filter analyses to specific user segments to understand their differences.
- Behavioral analytics: Heap includes funnel analysis, journey analysis, and retention charts. It also offers the “Engagement Matrix”, which correlates frequency of certain actions with retention.
- Heatmaps and session replays: In addition to quantitative data, Heap includes built-in heatmaps to visualize where users have more activity. As well as session replays, which let you watch actual user sessions to see their real behaviors.
Pros
- Autocapture frees them from having engineers instrument every event and allows them to focus on features.
- Heap provides very granular detail on user behavior, with more flexible charts than many alternatives.
Cons
- Heap captures a lot of data but doesn’t have an easy way to filter it, which overwhelms most users.
- Heap’s pricing is based on session volume. This, paired with the autocaptured feature, can make it very expensive (and unpredictable) for tracking too many events you might not need.
- You need an add-on (Heap Connect) to export data to a warehouse.
Pricing
Heap’s pricing is not fully public on their site. According to Vendr, the ACV can range from $12,072 to $122,456 based on your needs and session volumes.
What’s your primary goal with product analytics tools?
How important is it to *act* on insights (e.g., launch in-app guides) in the *same* tool?
Is your main focus fixing bugs or improving UX?
You need an All-in-One Product Growth Platform.
Your goal isn’t just to find insights, but to *act* on them. A tool like Userpilot combines powerful analytics with no-code engagement features (like in-app guides and surveys) so you can close the loop from insight to action in one place.
You need a dedicated Product Analytics Suite.
You’re focused on deep data diving. While tools like Heap or Mixpanel are great for this, consider that Userpilot’s analytics are powerful enough for most product teams *and* include session replays, giving you a complete picture without needing a second tool.
You need a Developer-Focused Tool.
Your priority is technical performance. Tools like LogRocket or Datadog are built for engineers. However, if your product managers *also* need to see how users behave (without the technical noise), Userpilot’s session replays are built for PMs to easily spot UX friction.
You need a Visual & Qualitative Analytics Tool.
You want to see the “why” behind the numbers. While Hotjar is a popular choice, many teams find they quickly need quantitative data (like funnels) too. Userpilot provides both session replays *and* powerful product analytics tools, so you don’t have to glue two platforms together.
Mixpanel: Advanced event analytics platform
Best for: Product-led SaaS, B2C companies, and startups seeking fast, interactive, and user-centric behavior analytics
Mixpanel is an event-based analytics tool with granular insights into specific user actions.

Main features
- Complete event tracking: Mixpanel allows you to instrument custom events to capture virtually any user interaction (e.g., button clicks, form submissions, purchases).
- Behavioral reports: Mixpanel provides funnel reports to visualize how users progress through multi-step processes, the “Flows” feature to show the common paths users take through your product, and a retention analysis graphic that tracks how often users come back to your product after a certain action.
- Interactive dashboards: The Insights reports allow ad-hoc querying on events, and Boards are customizable dashboards where you can pin multiple reports and KPIs.
- Session replays: It records anonymized user sessions and links them to your analytics data. This lets you pair quantitative data with qualitative insights to validate hypotheses and spot issues.
Pros
- Powerful real-time reporting tools such as funnels, retention cohorts, and segmentation, which work cohesively with its event tracking capacity.
- It integrates with 40+ tools, making it possible to import and centralize all your data in one place.
Cons
- Steep learning curve for first-time users, especially for advanced features.
- Developer help is necessary to instrument events, especially for setting up a good event taxonomy. This means you need a well-thought-out tracking plan, or else the data will become messy.
- Mixpanel’s event-based pricing becomes expensive and unpredictable as data volume grows.
- Many advanced features (e.g., cross-platform tracking, root-cause analysis) are locked behind the enterprise plan or an add-on.
Pricing
Mixpanel offers a Free plan that includes the core analytics features and allows tracking up to 1,000,000 events per month (suitable for small apps or trial use). However, you have to pay for any extra event you end up tracking. For example, you’d end up paying $5,250/year for 5M events, $10,080/year for 10M events, and so on.
Glassbox: Digital customer experience analytics platform
Best for: Medium-to-large enterprises in digital-heavy sectors like finance, insurance, retail, e-commerce, and travel.
Glassbox provides customer journey analytics and session replays, with an emphasis on capturing every user interaction in a secure, regulation-compliant way.

Main features
- “Tagless” data capture: Glassbox records 100% of interactions automatically (clicks, taps, scrolls, errors, API calls) with no manual tagging needed.
- Session replays: It generates high-fidelity replays of user sessions on websites or mobile apps (including rage clicks, struggles).
- Customer journey mapping: Glassbox visualizes aggregate journey maps to show common paths, drop-off points, and where users struggle in funnels. It can highlight points where customers abandon a process (e.g., loan application or checkout) so you can investigate why.
- Mobile analytics: It has robust SDKs for native mobile (like for React Native, Flutter, etc.), capturing screen recordings and UX metrics in mobile apps. It tracks things like app crashes, UI responsiveness, and network calls to help optimize mobile experiences.
- AI-powered insights: The platform includes automated anomaly detection, struggle detection like rage clicks, and even fraud detection.
Pros
- Very granular customer journey reports for analyzing user behavior at different stages.
- For mobile-heavy businesses, Glassbox’s mobile session replay and support are more robust than other alternatives.
Cons
- Its resource-intensive processes can lead to performance issues (e.g., slow query results or replay lags when dealing with very large data sets or long sessions).
- Steep learning curve for new users or non-technical folks. There are many features and filters in the interface, and not enough onboarding material.
- Like any enterprise-grade tool, the cost is only suitable for bigger companies and not for smaller startups.
Pricing
Glassbox has custom enterprise pricing based on your traffic volume, number of platforms, and specific needs (on-prem deployment, etc.). According to SpendFlo, costs can range between $10,000-$50,000 per year.
Posthog: Startup-friendly product analytics software
Best for: Engineers, product managers, and startups looking for an all-in-one, developer-centric platform that combines product analytics with session recording, feature flags, and experiments.
PostHog is an open-source analytics platform that offers a comprehensive suite of tools, including product analytics, session replay, feature flags, and A/B testing.

Main features
- Event tracking: PostHog allows tracking of user events across web and mobile, either via their snippets/ SDKs or by receiving events from other sources. The platform also automatically captures some events (needs some setup) and supports custom events.
- Behavioral reports: PostHog includes funnel analysis, trend analytics, user path analysis, and retention charts. And finally, correlation analysis to find which actions are correlated with a chosen outcome.
- Custom dashboards: PostHog lets you pin funnels, graphs, retention tables, etc., to build a shared view for your team. These dashboards update as data comes in and can be used to monitor experiments or core company metrics.
- Session replay: PostHog has added a session recording feature as well, meaning you can watch what users did in your app (similar to LogRocket/Hotjar).
Pros
- Since it’s open source, you can deploy PostHog on your own servers or cloud and keep all your product data in-house, which is great for privacy or compliance needs.
- PostHog packs a lot of features (analytics, session replay, feature flags, etc.) for a fraction of the cost of combining multiple SaaS tools. Especially if self-hosted or on the free cloud tier.
Cons
- While self-hosting PostHog can be powerful, it will be challenging to set up and scale. This means the freedom of self-hosting comes at the cost of engineering effort, which can be a con for small teams.
- PostHog’s UI is less polished than major commercial competitors. The navigation and UX can be a bit unintuitive initially.
- If not properly scaled, PostHog is susceptible to performance issues such as slow query times or delayed event ingestion.
Pricing
One big appeal of PostHog is that the open-source self-hosted version is free (you just cover your own server costs). For their Cloud service, they advertise a generous free tier and then a “ridiculously cheap” usage-based model that ranges around $0.00045 per event after the free limit (e.g., 10M events would only cost $343).
Hotjar: Visual analytics platform for product and marketing teams
Best for: Product teams, UX designers, marketers, and e-commerce businesses looking to improve website engagement, conversion rates, and user experience
Hotjar is a lightweight yet powerful tool focusing on visual insights into user behavior. It’s best for small to mid-sized teams, marketers, and designers optimizing website usability, landing pages, and product-led onboarding flows.

Main features
- Heatmaps: Hotjar automatically generates heatmaps for clicks, taps, and scrolls on your web pages.
- Session recordings: It also records user sessions, allowing you to play back individual user visits (mouse movements, clicks, scrolling) on your site.
- Conversion funnels: Hotjar has a feature to set up funnels and then tie them to session recordings. You can click on a funnel step drop-off, and Hotjar will show you recordings of users who dropped off at that step.
- Trends and behavior scores: Hotjar provides some trend tracking (e.g., daily/weekly trends in visits) and has introduced “frustration and engagement scores” that use algorithmic detection to rank recordings. For example, it might detect “rage clicks” or “u-turns” to identify frustrated sessions, and conversely identify highly engaged sessions.
Pros
- Hotjar’s visual tools can immediately show usability issues (e.g., if important buttons are being ignored or if users aren’t scrolling to key content).
- Hotjar is very easy to set up and also user-friendly.
Cons
- It’s not designed for in-depth product analytics or real-time data. There is a delay in processing recordings and heatmaps, plus, it doesn’t provide cohort analysis, long-term retention tracking, or advanced segmentation.
- Adding Hotjar’s script can have a slight performance impact on your site (it’s generally lightweight, but any extra script can add loading time). Also, recording sessions (especially on heavy pages) can use some of the user’s browser resources.
- Hotjar’s interface, while simple, can become cluttered if you have dozens of heatmaps or hundreds of recordings to sift through. There is some filtering, but finding that one insightful recording can be time-consuming.
Pricing
Hotjar has a Basic free plan (limited to 35 session recordings per day). Paid plans include Plus at $39/mo (100 recordings/day), Business at $99/mo (500 recordings/ day), and Scale at $213/mo for even larger needs.
LogRocket: Product performance analytics tool
Best for: Frontend developers, product managers, and UX researchers seeking to improve user experience through detailed session replays, performance monitoring, and error tracking.
LogRocket is a developer-centric tool that combines session replay with detailed error tracking and performance monitoring.

Main features
- Session replays: LogRocket’s flagship feature is its session recordings for both web and mobile apps. On top of user interactions, it also tracks underlying technical info such as console errors, JavaScript stack traces, and network requests.
- Autocapture: LogRocket automatically captures user interaction events and the state of the application. It records DOM changes, Redux store mutations (in React apps), form inputs, etc.
- AI error tracking: The platform tracks and lists all product issues in one dashboard, including JavaScript errors, network errors, error states, and so on.
- Heatmaps and clickmaps: Beyond individual replays, LogRocket automatically generates heatmaps, scroll maps, and click maps of your interface. These visual aggregations show where users tend to click, how far they scroll on pages, and what parts of the UI attract attention or get ignored.
Pros
- The technical info in the replays allows devs to debug issues. And with the AI error tracker, this process becomes even easier.
- LogRocket’s autocapture and reports allow you to compare quantitative data with visual insights from heatmaps and sessions.
Cons
- You can’t control which users to record beyond a couple of filters, so you might end up recording a lot of sessions and hitting limits quickly.
- By default, LogRocket stores recordings for a month on standard plans. If you want longer retention for analytics purposes (like year-over-year comparisons or long-term user journey analysis), you must pay extra.
- While LogRocket has added analytics features, it’s not as advanced in segmentation or deep analytics as other tools.
Pricing
LogRocket has a Free tier that includes a limit of 1,000 sessions. Paid plans are typically structured by the number of sessions you want to record and retain, starting with $69/month for 10k sessions/month ($139/mo for mobile).
FullStory: Customer behavioral analytics platform
Best for: Medium-to-large enterprises, e-commerce brands, and product-led software companies aiming to optimize user experience.
FullStory focuses on showing the “why” behind user actions by combining behavioral analytics with full session recordings.

Main features
- Visual tools: FullStory also provides heatmaps and session replays, which you can filter by user segments or timeframe.
- Tagless autocapture: FullStory captures all user interactions (clicks, form inputs, page visits, etc.) without manual event tagging. For example, if you forgot to track “PDF Download clicks”, FullStory likely has recorded them as generic clicks, and you can label those clicks on the “Download PDF” button retroactively.
- Frustration and friction signals: FullStory automatically detects “frustration signals” like “rage clicks”, “dead clicks”, “error clicks”, and excessive scrolling or back-and-forth navigation.
- Behavioral analytics: FullStory can produce journey maps that illustrate common paths users take, drop-offs, sequences, and branching of user flows through your product. You can also create funnels for sequences of events, analyze conversions, and track trends over time.
Pros
- FullStory offers a complete, retroactive view of everything users do on your product.
- You can easily share session replay links with colleagues, add comments, or tag teammates.
Cons
- FullStory has a steep learning curve when figuring out how to search, filter, and make sense of the mountain of data.
- FullStory can be resource-intensive when capturing lots of data.
- The cost can ramp up quickly as you increase session counts.
- It’s primarily oriented around sessions and events timeline, with behavioral data having a secondary role.
Pricing
FullStory historically has been on the higher end and quote-based for business and enterprise plans. According to Vendr data, these prices range between $9,843 and $105,352 per year, depending on your plan and the size of your business.
UXCam: Qualitative and quantitative data analytics platform for mobile apps
Best for: Mobile product teams and UX designers for its ability to uncover usability issues and optimize mobile experience.
UXCam is an app analytics platform that provides deep insights into how users engage with web/mobile apps, using visual tools like session replay and heatmaps.

Main features
- Screen analytics: UXCam offers detailed screen analytics, which show key metrics for each screen in your app (views, average time spent, drop-off rate, etc.). This helps identify which screens might be problematic.
- Session replay: The platform records users’ screen interactions and gestures so you can watch taps, swipes, and see where a user might have gotten frustrated.
- Heatmaps and touch visualizations: UXCam automatically generates heatmaps for mobile screens. It shows where users commonly tap, pinch, or perform gestures.
- Behavioral analytics: The platform includes funnel analysis to measure conversion through multi-step processes, as well as user journey flows (path analysis). It also provides retention analysis to track how well you retain users after certain events (like app install or feature use).
Pros
- It captures mobile-specific interactions (like gestures) and provides insights that generic web analytics might miss.
- Installation is straightforward, and the UI is friendly for product managers and designers.
Cons
- For teams needing a single solution for both web and mobile analytics, UXCam might not cover web analytics as comprehensively.
- UXCam is excellent for out-of-the-box analytics and UX insights, but it may lack some advanced features like built-in A/B testing or very advanced querying. Large companies that require custom analytics pipelines might need to export data from UXCam to other tools.
Pricing
UXCam offers a Free plan up to 3,000 sessions/month. Beyond that, it’s custom-priced, and the quote can be around $20,000/year based on Vendr data (which only includes 3 purchases).
Usermaven: Privacy-focused website analytics tool
Best for: SaaS companies, small-to-medium businesses (SMBs), product teams, and marketing agencies seeking a simple, no-code alternative to GA4.
Usermaven is a unified analytics platform that combines website analytics and product analytics, aiming to give a complete view of user acquisition through activation.

Main features
- Privacy-focused tracking: It’s cookieless by default (uses localStorage or fingerprinting in a privacy-compliant way) and doesn’t collect personal data unless you provide it, helping with GDPR/CCPA compliance. This means you can often run Usermaven without cookie consent banners.
- Auto event tracking: Usermaven automatically tracks common events (page views, clicks on buttons, etc.) via a lightweight JS snippet. It also captures UTM parameters and referral info for attribution.
- Product analytics: It offers feature usage tracking, funnels, and retention analysis. You can see which features are most used, build funnels for onboarding flows, and cohort retention charts to see how user engagement changes over time.
- AI-powered insights (Maven AI): Usermaven has an AI assistant that tries to surface trends and anomalies (for example, a sudden drop in conversion, or a user segment that’s highly engaged) to reduce manual analysis.
Pros
- Usermaven is very easy to implement and beginner-friendly for non-technical folks.
- The privacy-first approach and cookieless tracking mean no loss of data due to users opting out.
Cons
- Customization (like creating very complex cohort definitions or computed metrics) might be limited compared to other tools.
- Its event-based pricing means the costs are unpredictable and might end up very high if you manage high volumes.
- Session recording or qualitative analytics are absent.
Pricing
Usermaven has a simple event-based pricing. It can get as cheap as $12/month for only 100k events, $63/month for 1M, or even $173/month for 10M ($424/mo for the premium plan).
Datadog: User behavior and product performance monitoring platform
Best for: DevOps teams, IT operations, and engineering organizations operating in complex, dynamic, or hybrid cloud environments
Datadog is a cloud monitoring platform best used by DevOps and engineers to monitor infrastructure, application performance, logs, etc.
It has a module for Real User Monitoring (RUM), which extends its capabilities into the front-end/user experience domain, thereby covering product analytics aspects like user sessions, behaviors, and performance metrics in one place.

Main features
- User flow monitoring: Datadog RUM tracks user journeys through an application in real-time. It captures events like page loads, route changes, clicks, etc., and can visualize sessions to show the sequence of user actions.
- Session replay: Datadog includes session replay for web apps, with technical info like infrastructure logs and errors. It’s mainly used for debugging issues.
- Frontend event capture: It automatically captures frontend events like button clicks, link clicks, form submissions, errors, and even long tasks or network calls in the browser. It also collects these with context (browser info, user ID if provided, etc.).
- Endpoint and performance monitoring: You can tie in endpoint (API) monitoring and synthetic tests into user analytics. For example, Datadog can run synthetic user flows (like a scripted journey) to test that it works and alert on problems.
Pros
- It provides a single platform for both product analytics and system performance. You can look at the same dashboards and see user metrics alongside server CPU usage or error logs.
- Datadog excels in real-time monitoring and alerting. Such alerts can be routed to Slack, email, etc., letting you react to issues immediately.
Cons
- Datadog RUM is oriented around monitoring rather than deep product analytics. Its analysis of user behavior is relatively basic compared to specialized tools.
- The Datadog interface is powerful but can be incredibly complex and unintuitive for non-technical users.
- Costs scale with usage, which can be unpredictable. And if you want full visibility (RUM, APM, Logs, etc.), you might end up paying for several modules.
- You need devs to get the most from Datadog RUM.
Pricing
Datadog RUM is priced separately from the core infrastructure monitoring based on sessions. The RUM measure and investigate modules are rated at $0.15 and $3 per 1,000 sessions/month, and RUM with session replay at $2.50 per 1,000 sessions.
So if you have 100k sessions per month, that’s $315/month for RUM plus $250 with session replays (note this doesn’t include the cost of other modules).
Google Analytics: Web analytics platform
Best for: Digital marketers, website owners, e-commerce managers, and small-to-medium businesses seeking free, robust, and actionable data on user behavior.
Google Analytics 4 is an excellent free tool for understanding traffic patterns and basic user engagement. It’s widely used by all kinds of teams to track basic website and app performance data, which can then be integrated with other tools.
Main features
- Event-based model: In GA4, it auto-collects some events (like first visit, session start, etc.), and you can define custom ones.
- Reports and Explorations: GA4 provides standard reports on user acquisition (channels, campaigns), engagement (pages/screens views, user stickiness), monetization (if ecommerce or ads), and user retention. However, the Explorations feature lets you do ad-hoc analyses like funnels, path analysis, segment overlap, and cohorts.
- User properties and audiences: GA4 allows up to 25 custom user properties (like user type, plan, etc.), and you can create audiences based on behavior (which can be exported to Google Ads for retargeting, a big plus of GA).
- Integration with Firebase: For mobile apps, GA4 (via Firebase) can track app events and link them with web events for cross-platform analysis. You can also push notifications or remote config through Firebase based on analytics audiences.
- Privacy controls: GA4 can work with or without cookies (consent mode) and has IP anonymization by default, etc., to better align with privacy regulations.
Pros
- GA4 is mostly free unless you’re handling a lot of events. Making it a go-to platform that serves as a baseline.
- Most tools integrate with GA4, which means you can complement it with almost any other tool in this list.
Cons
- There’s a steeper learning curve to do advanced stuff in GA4 compared to its previous versions.
- It’s not tailored to product analytics like other dedicated tools. For example, event parameter analysis or funnel customization is a bit rigid, and you have limits on the number of conversion events, etc.
- Data retention on the free GA4 is capped to 2 months for user-level data, extendable to 14 months max. Meaning you can’t do very long-range analyses in the UI beyond that.
- Support is basically community-based (unless you pay for GA360), and there’s less ability to get custom help from Google.
Pricing
GA4 is free. You can send up to 10 million events per month per project, and have up to 100+ million users, etc., with no direct cost. For enterprise needs, the GA360 service is roughly $150,000 per year, which provides higher limits, unsampled reporting, longer data retention, and enterprise support.
Featured Recommendation: Userpilot: Product growth platform with analytics capabilities for both web and mobile applications
Best for: Product-led SaaS companies focused on improving user onboarding, increasing retention, and boosting feature adoption
Biased, I know. Although many people know Userpilot for our powerful user onboarding and in-app guidance features, our integrated analytics suite is equally robust.
Main features
- Autocapture: Automatically collects all product interaction events from day one without manual tagging, allowing us to instantly access event data for actionable dashboards and reports.
- Multi-channel analytics: Userpilot lets us track events from web, mobile apps, and email campaigns in one unified platform (no need to force-integrate email with product data).
- Behavioral analytics: Userpilot creates reports like funnels, trends, paths, and retention cohorts. I can add granular filters to compare behaviors across different segments, spot drop-off points, and sources of friction.

- Custom dashboards: The platform provides both templates and the ability to customize dashboards. These include key metrics for product growth like new user activation, conversion, retention, product usage, etc.
- Session replays: It can record user sessions so we can observe how users navigate and where they encounter friction. This lets us, for example, watch sessions of users who dropped off at a particular step to spot the exact issue. Plus, it can quickly filter sessions and skip the idle parts, which makes it less time-consuming than other tools.

- User and company profiles: Besides advanced segmentation, Userpilot also creates profiles of individual users and companies. This lets me, for example, focus on high-value accounts to prevent high revenue churn or follow account-based marketing strategies.
- In-app surveys: The platforms can design any type of survey (such as NPS, CSAT, CES).
The exciting news is that we are going to integrate AI into the platform, helping you make data-driven decisions even faster.
Our newest AI agent, Lia, works on top of these powerful features to quickly spot actionable insights. Think of summarizing data points, pointing out anomalies, analyzing customer sentiment, and providing strategic next actions. Right now, you can join the waitlist to use before its full launch (also stay on top of our upcoming releases).

Pros
- Userpilot’s no-code features are designed so anyone can learn how to use them without coding expertise.
- It offers an all-in-one suite of features combining analytics and engagement. You can get valuable usage insights (feature adoption, user behavior trends) and act on them immediately via in-app tooltips, modals, and surveys in one platform.
- Userpilot isn’t the cheapest tool in the market, but it’s the one product offering the most value for your money. It can comfortably cover all your product management needs without having to stitch together multiple (often more expensive) tools.
Cons
- Even though Userpilot is cost-effective, it’s not cheap. This product is meant for mid-level to upmarket SaaS companies that have the budget for a complete platform.
Pricing
Userpilot offers three pricing plans based on monthly active users (MAUs):
- Starter: This entry plan begins at $299/month (billed annually) for up to 2,000 MAUs. It includes in-app user engagement features, segmentation, trend analysis, NPS surveys, and essential product analytics. This plan is ideal for small and mid-market SaaS teams getting started.
- Growth: This is a custom plan with advanced analytics, event autocapture, resource centers, in-app surveys, email engagement, and session replay. It’s best for growing teams that need deeper insights and scalability.
- Enterprise: Tailored for large organizations, this plan includes all Growth features along with bulk data handling, premium integrations, SOC 2 Type 2 compliance, custom roles and permissions, and enterprise-level support.
How did we evaluate these tools?
Too many teams end up buying product analytics software that is either overkill for their maturity or too limited to drive real decisions. To avoid that trap, I evaluated each tool using a consistent set of criteria focused on real-world usability and ROI, not just feature checklists.
Using the following criteria, I shortlisted tools across different categories, from all-in-one product growth platforms to deep analytics suites and visual UX tools, so you can choose based on your goals, your team, and your stage, not hype.
Here’s what I looked at:
-
Ease of implementation: How quickly can a team get value after signup? I considered setup effort, such as manual event tracking versus autocapture, engineering dependency, documentation quality, and how usable the product is for non-technical roles like product managers, designers, and customer success teams.
-
Data depth and analytical power: Does the tool go beyond surface-level metrics? I evaluated how well each platform supports funnels, retention, paths, cohorts, and segmentation, as well as its ability to connect user behavior to outcomes like activation, churn, or conversion. Tools that combine quantitative data with qualitative context, such as session replays, scored higher.
-
Ability to act on insights: Insights are useless if they live only in dashboards. I looked at whether teams can act on the data by launching in-app guides, surveys, experiments, or alerts without stitching together multiple tools.
-
Price-to-value ratio: Instead of just listing prices, I evaluated what you actually get for the money. Many tools appear affordable at low usage but become expensive as event or session volume grows, especially when essential features like session replay or data exports are locked behind add-ons.
-
Best-fit use case: No tool is best for everyone. Each platform was assessed based on who it is truly built for, such as early-stage startups, product-led SaaS teams, mobile-first apps, or enterprise engineering organizations, so you can match the tool to your team’s reality.
Typical cost of product analytics tools
Expect to pay $300–$1,000/month for most product analytics tools, or $10k–$100k+/year at enterprise scale.
Most tools use event-based pricing (you pay per user interaction), which gets expensive fast. What looks cheap at 1M events can hit $10k/year at 10M events. The real killer is hidden fees. I’ve seen tools advertise low prices but lock session replays and advanced features behind expensive add-ons.
This is why I like Userpilot’s approach. Everything like analytics, session replays, and engagement tools is bundled into transparent pricing plans starting at $299/month.
How to select the right product analytics platform?
Choosing the right tool is a strategic decision that impacts everything from product roadmaps to customer satisfaction.
When my team evaluates tools, we follow a clear thought process:
What problem are we trying to solve?
We start by identifying the specific gap in our understanding or our workflow. Are we struggling with low activation rates, poor feature adoption, or high churn?
Each problem points to different analytical needs. For example, if we’re seeing high churn, we’d focus on tools with strong churn analytics and user paths to uncover root causes.
This will let us shortlist the products based on our primary use case. And once we have a list of candidates, then we can start evaluating and discarding tools in the following steps until we’re left with one option.
Who needs to use it?
Now, consider whether it’s just product managers who’ll use the tool, or if marketing, customer success, and even engineering teams also need access. This impacts the required ease of use and the number of licenses.
What I recommend is to think about the least technical person who’ll get access to the platform. If it’s just for a technical product manager and engineers, then you can get away with a deeper tool that requires SQL skills and coding.
But if, for example, you need an analytics tool that will be used by product managers, UX designers, and engineers, then a no-code platform like Userpilot will allow the designers to engage with data to improve usability.
What other tools does it need to work with?
Integration is key. We look at our existing stack-CRM, marketing automation, and data warehouses, and determine what seamless data flow looks like. Will the new tool integrate with our HubSpot analytics or push data to our Segment for broader use?
For this, I recommend looking into how specific your use case is. Do you only need a product analytics tool for session replays or heatmaps? Or do you want to centralize all data in an all-in-one platform to perform all analyses?
If the former, then sourcing the data from your warehouse could be enough. If the latter, then you’d probably need two-way integrations with your data warehouse, CRM, Google Analytics, and BI tools so you can transfer product data seamlessly between platforms.
What outcomes are important?
Focus on results, not just features. We think about what product KPI we want to improve, is it reducing time-to-value for new users? Or increasing engagement with a core feature? Defining these outcomes upfront helps us measure success accurately.
That said, you should evaluate each tool based on its capacity to:
- Follow your metric deeply (e.g., not just measuring retention, but creating user cohorts where you can correlate what actions lead to less churn).
- Improve your metric directly (e.g., implementing a checklist that leads users to activate a feature).
For example, if your goal is to improve product adoption, make sure to pick a platform that can both track product usage metrics (yes, like Userpilot) and give you tools to improve it, such as adding walkthroughs for onboarding.
How will it fit our organization?
Every company has unique workflows and methodologies. We assess how a new tool fits into our daily operations.
My advice is to leverage free trials and demos to see if:
- The tool performs well in your specific environment and doesn’t break.
- Your team can easily adopt it.
- There’s a clear path to positive ROI (e.g., if the tool helps you increase free-to-paid conversion rates).
- Integrations work as intended.
- The tool is going to be useful 2 years from now as the business grows.
This way, even if you shortlist two identical products, you’ll be able to make a purchase decision based on experience rather than promises.
FAQ
What is product analytics software?
At their core, product analytics tools are software platforms that collect, process, and analyze data about how users interact with a digital product or service.
They track every click, scroll, and action, translating these interactions into meaningful insights. Think of it as having a detailed map of every journey your users take within your app, showing where they go, where they linger, and where they get stuck.
What are the benefits of product analytics tools?
Product analytics tools offer clear, measurable benefits that empower us to make smart decisions.
- Enhanced user experience: These tools highlight areas of user friction, pinpointing where users get stuck or frustrated. By understanding these pain points, we can refine features and interfaces, leading to a more positive user experience. For instance, analyzing rage clicks or dead clicks can reveal usability issues we might otherwise miss.
- Data-driven decision making: Gone are the days of making choices based on assumptions. With solid data on customer behavior, we make strategic decisions rooted in evidence. This means less guessing and more effective planning for product enhancements. We base our feature prioritization on real usage, not just gut feelings.
- Increased user engagement: By analyzing which features users value most and how they interact with them, we can make targeted improvements that boost engagement and product stickiness. This might involve optimizing new feature onboarding or refining existing user flows.
- Improved product development: Analytics give us vital feedback on how new features are received. This insight guides our development process, ensuring we invest resources in enhancements that truly meet user needs and contribute to the product’s success. It helps us avoid feature bloat by building what truly matters.
- Competitive advantage: Using product analytics offers a complete understanding of market trends and user preferences that our competitors might not have. This allows us to build superior products that cater precisely to customer demands. For me, it’s about creating a product experience that stands out.
What are the must-have features of product analytics software?
At a minimum, a good product analytics tool should offer:
- A solid ability to track user actions (clicks, page views, etc.) across the product for end-to-end visibility. Autocaptured events are helpful, but you should also be able to instrument more complex, custom events.
- Behavioral reports, including funnel reports, path analysis, user cohorts, and trends.
- Centralized dashboards with customizable charts, date range filtering, and possibly alerts on significant changes.
- Integration with your data warehouse, as well as other platforms in your tech stack.
What are three tools for taking action on product analytics data?
Product analytics insights are only valuable if you act on them. And of all the products in this list, Userpilot is the only one with the tools to take action, including:
- In-app engagement features like tooltips, walkthroughs, modals, checklists, hotspots, and more.
- A/B testing for in-app experiences to optimize the performance of your onboarding flows.
- Self-service support via an in-app resource center.
What do product managers use product analytics tools for?
Product managers use these tools to:
- Learn how users interact with the product.
- Track product metrics and KPIs to achieve business objectives.
- Follow relevant changes in user behavior or metrics. This can indicate that a problem is happening.
- Prioritize features in the roadmap based on feature usage and customer feedback.
- Create reports and communicate with leadership about the results of a project.
About the author