13 Best Customer Success Tools in 2026 (for Startups to Enterprises)

Let’s review everything your customer success team has to do without any customer success tools: Collect customer data to calculate complex formulas for tracking metrics, monitor customer health scores, and resolve support tickets while continuously trying to improve retention and expansion.
With so much to accomplish manually, a lot slips through the cracks, leaving an unfulfilled gap in customer success management. That’s why CSM tools are built to help you manage all of the above and more proactively.
In this article, we’ll help you pick the right customer success program, covering aspects like:
- Tips for choosing the right customer success platform.
- Best customer success software for startups and small companies.
- Top customer success management platforms for mid-market and enterprise companies.
- Defining a customer success tool and other FAQs.
Best customer success software shortlist
|
Tool 🛠️ |
Pricing 💸 | Best for 🎯 | Main feature 🌟 |
Cons ⚠️ |
|
Gong.io |
Only available upon request | Call recording and sales conversation analysis | Call recording, AI transcription, sales pipeline visibility, coaching materials, and customer scoring. | Disappointing new features, occasional transcription inaccuracies. |
|
ChurnZero |
Est. $12,000/year | Retention analytics and churn prevention | Health scoring, segmentation, alerts, customer journeys, playbooks, and real-time monitoring. | Steep learning curve and setup complexity. |
|
HubSpot |
$100/mo/seat (Pro), $150/mo/seat (Enterprise) | Proactive customer service and churn minimization | Customer health scoring using AI, omnichannel messaging, personalized workspaces, CRM integration. | Only available in higher-tier plans. |
|
Gainsight |
Only available upon request | Behavior analysis and churn risk prediction | AI-driven predictions, playbooks, customer surveys, 360 dashboards, health scorecards. | Some features underdeveloped, dashboard limitations. |
|
Salesforce |
$25/user/mo (Starter), $100/user/mo (Plus), others on request | Centralized customer relationship management | Unified customer views, journey mapping, workflow automation, API management, case tools. | Expensive, steep learning curve, cluttered UI. |
|
ClientSuccess |
Est. $15,000/year | Customer journey management and engagement | Customer journey mapping, lifecycle tracking, onboarding automation, collaborative portals. | Limited forecasting and customization. |
|
ZapScale |
$500/mo (Startup), $2000/mo (Growth), Enterprise on request | Customer health scoring and retention tracking | Health analytics, custom triggers, data integration, prebuilt KPIs and dashboards. | No built-in customer feedback tools. |
|
Velaris |
Only available upon request | Data centralization and customer visibility | Surveys, health scoring, churn prediction, communication automation, customer sentiment tracking. | Learning curve; slower to use vs. other tools. |
|
SmartKarrot |
From $15,000/year | Customer engagement and expansion operations | AI insights, call sentiment, segmentation, alert rules, reporting dashboards. | Bugs and data inaccuracies, limited training content. |
|
Catalyst |
Only available upon request | Revenue retention and customer success automation | Real-time health profiles, integrations, playbooks, dashboards, automated follow-ups. | Weak data visualization; dashboard limits. |
|
Chorus |
From $8,000/year | Conversation intelligence and meeting analysis | Call recording, AI insights, speech-to-text, customer conversation analysis. | Call recording glitches, missing note-taker. |
|
Custify |
From $899/mo for 3 users | Customer management and journey mapping | Health scoring, automation, real-time alerts, in-app comms, analytics, journey mapping. | UI not very intuitive, delays in email/data, lacks deep analytics. |
|
Customerscore.io |
From $199/month | SMB SaaS teams that need proactive churn and upsell signals | Clear churn and upsell signals, automated playbooks and alerting, fast setup, affordable entry pricing | Not a full CRM or ticketing system, better suited for SMBs than large enterprise CS teams |
How to choose the right customer success platform
Selecting the right customer success software requires careful consideration to ensure it effectively addresses your team’s day-to-day operations and integrates well with your company’s existing tech stack.
Here are the six key steps to follow as a guide during your decision-making process:
- Identify difficulties & major time sinks: Pinpoint friction points in your current customer success process, such as communication gaps, data access issues, or time-consuming manual tasks, and assess their impact on productivity.
- Define improvement goals: Clearly articulate your goal, i.e., what you want to improve by leveraging customer success platforms. Examples could be streamlining communication or effectively tracking customer engagement to support your customer success efforts.
- Evaluate data hygiene & availability: Assess the quality of customer data you’ll be feeding into the platform. Ensure that your data is clean and easily accessible, as poor data quality undermines the value of even the best customer success tool.
- Consider specific features: Your goals and improvement areas will determine the features you need. For instance, trouble with manual tasks might require looking for tools that automate certain customer success operations.
- Assess integration capabilities: Make sure the platform can connect seamlessly with your current systems to provide a holistic view of support interactions without duplicating efforts. This also facilitates the smooth flow of data across platforms, ensuring easy access without any compatibility issues.
- Review scalability & adaptability: Lastly, pick a tool that can grow with your business and adapt to changing needs, allowing you to expand functionalities as your customer success strategy evolves. This will also give you the flexibility to implement customer feedback directly into your processes.
Common features of customer success tools
Each customer success team always requires some nonnegotiables in any new software.
To make the search easier while keeping these criteria in mind, here’s a list of all the essential features to look for when considering customer success software:
- Customer onboarding: Facilitate a seamless onboarding experience with behavior-based triggers, including interactive product tours, onboarding emails, ongoing customer education, support resources, and task management to guide them through initial setup and usage.
- Journey mapping & management: Visualize the customer journey to identify critical touchpoints and optimize your customer success strategy, ensuring a personalized service throughout their lifecycle.
- Flow automation: Simplify repetitive support processes by automating tasks like ticket routing and prioritization, proactive support, or collecting customer data. This frees up time for customer success managers to focus on more strategic tasks.
- Health scoring system: Create customizable health scorecards for tracking customer satisfaction, engagement, and other key metrics. This will allow teams to identify at-risk accounts and prioritize proactive outreach.
- Reports & analytics: Provide tailored analytics, dashboards, and reporting capabilities to track customer behavior, identify trends, and enable data-driven decision-making for continuous improvement.
- Security measures: Consider platforms with robust security measures, such as SOC 2, GDPR compliance, and any other certifications that prove they take data protection seriously. This isn’t just a nice-to-have, especially if you’re an enterprise. You’re dealing with sensitive customer data, and you need that ironclad assurance that it’s safe and compliant.
Best customer success management platforms for mid-market and enterprise companies
Here, we’ll highlight the best tools designed to meet the complex needs of larger organizations, focusing more on offering advanced features and seamless integrations to drive your business forward.
Gong.io
- Best for: Go-to-market teams, namely sales, campaign management, and customer success.
- G2 rating: 4.7 out of 5 stars
- Pricing: Only available upon request.
- Free trial: No
In the last few years, Gong.io has tried expanding by releasing some new features, such as Gong Engage, powered by AI. However, all those products/features were quite disappointing and met with harsh customer criticism.
Owing to this inability to pivot, Gong.io remains best known for its conversation intelligence, recording, and transcribing abilities. Only minor issues have come up in this regard, like inaccurate recording transcriptions at times.
Main features:
- Knowledge base and coaching materials.
- Video/call recording and analysis.
- Lead qualification.
- Customer scoring.
- Automated speech-to-text transcription.
- AI-note taking, insights, and searchability.
- Content and communication management.
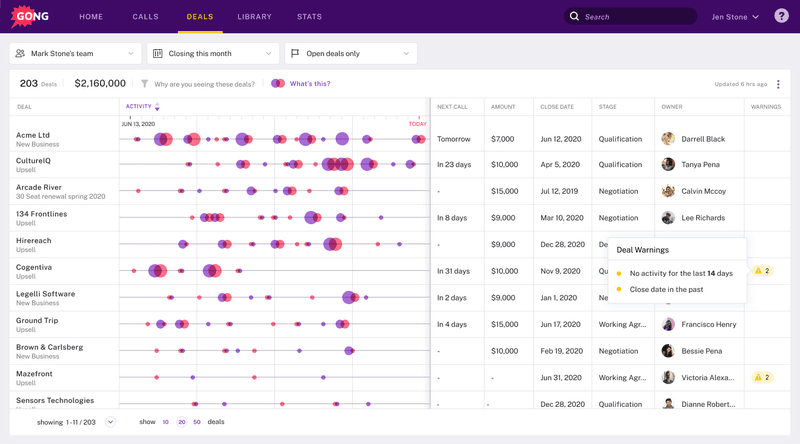
Gong’s dashboard provides easy visibility into the sales pipeline, helping to instantly find any gaps.
ChurnZero
- Best for: Customer retention and renewal analytics.
- G2 rating: 4.7 out of 5 stars
- Pricing: Only available upon request, but customer reviews suggest basic pricing starts at $12,000 per year.
- Free trial: No
The name is kind of self-explanatory – ChurnZero is designed to spot possible churn risks early, making it easier to deal with retention issues. It monitors usage statistics and up-to-the-minute insights to provide greater visibility into customers’ overall health and renewal chances for revenue growth.
However, despite the positives, the tool does come with a downside: an extremely steep learning curve encountered by the majority of customers. This makes it time-consuming to set up ChurnZero and “learn the language” for even the simplest of tasks.
Main features:
- Health scores and analytics.
- Customer monitoring, segmentation, and profiles.
- Real-time alerts.
- Customizable reporting dashboards.
- Customer journeys.
- In-app communications.
- Customer playbooks.
- Walkthroughs and surveys.
- API for seamless data integration.

ChurnZero enables you to report findings through multiple dashboards, making finding churn risks an easy task.
HubSpot
- Best for: Proactive customer service and minimizing customer churn.
- G2 rating: 4.4 out of 5 stars.
- Pricing: Professional plan from $100/month/seat, Enterprise plan from $150/month/seat.
- Free trial: No, but you can schedule a free demo.
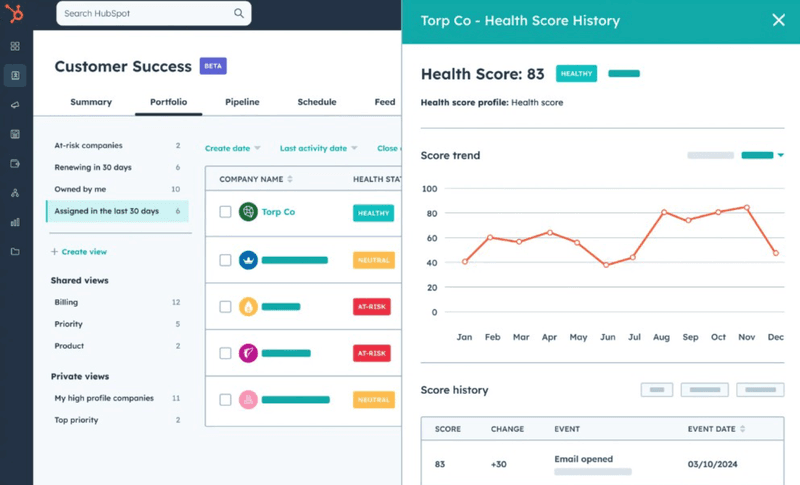
HubSpot’s customer success management software helps busy customer service teams provide excellent service experiences through an ample set of advanced features. The platform stands out through its Customer Health Score.
It leverages AI and Machine Learning to assess each customer’s satisfaction with your services and predict whether they will churn or continue sticking with your business, along with the key factors that might influence your customer’s perception about your company — perfect for proactive support.
Main features:
- 360-degree overview of your customers via its native Smart CRM integration.
- Customer health scores and health trends.
- Omni-channel messaging.
- Personalized workspaces.
- Customer portals.
It’s worth noting that the Customer Success platform is only available starting from the Service Hub’s Professional package, which may be out of reach for smaller businesses with limited budgets.
Gainsight
- Best for: Powerful 360 aggregation (from support tickets, customer queries, surveys, and notes to actual usage data).
- G2 rating: 4.5 out of 5 stars
- Pricing: Only available upon request.
- Free trial: A 15-day free trial is available.
Gainsight is a great customer success tool for aggregating data from various sources into a unified view. But its most notable functionality is that it allows users to leverage AI to analyze behaviors and predict future outcomes. This makes it easier for organizations to proactively manage customer relationships.
The thing with Gainsight is that while it offers a variety of features, not all of those features are entirely fleshed out as of yet. This leads to many customer concerns about the limitations of certain features, such as success plans or playbooks.
Main features:
- Customer health scorecards.
- 360-degree customer views with a centralized dashboard.
- Customer surveys and feedback.
- Customer playbooks.
- Churn risk predictions.
- AI-driven predictions based on customer behavior analytics.

Dashboard reporting is another one of Gainsight’s features that customers on G2 have reviewed as “limited in functionality.”
Salesforce
- Best for: Customer 360 vision.
- G2 rating: 4.5 out of 5 stars
- Pricing: Starter plan from $25/user/month, Plus plan from $100/user/month, and Enterprise and Unlimited plans available upon request.
- Free trial: A 30-day free trial is available.
Salesforce is a comprehensive platform designed to streamline customer interactions across various functions. It includes tools for sales automation, customer service, and marketing, making it easier for you to manage all aspects of customer engagement in one place.
While its flexible pricing model tries to accommodate businesses of all sizes, even enterprise accounts often find Salesforce too expensive for their budgets. Additionally, Salesforce is known to be difficult to learn and navigate due to its comprehensive features.
Main features:
- Unified view of customer interactions.
- Service Cloud, (tools for case management and real-time communications).
- Customizable dashboards and reporting.
- Workflow automation.
- Customer journey mapping.
- API lifecycle management.
- Customer health scorecards.
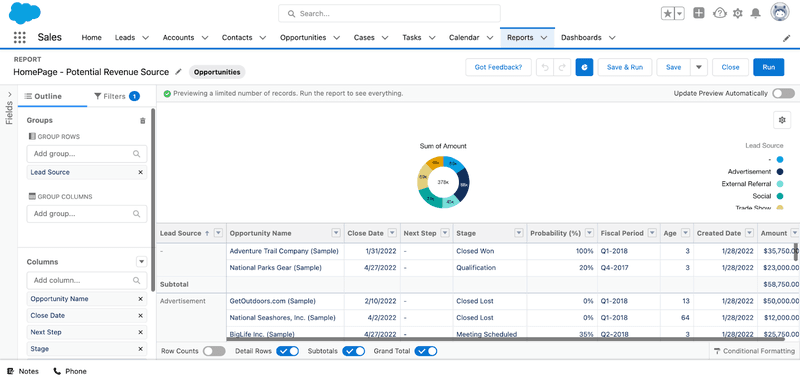
While Salesforce is a leading customer success platform, the vast features and tools often make it too complex for new users, with the UI sometimes cluttered.
Best customer success management platform for startups and small companies
When choosing a customer success management platform, startups and small companies need a solution that balances functionality, affordability, and scalability.
Because the tool should be able to adapt as your business grows. So, here’s a deep dive into the top tools equipped with all these traits:
ClientSuccess
- Best for: Customer journey and client success management through all four stages (onboarding, product adoption, subscription renewal, and growth).
- G2 rating: 4.4 out of 5 stars
- Pricing: Custom pricing and only available upon request, but customer reviews suggest basic pricing starts at $15,000 per year.
- Free trial: No
ClientSuccess specifically excels in customer journey tracking, mapping out the ideal path for customers to unlock value quickly. It enables proactive engagement by identifying customer touchpoints, allowing your support teams to build strong relationships and effectively reduce churn.
However, one drawback customers have pointed out is its point-in-time and change-state reporting for forecasting use, which still requires work.
Main features:
- Pre-built integrations with popular communication platforms.
- Customer lifecycle management.
- Automated customer onboarding process.
- Collaborative customer portals.
- Success plans to track projects and health scores.

Some customers review ClientSuccess as having missing key features, like a lack of customization options, especially in NPS surveys.
Zapscale
- Best for: Early-stage startups.
- G2 rating: 4.8 out of 5 stars
- Pricing: Startup plan at $500/month, Growth plan at $2000/month, and Enterprise plan available upon request.
- Free trial: No
Dedicated to “Slashing Churn, Scaling Retention, and Supercharging Upsell”, ZapScale aims to improve your customer understanding and streamline customer success team operations. Designed specifically for start-ups, with straightforward navigation, ZapScale has a short learning curve and avoids overwhelming complexity.
However, while it boasts numerous health analytics features, it does not offer any tool to gather feedback, i.e., NPS tracking, as of yet. This often leaves customers relying on other tools to collect customer feedback.
Main features:
- Customer 360 view, with customer segmentation, profiles, etc.
- Customer health scores and analytics.
- Custom triggers.
- Reporting and dashboards for outcome tracking.
- Integration with existing tools and data-cleaning support.
- Prebuilt KPIs, playbooks, email formats, etc.

ZapScale’s dashboard offers some useful views and charts to get an overview of your client’s health, so you can quickly start focusing on what matters.
Velaris
- Best for: Centralizing customer data into one interface.
- G2 rating: 4.7 out of 5 stars
- Pricing: Only available upon request.
- Free trial: No
Velaris is a great customer success software lauded for its intuitive tools for tracking customer interactions, monitoring health metrics, and managing renewals. The tool’s crowning achievement is that it helps remove support teams from their silos, ensuring easy data access with no need for cross-referencing.
While all the features are there, one drawback is the learning curve that comes with Velaris. Many users have reported spending more time to accomplish tasks, like automating a flow, in Velaris compared to the same action in other tools.
Main features:
- Health scoring, segmentation, customer profiles, etc.
- Surveys, including NPS functions.
- Automated client communications and workflows.
- Custom alerts and triggers.
- Reporting and dashboards to keep a real-time pulse on customer sentiment.
- Churn risk and upsell opportunities predictions.

Velaris allows you to manage your customers from one place, integrating all the different customer information from everywhere – emails, Slack messages, tickets, calls, and more.
SmartKarrot
- Best for: Handling customer growth and account management (expansion and retention) operations.
- G2 rating: 4.4 out of 5 stars
- Pricing: Basic plan at $15,000 per year; pricing for all other plans is only available upon request.
- Free trial: No
SmartKarrot centralizes various customer journey elements, like engagement, onboarding, and product adoption. However, its standout feature is the use of Augmented Intelligence. For example, SmartKarrot’s AI can uncover valuable insights like adoption trends proactively, helping teams focus their efforts more efficiently.
The only minor downside is the consistent bugs and data inaccuracies that keep popping up, but they are also quickly fixed.
Main features:
- AI-based features, like call sentiment analysis.
- Integrated customer data.
- Customer health scores and customer profiles.
- Dynamic customer segmentation.
- Early warning system with alert rules.
- Custom triggers.
- Reporting and dashboards.

While SmartKarrot’s UI is simple and easy to use, the lack of training content is something customers still struggle with.
Catalyst (recently acquired by Totango)
- Best for: Customer support teams looking to improve their revenue-generating strategies.
- G2 rating: 4.6 out of 5 stars
- Pricing: Only available upon request.
- Free trial: No
Catalyst is a customer success platform designed to enhance retention and revenue growth by providing a comprehensive view of your customers. It equips sales and success teams with effective playbooks and automation to support customers from onboarding through adoption.
Despite the many positives, Catalyst is lacking in the data visualization department. Specifically, many customer reviews suggest that dashboard creation capabilities, including limitations in developing dashboard charts, need to be refined.
Main features:
- Centralized view of all customer data.
- Build real-time health profiles.
- One-click integration with other popular tools.
- Playbooks and custom triggers.
- Custom dashboards.
- Customer journey builder and activity tracking.
- Automated follow-up tasks.

Many customers highly review Catalyst’s navigation UX, praising it for being user-friendly and straightforward.
Chorus
- Best for: A cheaper call/meeting transcription alternative to Gong.io.
- G2 rating: 4.5 out of 5 stars
- Pricing: Starting from $8,000 per year, with custom plans available upon request.
- Free trial: A 14-day free trial is available.
Chorus is an AI-driven Conversation Intelligence platform for helping sales teams prepare for difficult conversations by analyzing customer interactions across calls, meetings, and emails.
While primarily meant for sales, Chorus benefits customer success teams as well. It provides a comprehensive understanding of the sales process to better address customer problems and drive renewals.
Chorus sometimes encounters call issues and recording trouble. Several customer reviews mention glitches in which calls don’t get recorded or the automated note-taker doesn’t join in time.
Main features:
- Knowledge base and coaching materials.
- Playbook creation.
- Call/video recording and analytics for actionable insights.
- Lead qualification.
- Automatic speech-to-text transcription.
- AI-generated summaries of customer conversations.

Chorus’s meeting summaries free up your focus so you can concentrate on the call while saving time on call recaps.
Custify
- Best for: Customer management for startups & mid-market
- G2 rating: 4.6 out of 5 stars
- Pricing: While Custify’s detailed pricing is available upon request, sources indicate their plans start at $899 per month for 3 user seats.
- Free trial: No.
Custify is a customer success platform designed to help businesses, primarily small and mid-market B2B SaaS companies, manage and improve their customer relationships.
Despite the largely positive feedback, some recurring concerns for most users include:
- occasional delay in email delivery or data processing
- less intuitive or visually appealing interface compared to other platforms
- lack of advanced features, such as deeper analytics, enhanced customization options, etc.
Main features:
- Health score
- Automation playbooks
- Real-time alerts
- Customer journey mapping
- In-app communication
- Reporting and analytics

Customerscore.io
- Best for: SMB SaaS teams that need proactive churn and upsell signals
- G2 rating: 4.8 out of 5 stars
- Pricing: From $199/month,
- Trial: 2-month trial
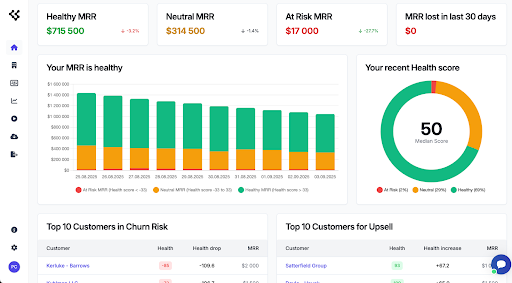
Customerscore.io helps B2B SaaS teams stay ahead of churn and spot upsell opportunities by monitoring product usage, customer behavior, and engagement signals in real time. It’s built for growth-stage companies that need fast insights and lightweight automation without implementing a full-blown CS suite.
The platform offers health scoring, automated playbooks, and smart alerts that notify teams when a customer is at risk or ready to expand. With integrations into CRMs, billing, support, and analytics tools, Customerscore.io fits easily into existing stacks.
Main features
- AI Health scoring
- Customer segmentation
- Automated playbooks
- Real-time alerts
- Multiple scoring profiles
- Reporting and analytics
- One click connectors for 3rd party platforms
Level up your customer success strategy!
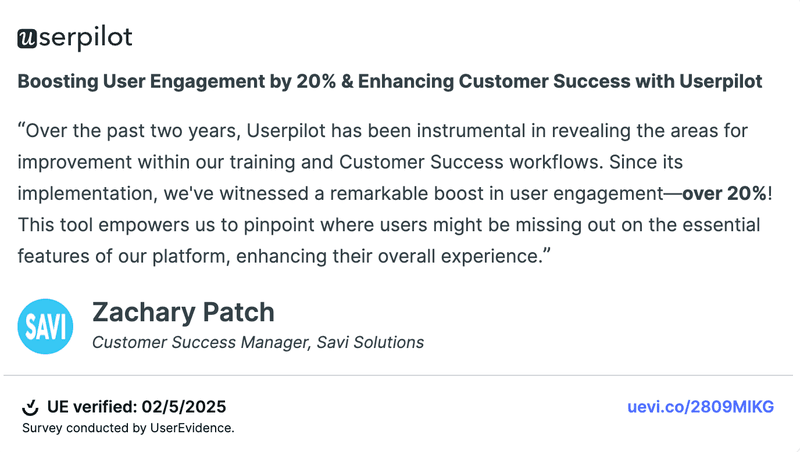
So, the bottom line? If you’re serious about boosting your customer success efforts, getting the right tools in your corner is a non-negotiable. It’s about understanding your users deeply so you can make impactful improvements.
And when we talk about impact, it’s not just theory. Take a look at the real results companies are seeing with the right tools:
FAQ
What is a customer success tool?
Customer success tools help businesses improve customer experiences by tracking user engagement, measuring satisfaction, and providing insights to drive retention. They often include features like analytics, onboarding support, and communication channels to ensure customers achieve their desired outcomes with your product.
What are the 4 pillars of customer success?
The four pillars of customer success are:
- Strong relationships: Build trust through effective onboarding and ongoing support.
- Customer centricity: Prioritize customer needs over profits, ensuring transparent communication.
- Value delivery: Help customers unlock the most value with your product so they can fulfill their specific goals.
- Customer advocacy: Actively listen and incorporate customer feedback into organizational practices.
Is Zendesk a customer success tool?
Yes, Zendesk is an all-in-one customer success management software that excels in customer support as well.
Its robust ticketing system, automation, knowledge base, and real-time chat are all features that enhance support efficiency. Whereas the customer engagement tools, satisfaction surveys, and analytics it offers are useful for improving customer experiences and managing relationships effectively, ultimately boosting customer success.
What are customer success KPIs?
Customer success KPIs are metrics used to measure the effectiveness of your customer success initiatives. Key KPIs include customer satisfaction scores, churn rate, Net Promoter Score (NPS), customer lifetime value (CLV), and renewal rates. All of these metrics help organizations gauge customer engagement and overall health.
About the author