Pendo vs Mixpanel: Which One Should You Buy?


Pendo and Mixpanel are two of the most commonly compared tools in the product analytics space, and with good reason. Both track user behavior across SaaS products, surface behavioral analytics, and have added session replay in recent years.
But they’re built on different assumptions about what product teams need to do after the data comes in. Mixpanel stops at the analysis, while Pendo adds a layer that lets teams respond directly to what the data shows within the product, so the model that fits your team depends on your workflow.
I’ve evaluated both tools across multiple product stacks, including firsthand experience with the split-analytics-plus-engagement model at a previous company. This guide covers each tool’s capabilities, honest limitations, how they compare on the decisions that matter, and what buyers often pay.

Do Mixpanel and Pendo solve the same product issues?
At the analytics layer, the overlap is substantial. After a script install, both serve as product analytics tools that automatically capture frontend user interactions and surface funnel analysis, path analysis, retention reporting, and behavioral analytics in real time. Session replay ships on both platforms, and both have expanded into AI-assisted querying over the last year.
But I’d say the main difference is how each tool handles such data. Mixpanel was built as a dedicated analytics tool and has been explicit about that choice, sunsetting its own messaging feature to stay focused on analytics.
On the other hand, Pendo demonstrates the assumption that the team reading the funnel data also needs to respond to it in-app, so the guide builder, resource center, and surveys are native to the same platform as the analytics.
The practical question for your buying decision is whether your team’s workflow ends when you understand user behavior or begins there. Mixpanel serves the first model; Pendo serves the second.
What is Mixpanel built to do?
Mixpanel is a product and digital analytics platform built to deliver robust product analytics for teams that need detailed behavioral analysis at the event level. The core reports (Insights, Funnels, Flows, and Retention) cover drop-off, feature engagement, user journeys, user cohorts, and retention cohorts.
Funnel analysis is its standout capability, with breakdown depth, comparative segmentation, and query-time property building that go beyond what most lightweight analytics tools offer.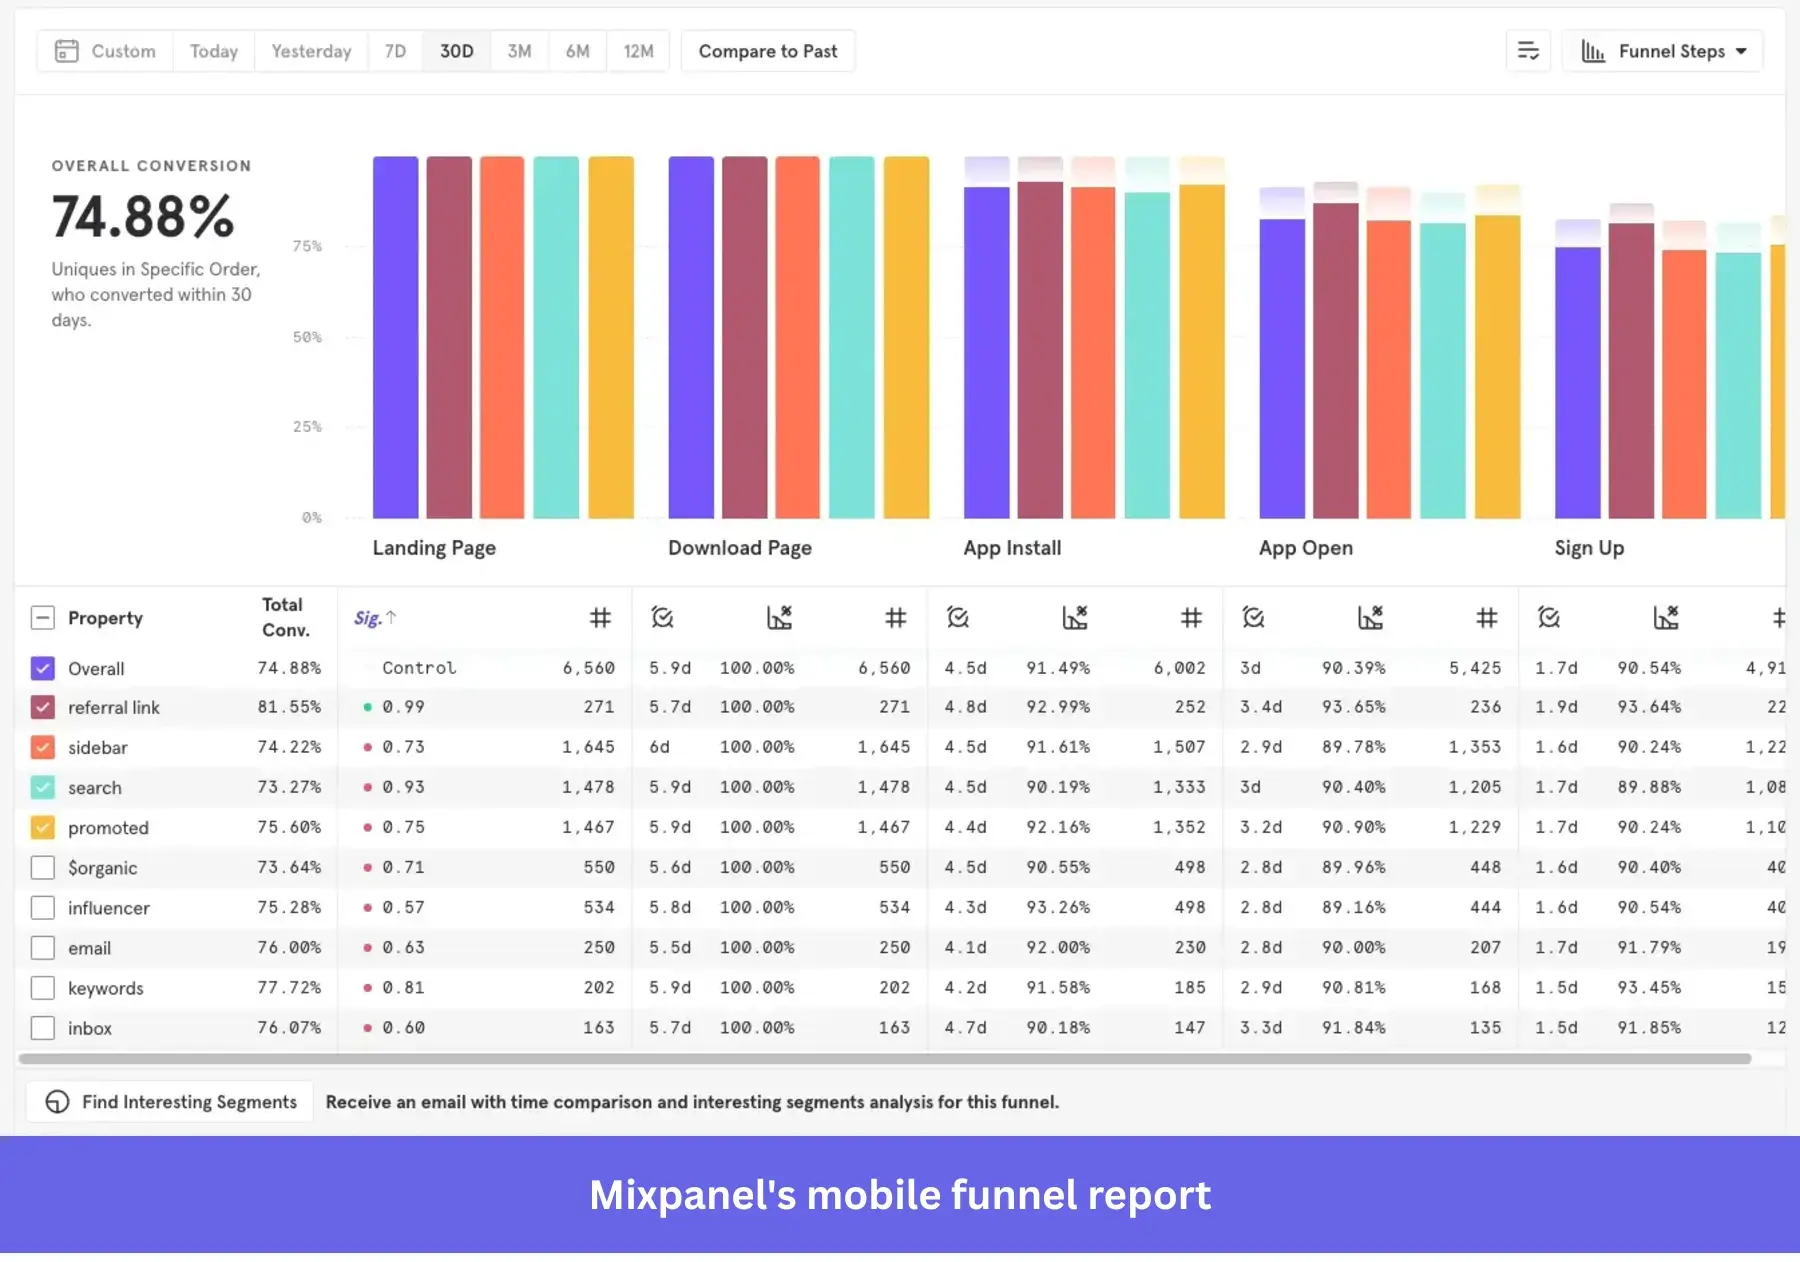
Mixpanel’s other capabilities include:
- Web autocapture via JavaScript SDK: Frontend user analytics and event tracking begin after install without manual tagging; mobile and server-side tracking require instrumentation via the iOS, Android, or server-side SDKs.
- Cross-platform session replay: Covers web, iOS, Android, and React Native, making it one of the few analytics tools with native replay across all major platforms.
- Automated monitoring via Alerts: Custom threshold alerts on Insights and Funnels reports, plus Enterprise Anomaly Detection that flags significant metric deviations and auto-generates a Root Cause Analysis board.
- AI layer: Spark for natural-language querying, Mixpanel AI Agent, an MCP server for external AI integrations, and Agentic Automations for connecting analytical signals to automated actions.
- Feature Flags and Experiments: Available as add-ons for teams running controlled rollouts alongside their analytics.
Some cons you should know while using Mixpanel:
- Initially, it has a steep learning curve, especially when setting up event tracking — a clean taxonomy requires upfront investment or reports get messy.
- Query load times can be slow on large datasets, and data governance takes ongoing effort to keep clean and organized.
- Complex analyses and A/B test setups are difficult to scale, and the insights you can pull are constrained by the quality and scope of your event data.
What is Pendo built to do?
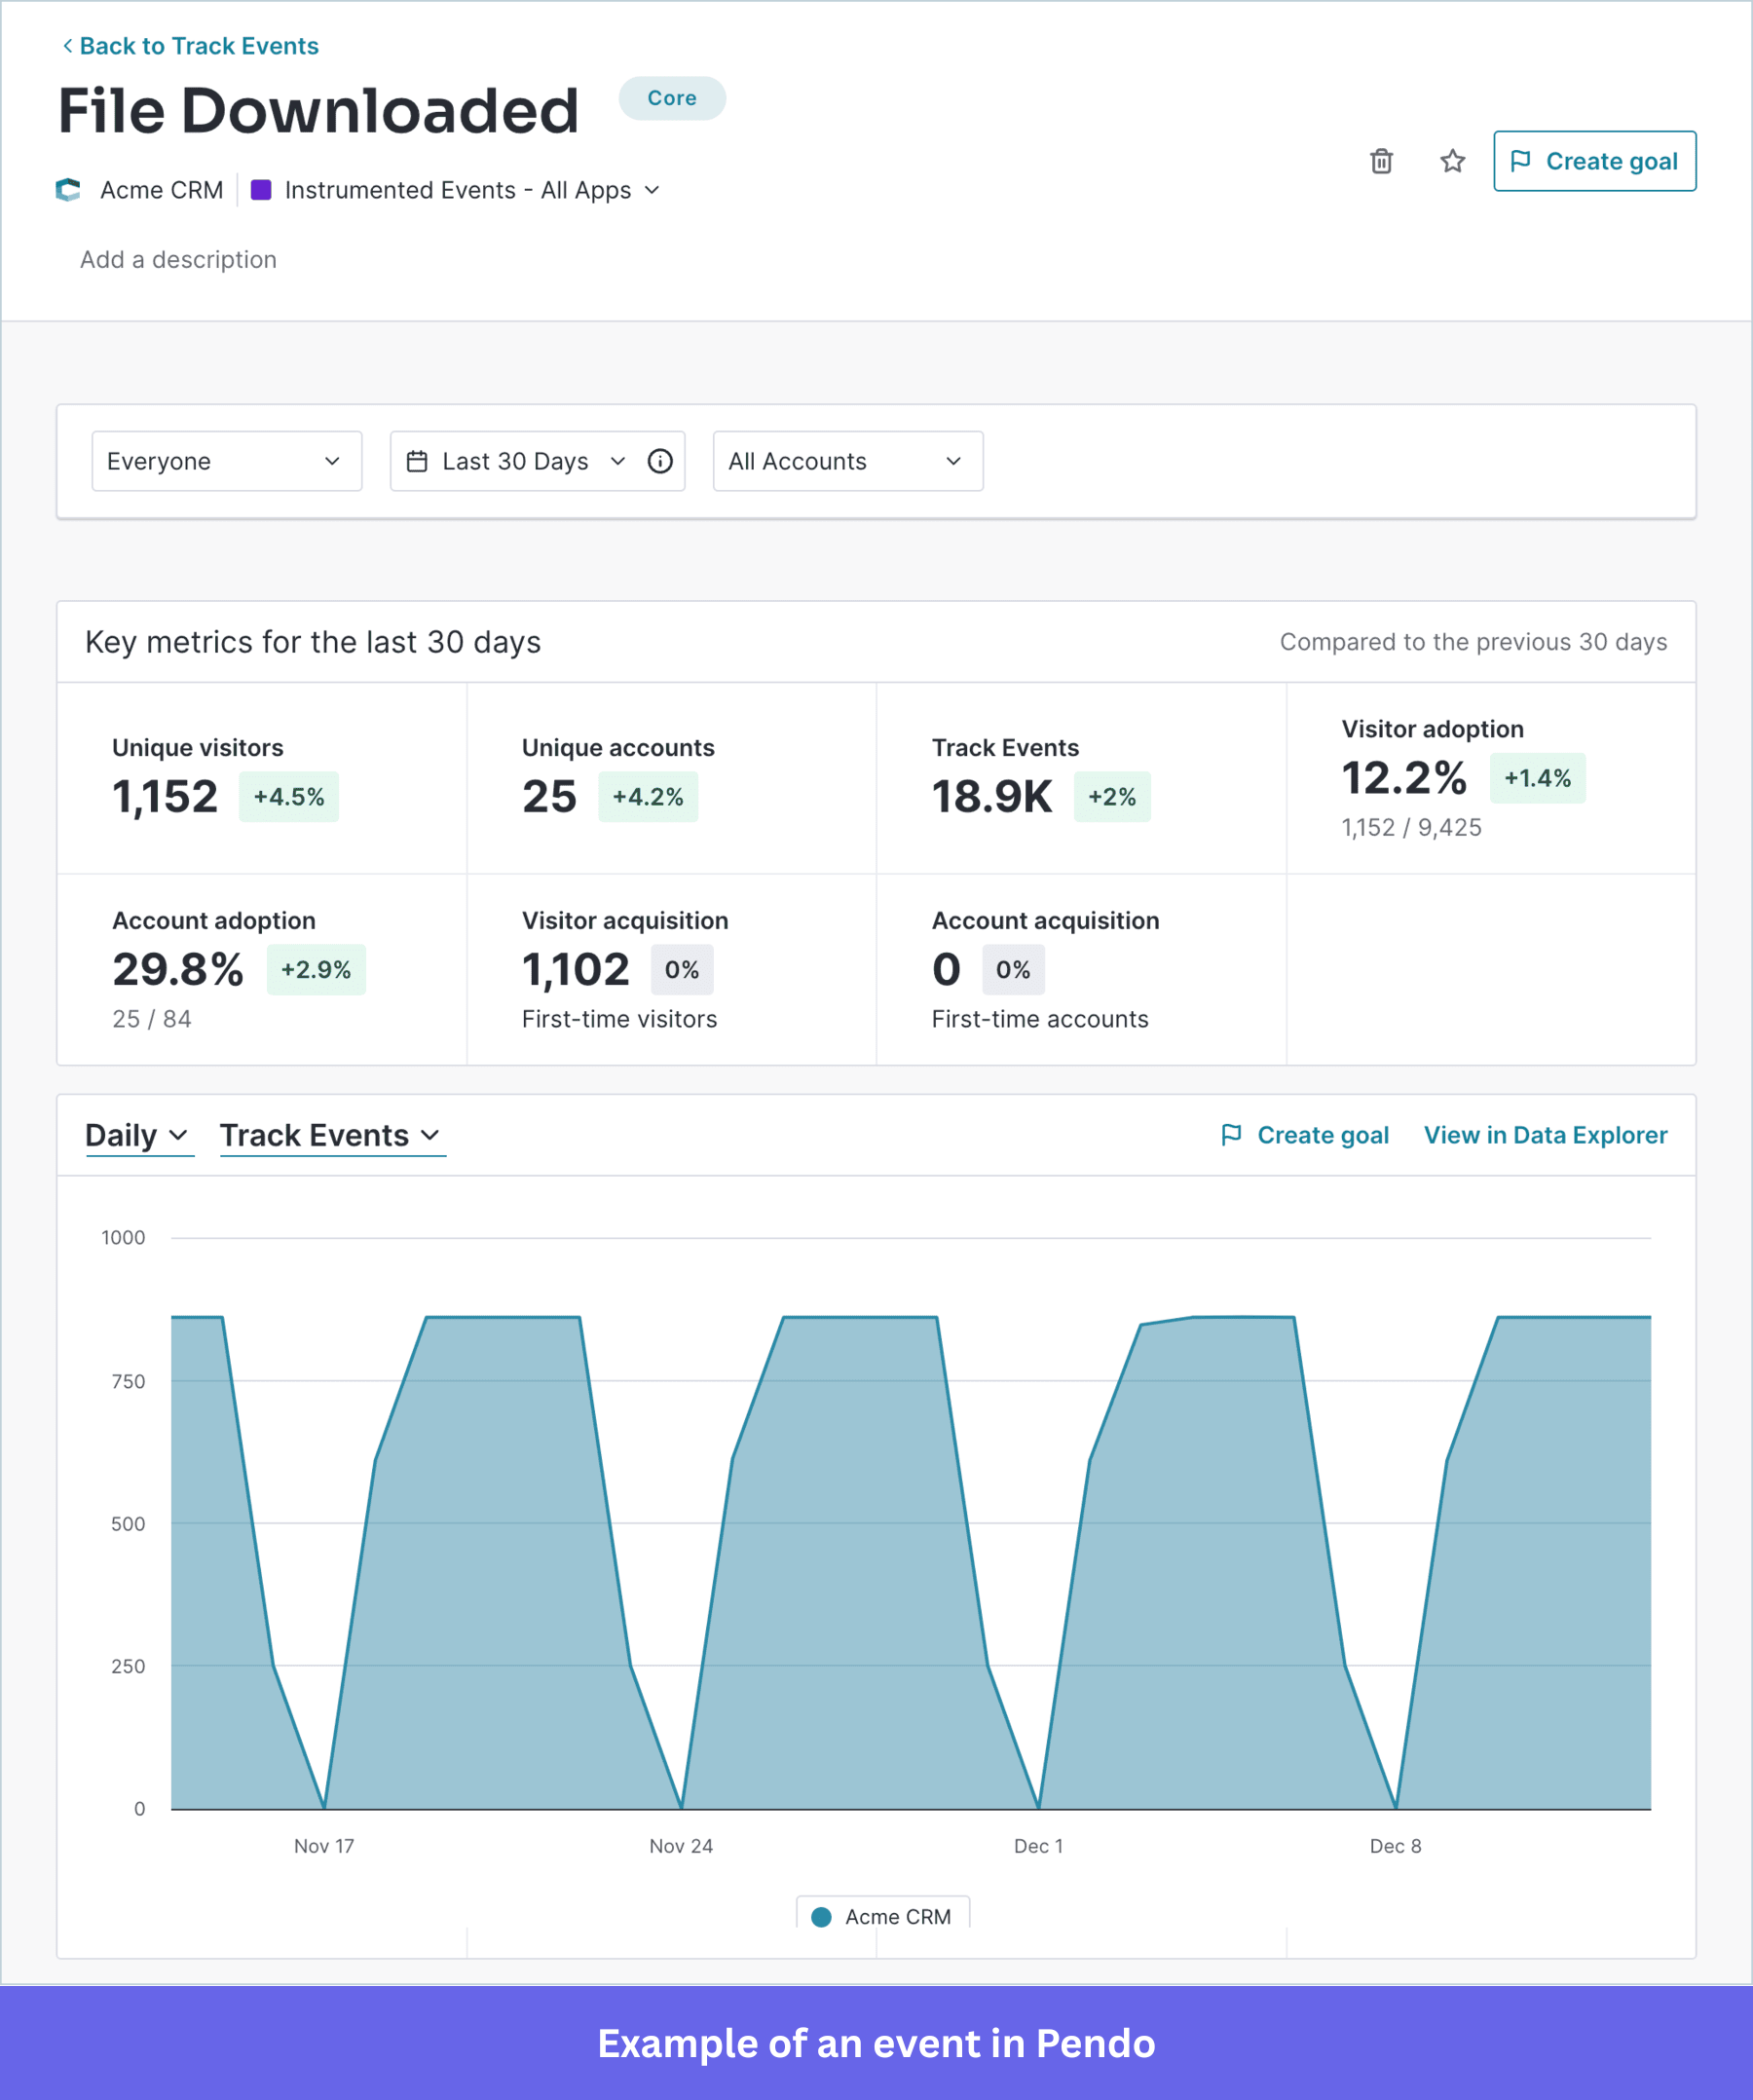
Pendo is a user analytics and product adoption platform that combines behavioral data with in-app response tooling. The analytics side covers funnels, path analysis, user journeys, retention, and behavioral segmentation, with autocapture that starts collecting events from script install.
That retroactive capture means you can query historical data from before you defined your event taxonomy, reducing upfront instrumentation work compared to tools that require predefined events.
- No-code guide builder: Lets you create onboarding flows, feature announcements, tooltips, and in-app walkthroughs without engineering involvement; guides move through lifecycle states (Draft, Pending Review, Staged, Public, Scheduled, Inactive) with filtering, categorization, and CSV export.
- Feedback collection suite: Resource centers, NPS surveys, and Sentiment are built into the same platform as the analytics, with targeting driven by the same segment definitions as the analytics layer.
- Session Replay: Unlimited volume, web-only, DOM-event reconstruction with client-side masking of sensitive inputs; default 30-day storage, extending to 90 days on higher-tier plans and one year for saved clips.
- AI layer: Leo for natural-language data exploration (included on all plans, using Google and OpenAI models with PII excluded from external systems), Agent Analytics add-on for measuring how users and AI agents interact with your product, and an MCP server for connecting Pendo data to external AI tools.
- 85+ integrations: Covers CRM, support team workflows, marketing automation, and analytics tools.
Some limitations that show up in implementing Pendo:
- Tag and segment management requires a governance structure as implementations grow — without one, the tag library becomes difficult to navigate.
- The Resource Center takes significant time to configure and is often still a work in progress well after initial setup.
- The system can be difficult to navigate and prone to breaking when changes to the underlying app affect element targeting.
How is Pendo different from Mixpanel?
The most meaningful difference is in the model each tool assumes about what product teams need after the data. Mixpanel treats everything downstream of the analytics as out of scope. Pendo assumes that the same team analyzing the funnel also needs to respond to it inside the app, and it builds that response capability into the same platform.
Mixpanel prices by event volume and publishes its Growth plan pricing publicly, with self-serve entry via a free tier. Pendo prices by MAUs and chosen functionality modules; every paid plan is quote-based with no published list pricing, which means even a basic evaluation involves a sales conversation.
The table below covers the six areas where your choice most often depends.
| Factor | Pendo | Mixpanel | Who leads and why |
|---|---|---|---|
| Analytics depth | Funnels, paths, retention, PES composite metric, retroactive autocapture, Data Explorer | Insights, Funnels, Flows, Retention, custom formula properties, query-time segmentation | Mixpanel, because event-level flexibility and query-time customization go further for teams with a structured event schema |
| In-app guidance | Native: guides, checklists, tooltips, modals, resource centers, NPS, Sentiment | Not native; requires a third-party integration | Pendo, because Mixpanel has no guidance layer |
| Session replay | Unlimited volume, web only, DOM reconstruction, 30-day default storage | Volume-capped (10K–20K/mo by plan), web + iOS + Android + React Native, 30-day default | Mixpanel for cross-platform products; Pendo for unlimited web volume |
| Pricing model | MAU-based, quote-only on all paid plans, no self-serve entry | Event-based, self-serve on Free and Growth, transparent pricing page | Mixpanel due to its transparent entry; Pendo requires a sales conversation for any paid plan |
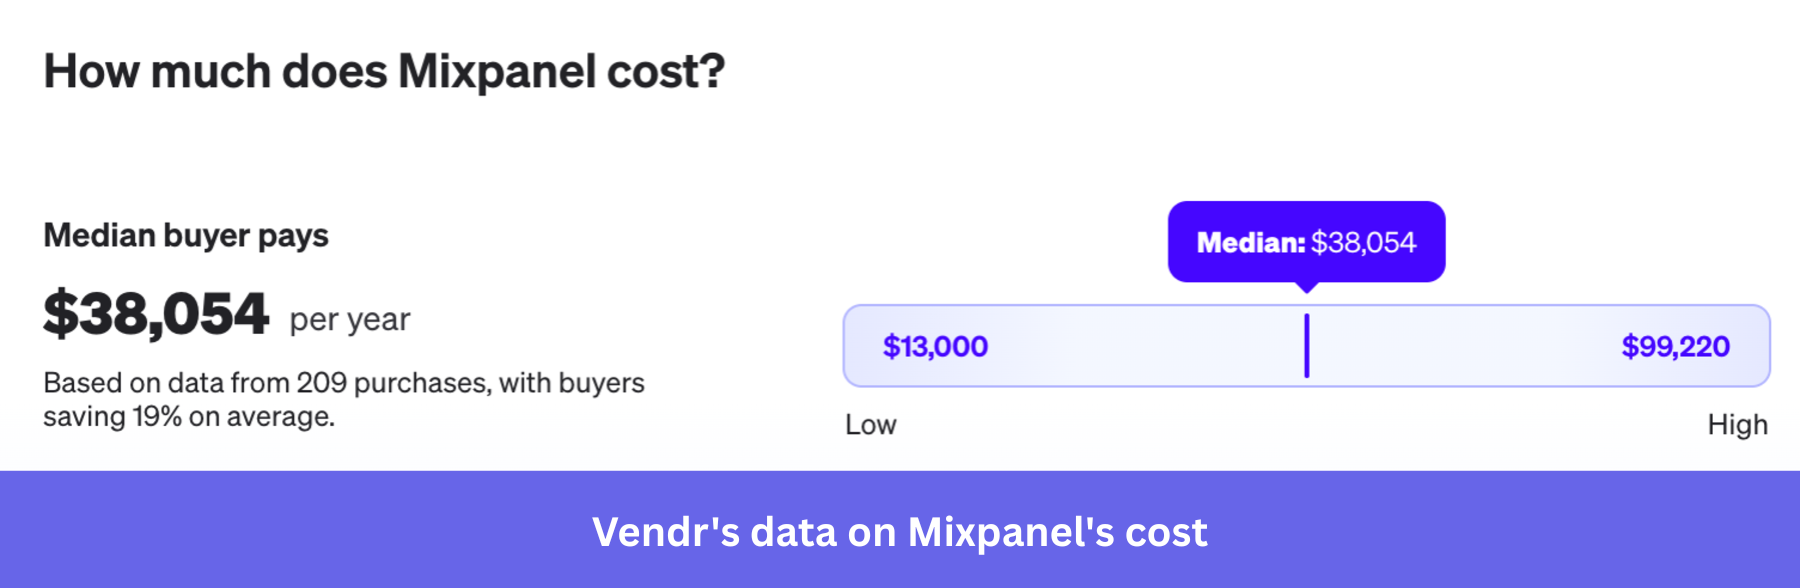
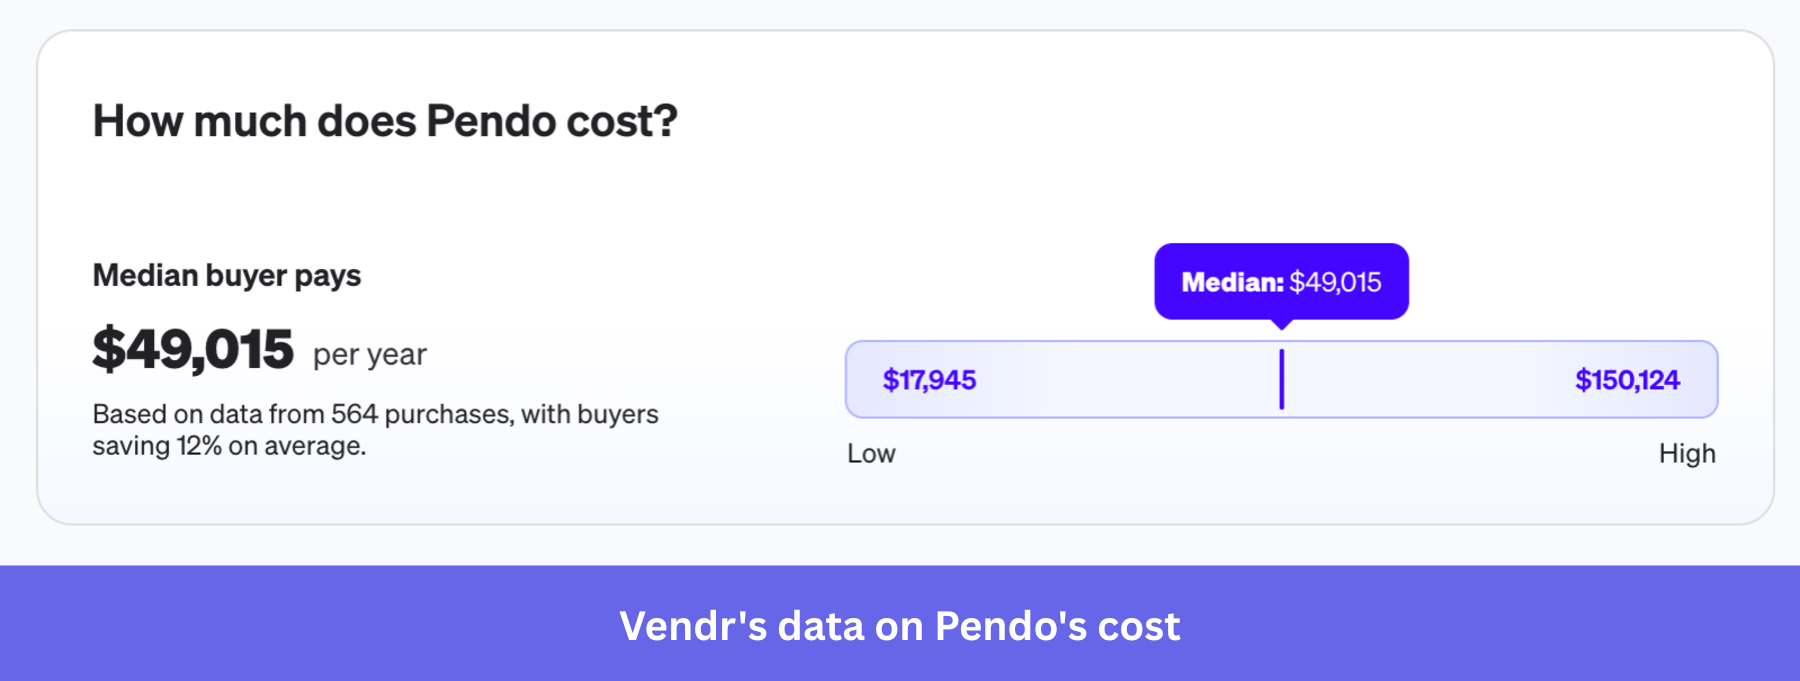
| Typical contract cost | Vendr median $49,015/yr (range $17,945–$150,124) | Vendr median $38,194/yr (range $13,350–$99,055) | Mixpanel is cheaper at the median; Pendo’s ceiling runs roughly $48k above Mixpanel’s |
| AI capabilities | Leo on all plans (natural-language querying), Agent Analytics add-on, MCP server | Spark AI (30–300 queries/mo by plan), Mixpanel AI Agent, MCP server, Agentic Automations | Different orientations, such as Agent Analytics and Agentic Automations, have no equivalent on the other side |
💡 Just so you know, you have another option!
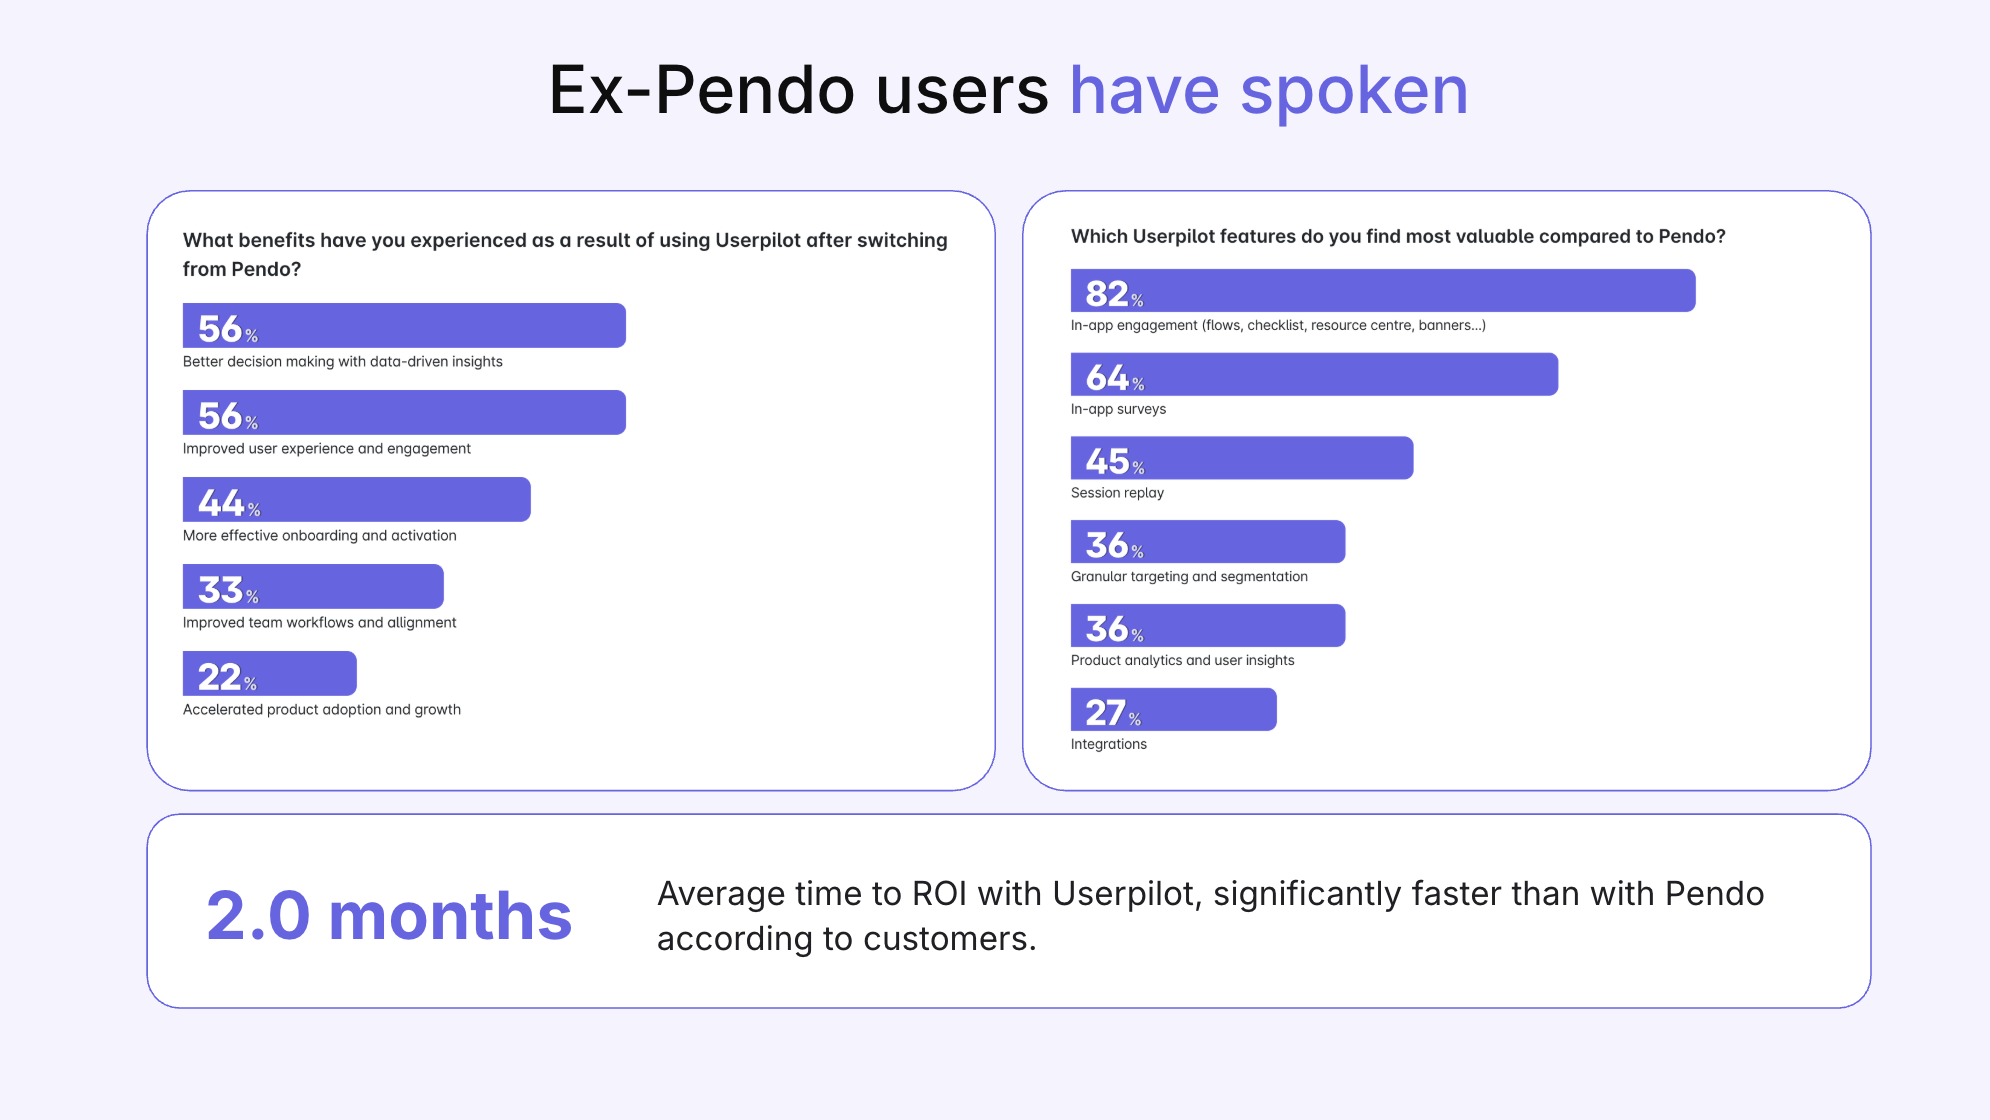
Before you pick a side here, it’s worth knowing you might not have to. At Userpilot, we run the analytics and the in-app response on the same event data, so you get funnels, paths, and retention alongside guides, checklists, and NPS without stitching two tools together or reconciling two event schemas the way a Mixpanel-plus-Pendo setup asks you to.
Teams tend to feel that in the timeline. The ex-Pendo switchers we surveyed averaged two months to ROI, and customers like Cuvama found better value and usability after moving off Pendo, with Shelterluv making the same switch for ease of use.
Choose Pendo if
Your product team needs to move from analytics insight to in-app response without engineering tickets. When users drop at a step in a funnel, the ability to build no-code tooltips or checklists that address those friction points from within the same platform removes a sprint from the loop.
Pendo also fits teams where setup friction is the main constraint. Retroactive autocapture means you can query historical behavior from day one without pre-defining an event taxonomy, and PES gives a single product-health metric without custom formula work.
For enterprise clients managing a large guide inventory, the lifecycle states, staging environments, scheduling controls, and CSV export infrastructure reduce coordination costs among product, customer success, and engineering. Pendo’s Agent Analytics add-on is also worth evaluating for teams building AI features who need to measure how agents behave inside their product.
Choose Mixpanel if
Your team has a data analyst or engineer who will own event instrumentation and build out a structured event schema, as Mixpanel’s analytical depth requires technical resources upfront but pays off once that instrumentation is in place.
The query-time property building, Flows analysis, and comparative segmentation surface product insights that go further than Pendo’s analytics reports, which is why Mixpanel is a common choice for data-driven product and marketing teams. The self-serve entry and transparent event-based pricing make it a better starting point for teams that want to measure without a procurement conversation.
Cross-platform SaaS products are a strong fit for Mixpanel, particularly when engineering resources are already allocated to mobile instrumentation. Session replay coverage on iOS, Android, and React Native is native; Pendo’s replay is web-only.
Teams running large-scale event monitoring benefit from the Enterprise Anomaly Detection system, which automatically flags statistically significant metric deviations and generates a Root Cause Analysis breakdown without requiring manual threshold configuration for each metric.
How do their AI capabilities compare?
Both tools ship a natural-language query assistant, an MCP server for connecting product data to external AI clients, and an automation or agentic layer.
Pendo’s Leo is included on every plan and uses Google and OpenAI models, with PII excluded from what’s sent to external systems. Mixpanel’s Spark runs on 30, 60, or 300 monthly queries depending on plan tier, with the broader AI Agent and Agentic Automations available across paid plans.
Pendo’s Agent Analytics add-on tracks how users and AI agents interact with your product: prompts, usage patterns, confusion points, and failure modes for AI agents running inside your product.
Mixpanel’s Agentic Automations layer connects analytical signals to automated actions, which is a use case Pendo doesn’t address natively.
So I wouldn’t call either one the AI winner. Pendo makes more sense if you’re monitoring AI-agent behavior inside your product; Mixpanel if you want to automate workflows based on event data.
How much do Mixpanel and Pendo cost?
Mixpanel wins on pricing if you primarily need product analytics. It gives you a more generous free tier, transparent self-serve pricing as you scale, and a lower median annual contract.
Pendo costs more and is harder to budget for, but that gap is easier to justify if you’d otherwise pay for a separate tool for in-app guides, NPS, and product adoption.
Mixpanel pricing
Mixpanel has three pricing plans.
- Free is the entry point for small teams and includes 1 million monthly events, core reports, 10,000 session replays, and 30 Spark AI queries (no credit card required).
- Growth is self-serve and usage-based: roughly $0.00028 per event above the first free million, with replay volume increasing to 20,000 per month.
- Enterprise is sales-led; a legacy MTU-based Enterprise plan starting around $20,000 per year is still available but is not sold online.
Mixpanel’s default event-data retention is two years, and identity merge operations don’t count toward your billed event total. Vendr buyer data puts the median annual Mixpanel contract at $38,194, with a range of $13,350 to $99,055.
Pendo pricing
Pendo does have a Free plan, but it’s capped at 500 MAUs. You get Product Analytics, In-app Guides, and Pendo-branded NPS; cross that limit, though, and you can’t create new guides, surveys, or segments until you upgrade.
From there, pricing gets less transparent. Base, Core, and Ultimate are all quote-based, with costs depending on your MAUs and the modules you need. Session Replay, for example, costs extra on Base but is included in Core and Ultimate. There’s also a separate 30-day trial if you want to test the full platform rather than the limited Free plan.
For a rough sense of what that costs in practice, Vendr puts the median annual Pendo contract at $49,015, with deals ranging from $17,945 to $150,124. That’s roughly $11,000 more per year than Mixpanel at the median, with the gap widening at the high end. But if you’d need to pair Mixpanel with a separate in-app adoption tool, the total cost can end up much closer.
Mixpanel, Pendo, or a better alternative?
If you’re mainly after product analytics and don’t mind connecting other tools for in-app engagement and support, I’d go with Mixpanel. It gives you a stronger analytics layer at a lower contract cost. If you want to act on those insights with in-app guidance without relying on engineering, Pendo makes more sense.
But I’d also consider whether you want to split analytics and engagement across tools in the first place. That’s what Userpilot is for. You get product analytics, in-app guidance, session replay, and NPS in one platform, so the same event data you analyze can also trigger the experiences you build. It also sits below Pendo’s median contract cost while covering the in-app engagement layer you’d need to add separately to Mixpanel.
Book a demo to see how that analytics-to-guidance workflow works before committing to either tool.
Disclaimer: Userpilot strives to provide accurate information to help businesses determine the best solution for their particular needs. Due to the dynamic nature of the industry, the features offered by Userpilot and others often change over time. The statements made in this article are accurate to the best of Userpilot’s knowledge as of its publication/most recent update on July 6, 2026.
FAQ
Is Mixpanel better than Pendo?
Mixpanel offers deeper, more flexible event analytics and costs less at the median contract value. Pendo combines analytics with a native in-app guidance layer that Mixpanel doesn’t offer. For pure analytics use cases, Mixpanel has the edge. However, for teams that need to both measure and respond to in-app user behavior, Pendo’s integrated model addresses a gap that Mixpanel leaves open by design.
What's the main difference between Mixpanel and Pendo?
Mixpanel is a dedicated product analytics platform, distinct from web analytics tools like Google Analytics in that it tracks feature-level user behavior inside the product. Pendo adds an in-app adoption layer (guides, resource centers, surveys, NPS) to the same analytics core, with user feedback collection built into the same platform as the behavioral data. Teams that need in-app guidance alongside Mixpanel analytics need to integrate a separate tool.
Can I use Mixpanel and Pendo together?
Yes, with Mixpanel handling event analytics and Pendo handling in-app guidance. Your main consideration should be event schema alignment, as both platforms track user behavior, and if those event definitions diverge, you end up with two data sources that disagree on the same metrics. If you’re running this combination, define a shared event taxonomy upfront and decide which tool is the authoritative source for any metric that appears in both.
Does Mixpanel have in-app messaging?
No. Mixpanel built and then deliberately sunsetted its Messages and Experiments feature to focus on product analytics. In-app messaging, onboarding guides, tooltips, and surveys are outside Mixpanel’s scope by design. Teams that need in-app guidance alongside Mixpanel analytics must integrate a separate tool, such as Userpilot, Pendo, or Appcues.
About the author