What is data-driven analytics in SaaS? Why is it important? How to conduct user data analysis? What are the best analytics tools for the job?
We answer these questions in the article, so if you’re looking for answers, you’re in the right place!
Let’s get to it!
Try Userpilot Now
See Why 1,000+ Teams Choose Userpilot

Overview of data-driven analytics
- Data-driven analytics describes the process of collecting, analyzing, and interpreting customer data to help organizations make better-informed product and strategic business decisions.
- By understanding how users behave inside the product and their goals and problems, you can reduce time to value. This improves customer satisfaction and retention.
- Data-led analytics help also identify user pain points and nip them in the bud before they escalate for a better customer experience.
- Start implementing data-driven decision-making at your SaaS by setting clear goals as this is essential to choose the right analytics tools and methods.
- Common analytics methods include descriptive, diagnostic, predictive, and prescriptive analytics.
- Data collection comes next. This includes tracking customer behavior from all stages of the customer journey and product usage data.
- In-app surveys are the most reliable way to collect user sentiment feedback.
- Data visualization, for example in a dashboard, aids in its interpretation and trend tracking.
- Next, use the insights to form hypotheses and test solutions iteratively.
- No-code tools like Userpilot, Pendo, and Hotjar enable teams to leverage data-driven analytics with help from a data analyst.
- To find out more about Userpilot analytics and how to use them to promote a data culture in your SaaS, book the demo!
Why is adopting data-driven analytics essential for scaling a SaaS product?
Which type of analytics helps you answer the specific question: “Why did this happen?”
After visualizing your data and identifying a friction point, what is the recommended next step?
Make smarter product decisions with Userpilot.
Collect behavior data, visualize trends, and test solutions—all without code.
What is data-driven analytics?
In SaaS, data-driven analytics involves collecting, analyzing, and interpreting user behavior and feedback data to evaluate product performance and gather actionable insights to inform product decisions.
Why is data-driven analytics important for SaaS companies?
How exactly can you leverage data-driven analytics?
Increase user retention
Using data analytics in the decision-making process enables teams to increase user retention.
Let me give you an example:
A product team can leverage user behavior analytics to identify the most optimal route to activation.
Such insights help them design an onboarding process that enables users to experience the product value in less time and with less effort. Once users see how the product solves their problems, they’re more likely to stick around.
Improve customer experience with a proactive approach
Data-led analytics helps organizations increase user retention also by proactively improving customer experience.
By analyzing behavior trends among churned users, you can identify aspects of the product experience that lead to increased user drop-offs. For instance, you may be able to identify usability issues that cause friction and prevent users from achieving their goals.
Once you’re aware of user pain points, you can address them, for example, by redesigning your UI, providing self-serve support, or contextually triggering UI patterns that help users overcome the roadblocks.
Improve data-driven decision-making
Data-driven analytics enable product managers, marketers, UI/UX designers, and customer success managers to make informed product and business decisions.
Think about it:
If you can’t base your decisions on empirical evidence, you’re forced to rely on hunches or previous experience. While intuition is important, the consequences can be dire if it fails you at a critical moment. And what has worked in the past may not work anymore, or not apply to current circumstances.
In data-driven companies, this risk is considerably lower.
For example, analyzing product usage can help teams identify features that users find most valuable.
Such insights can help teams prioritize future product initiatives and reduce the risk of developing features that nobody wants, while marketing teams can use them to design campaigns that truly resonate with the target audience.
Having a data-driven culture isn’t only about building better products. It can also help you make your internal business processes more efficient, which reduces the overheads and increases the profit margins.
How to perform data analysis
I hope I’ve convinced you it’s worth investing your time and resources in developing a data-driven organization. If so, let’s have a look at how to conduct product data analysis.
Define your goals
The process starts with goal setting.
Why?
2 reasons for that.
First, your goals will determine the choice of analytics techniques and tools.
Moreover, having goals enables you to measure progress and evaluate the effectiveness of the changes you make.
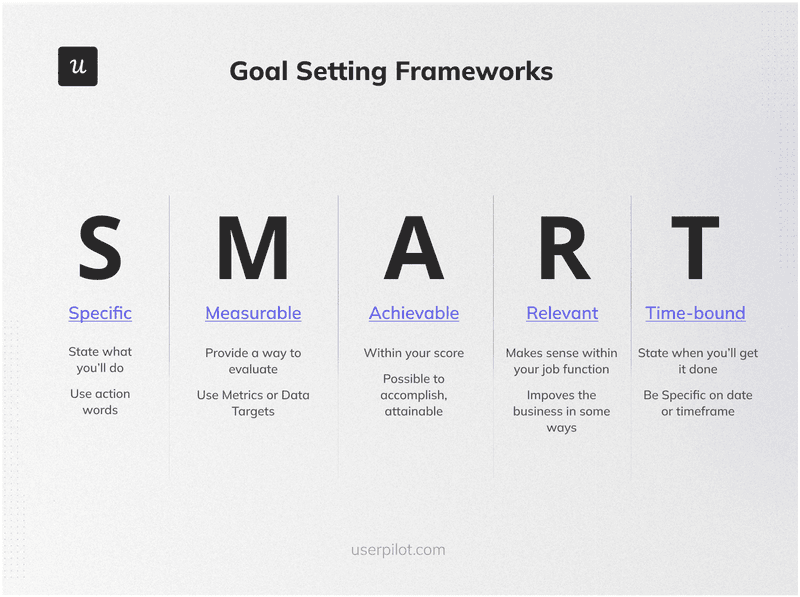
It’s good practice to use a goal-setting framework like OKR or SMART at this stage, at least initially. This will help you ensure that your goals are clear, specific, measurable, and achievable in a given time frame.
An example of a good goal is “increase user activation by 40% by the end of Q2 2024”.
Choose analytics method
Once you set the goals, choose a relevant analytics method, which is likely to be one of these:
- Descriptive analytics analyzes historical data to understand what has happened in the past. It’s commonly used for reporting and summarizing activities or performance.
- Diagnostic analytics examines data or content to answer the question of why something happened, often through techniques like correlations to identify patterns or anomalies.
- Predictive analytics uses statistical models and forecasting techniques to predict future trends and outcomes based on historical data.
- Prescriptive analytics goes beyond predicting future outcomes by recommending actions you can take to affect those outcomes.
Collect data
Next, it’s time to collect the necessary data. As mentioned, the choice of data depends on your objectives.
Here are the 3 most common ones.
Collect customer behavior data
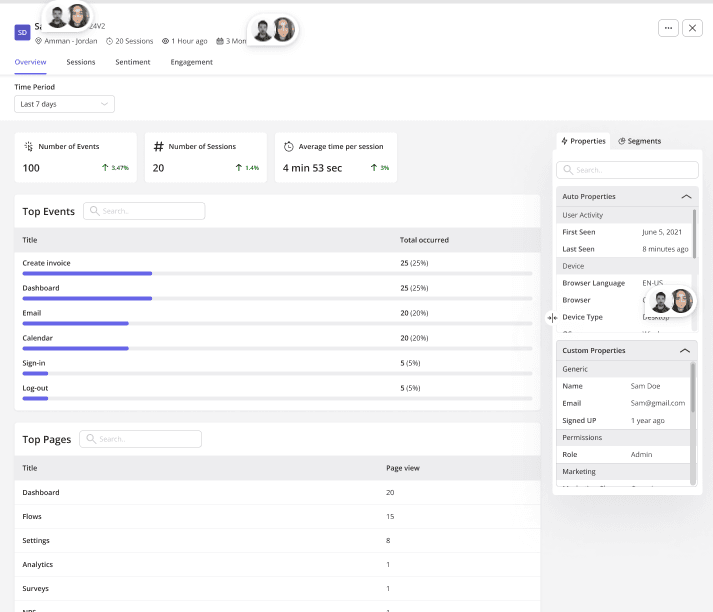
Customer behavior data is information about user interactions with the product across all touchpoints in the customer journey.
This includes their actions before they sign up for the free trial or purchase a subscription, and goes beyond:
Collecting customer behavior data starts the awareness stage, when they first learn about the product, for example from paid ads or social media campaigns.
It continues when they start showing interest in the product and considering it as a solution to their problems, for example, by tracking their engagement with webinars, MOFU and BOFU blog posts, and demo bookings.
Once they get inside the product, your focus switches to tracking how they use the product and their satisfaction.
Such data can help teams understand customer needs, wants, preferences, and pain points. This is priceless for optimizing product funnels.
Collect user sentiment data
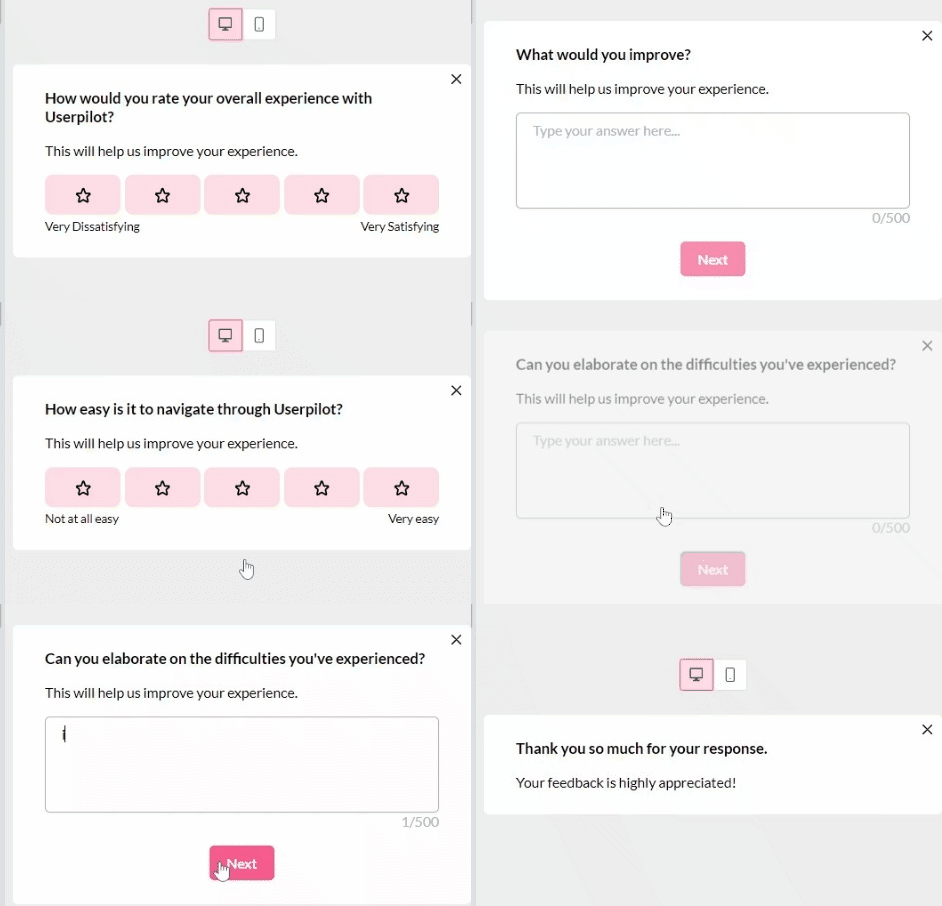
User sentiment data describes how users feel about the product and brand.
This refers to all aspects of their customer experience: how well the product satisfies their needs, how they rate particular features, how helpful their interactions with the customer success teams are, or how useful they find the self-service resources.
How can you collect the data?
The most reliable way to do it is via in-app surveys, like NPS or CSAT ones. That’s because users are more likely to respond to a survey while they’re interacting with the product. When triggered contextually, in-app surveys can also provide more valid insights because the experience is still fresh in their minds.
Now let’s contrast them with email surveys: how likely are you to respond to one? If you’re like me, the chances are close to zero even if I value the product a lot.
Having said that, there are situations when email surveys can be handy. For example, it may be the only way to get feedback from churned users.
Other user sentiment data sources include:
- User interviews.
- Usability testing sessions.
- Conversations with customer-facing teams.
- Reviews.
While the quantitative data from product analytics can help you track what your users do, the qualitative feedback data is key to understanding why they do it.
Collect product usage data
Product usage data is a kind of customer behavior data focusing on user actions inside the product.
This includes what features they use and how they use them, how often they use the product, how much time they spend using the product, or how they navigate the product UI.
Product usage data is critical for product development, feature improvement, identifying popular or underused aspects of the product, and personalizing user experience. It helps teams enhance product functionality, and its usability, and prioritize development resources effectively.
How do you collect such data?
With a product analytics platform. We look at a few in the last section.
Visualize customer data
Data visualization makes data analysis easier and quicker.
For example, by visualizing conversion data as a funnel you can often spot where users experience friction right away without crunching any of the figures. While visualizing multiple data sets in a graph can help you identify correlations.
It’s good practice to visualize all the data collected for a particular purpose in one dashboard.
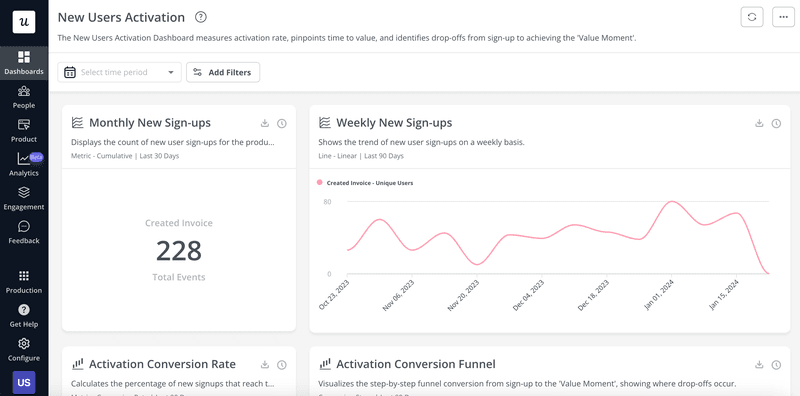
For instance, if you’re trying to improve user activation, you could have a dedicated dashboard where you visualize trends in new user sign-ups, activation conversion rates, and time to activation, and track how users move down the activation conversion funnel.
Create hypotheses based on data-driven insights
Once you visualize and analyze the collected data, it’s time to form hypotheses on what could fix the issues that you’re trying to address.
For instance, if you can see that users get stuck right after signing in, you may hypothesize that a welcome screen with a CTA could set them up for a better start.
Another example?
If users fail to complete a couple of the activation events, a hypothesis could be that there isn’t enough guidance prompting them to take action. Couple an onboarding checklist or interactive walkthrough to address this issue.
Test and improve
Having formed your hypotheses and ideated potential solutions, it’s time to test them.
The idea is simple: roll out the change for a small group of users and assess its effectiveness. Does the welcome screen help new users with their onboarding? Do the checklists or walkthroughs increase activation?
The testing isn’t a one-off exercise. Instead, it’s an iterative process that involves numerous experiments where you collect feedback, implement changes, and test their impact.
For instance, if the welcome screen does move the needle, you can further refine the microcopy or its design and A/B test it to see if it performs better than the original version.
Best data analytics tools to drive business growth
In the past, implementing the data-driven approach required help from developers and data scientists to set up the tracking and conduct analysis in business intelligence tools.
These days, you don’t need a degree in data science to collect and analyze data, thanks to no-code product analytics tools.
Let’s look at 3 solid options for SaaS teams.
Userpilot: Best for in-app customer data
Userpilot is a digital adoption platform, so apart from analyzing user behavior inside the product, you can also use it to collect customer feedback and act on the insights by engaging users with in-app experiences.
Here’s a quick breakdown of Userpilot’s analytics features:
- Funnel analysis – for tracking user progress along the customer journey and identifying roadblocks and drop-off points.

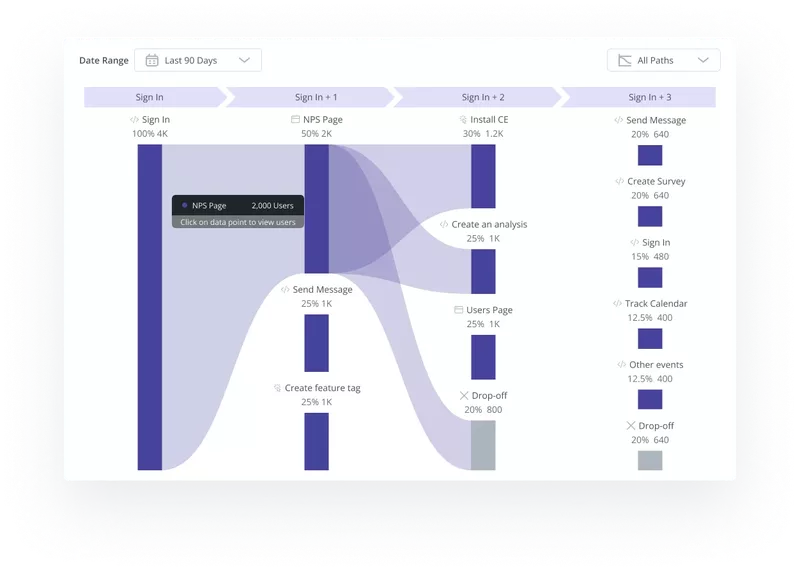
- Path analysis – for mapping out user actions before or after an event; useful for identifying the most optimal conversion paths.
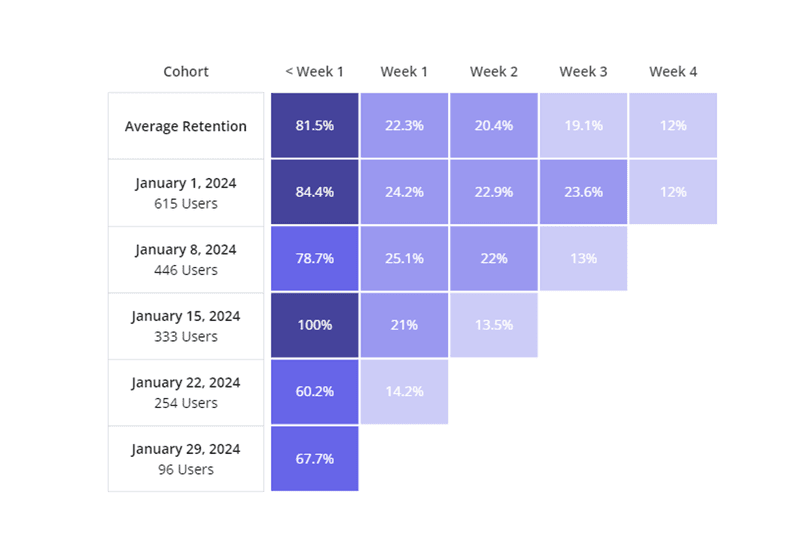
- Cohort analysis – for analyzing trends in product engagement over time and identifying churn causes.
- Analytics dashboards – currently, 4 ready-made dashboards focus on different aspects of product usage and user engagement; custom dashboards will be available soon.
- AI analytics – the functionality is coming in 2024 and will help teams extract actionable insights from the data and make accurate predictions.

- Survey analytics – the team is also working on survey analytics which will help product teams analyze quantitative and qualitative user feedback.
Pendo: Best for mobile data analytics
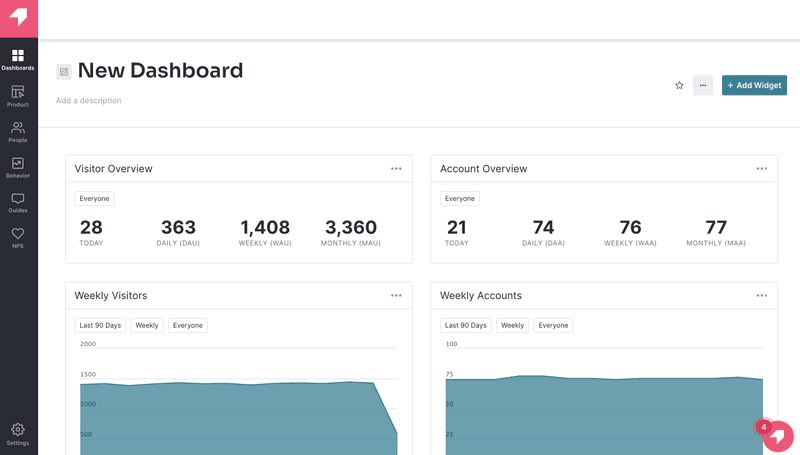
Pendo used to be known for its state-of-the-art analytics. Although their innovation in this area seems to have stalled over the last couple of years, it’s still a solid product with advanced functionality.
One main advantage that it has over Userpilot is that it supports mobile apps.
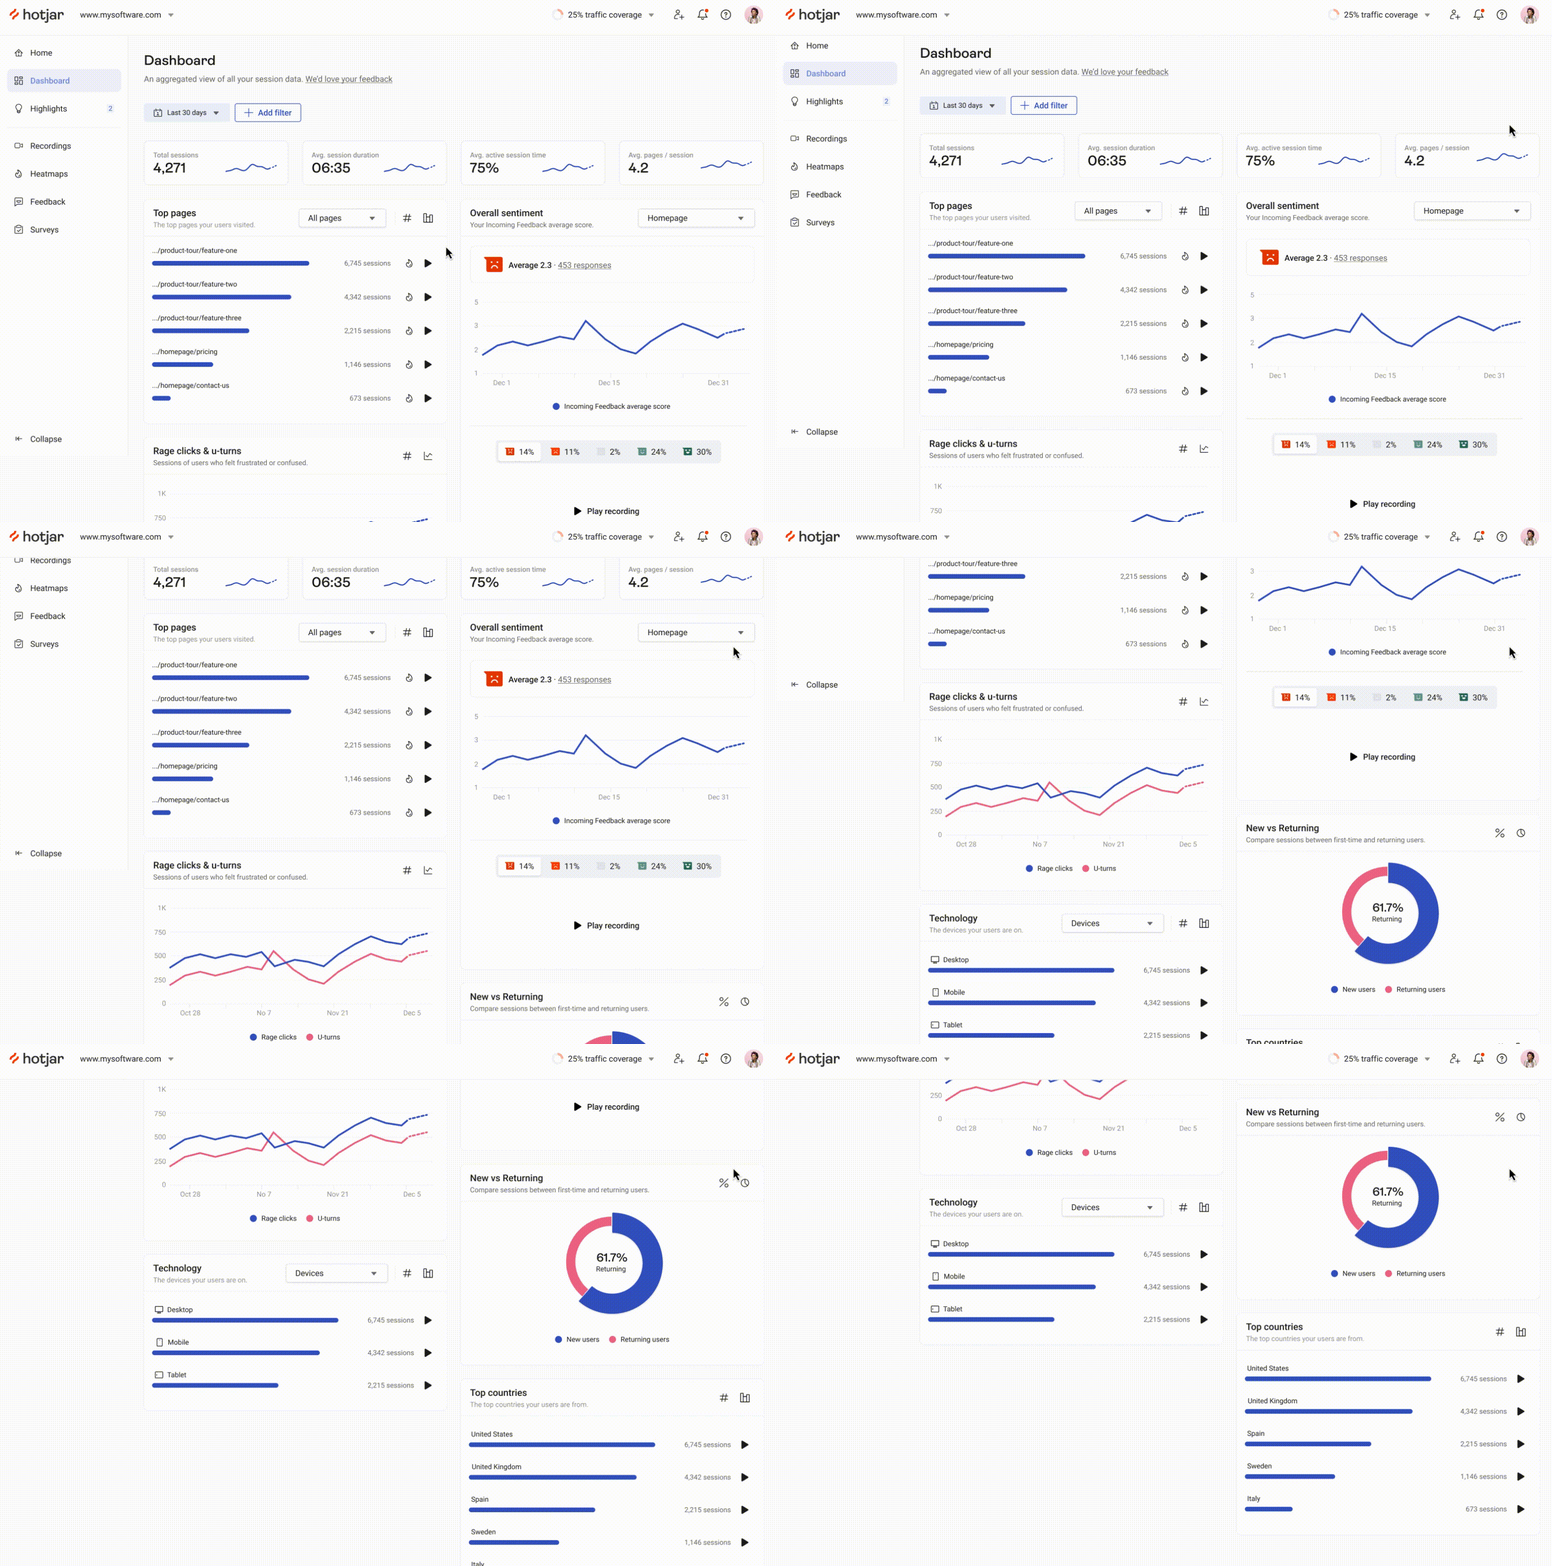
Hotjar: Best for customer session insights
Hotjar is a UI/UX analytics platform that enables product teams and designers to gather granular customer session data.
The tool is best known for its session recordings and heatmaps but it also offers funnel analysis (linked to session recordings) and feedback functionality. There’s also a pool of 200k+ testers you can use if you can’t recruit them from your user base.
Conclusion
Data-driven analytics is essential for product success. They remove the guesswork from the decision-making process and enable organizations to reduce risk and prioritize product initiatives.
Thanks to code-free analytics solutions, SaaS organizations make data-driven decisions without specialist data skills or support from data analysts.
If you’d like to learn more about how Userpilot can help you turn your SaaS into a data-driven company, book the demo!


