Pendo vs Mixpanel: Which Product Analytics Tool Should You Choose?


Pendo vs Mixpanel? Which of the two is better for your SaaS product team?
If you’re after the answer to this question, we’ve got you covered!
Let’s dive into our comparison of the two analytics tools, their key features, strengths, and weaknesses, along with their pricing plans.
What is the difference between Pendo and Mixpanel?
The key difference between Pendo and Mixpanel is their purpose.
Mixpanel is a dedicated analytics tool, so that’s all it does. Pendo, on the other hand, is a product adoption platform.
This means that apart from analytics, Pendo also allows product and marketing teams to gather feedback and drive product engagement and adoption with in-app experiences.
Mixpanel can’t help you with any of that, so you need other product adoption or customer success tools in your stack.
Must-have features to look for in a product analytics solution
When looking for a product analytics tool for your SaaS, there are a few features to pay particular attention to:
- Event and goal tracking.
- User journey tracking.
- Product usage tracking.
- User segmentation based on product usage and survey responses, instead of just demographics.
- Data processing in real-time so that you can trigger messages in response to current events.
- Integrations with other analytics and adoption tools, and webhooks.
Pendo for product analytics
Pendo is one of the key players when it comes to product adoption tools. It allows you to design in-app messaging and user onboarding experiences to drive customer success in both web and mobile apps.
While it’s been trying to lure early-stage companies with its lower plans, Pendo is really a tool for Enterprise clients.
As an all-in-one product experience suite, it bundles robust product analytics with guides and feedback. That’s useful. But in practice:
- The autocapture is basic (historical data for page loads + feature clicks). If you want rich, granular behavioral event tracking (form fields, every DOM interaction, rich event backfills), you’ll find Pendo lacks the out-of-the-box depth of a Heap or Mixpanel autocapture play.
- The hourly processing cadence is the Achilles’ heel for fast-moving teams. If your product ops or growth squad expects immediate segment flips after a user does X → show Y, you’ll be frustrated. Pendo is “near-real-time” at best; don’t design flows that require sub-minute precision.
- The event naming/scale limits are a classic trap: start instrumenting everything without thought, and you’ll hit limits or end up with a spaghetti taxonomy you can’t query cleanly. Plan and prune.
Where Pendo analytics is actually helpful is its feature adoption dashboards and packaged product view,s which include:
- Custom dashboards
- Reports (Paths, Funnels, Workflows, Retention cohorts)
- NPS tracking and analytics
- Product Engagement Score (PES) analytics
The three features we will be having a closer look at are:
Pendo dashboard.
Pendo segmentation
With Pendo segmentation you can group your users by several criteria:
- Product usage and user behavior data, like tagged feature clicks or guide views.
- Visitor and account data, for example, systems data or demographics data.
- Mobile-specific data, e.g., the OS version.
What are the benefits of detailed user segmentation?
You can use it for targeting different user cohorts with Pendo Guides.
For example, you could trigger them to drive engagement with a feature that a particular segment would find valuable, considering their use case. Or to target them with a survey about their experience.
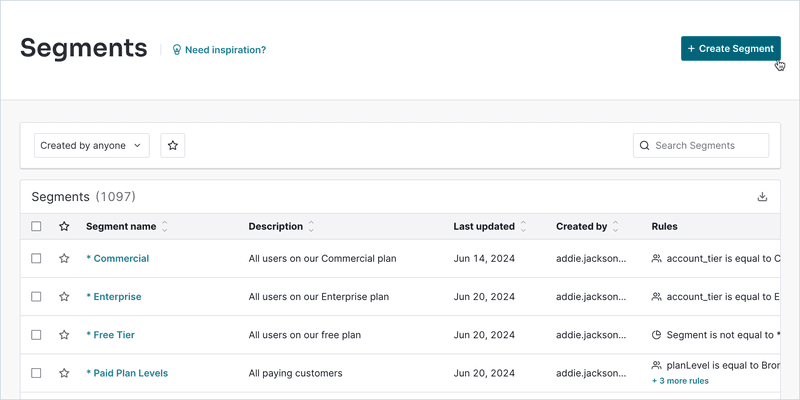
Pendo segmentation.
Do note that Pendo segmentation is limited when you use it for targeting Guides. Pendo marks rules that use the number of events within a time period as potentially ineligible for guide targeting (because they’re heavier to compute).
For example, if you want to target a segment that “does X a number of times but not Y”, it might be impossible.
Pendo funnel analysis
A user funnel is a succession of steps that a user takes inside the product to achieve a goal.
User funnel analysis is a great feature for identifying friction points in the user journey and making the user experience more intuitive so that your users can achieve their objectives more quickly and easily.
You can customize Pendo funnels by:
- Funnel steps
- Data range
- Segments
- Time-out period
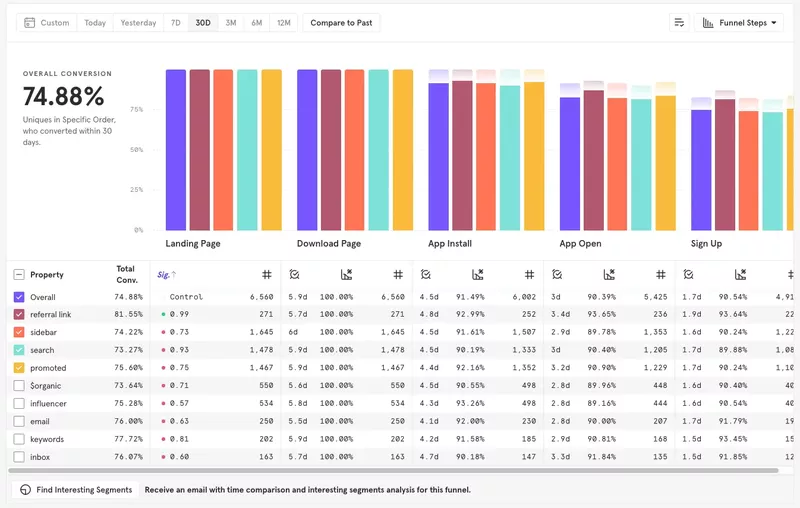
A Pendo funnel looks like this:
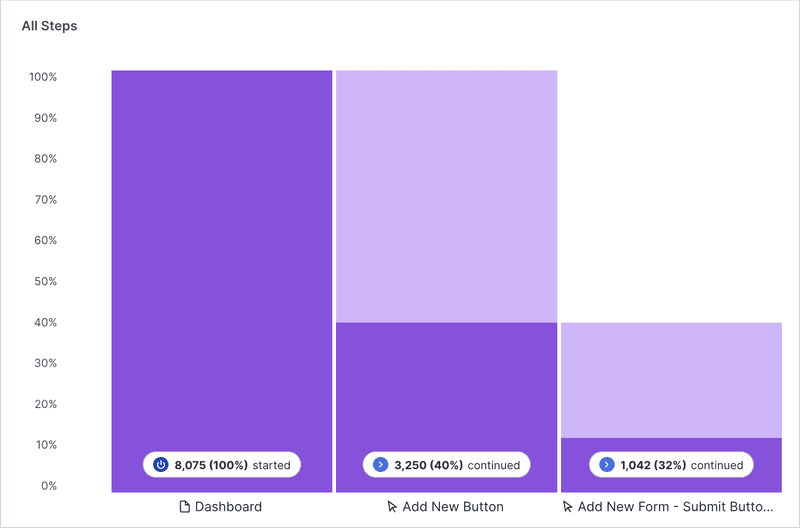
Pendo funnel analysis.
The dark bars represent users who advanced to the next step, while the pale ones are those who dropped off. Clicking on each of them gives you a detailed breakdown of different performance metrics and lets you go straight to watch a session replay to see how the drop-off happens.
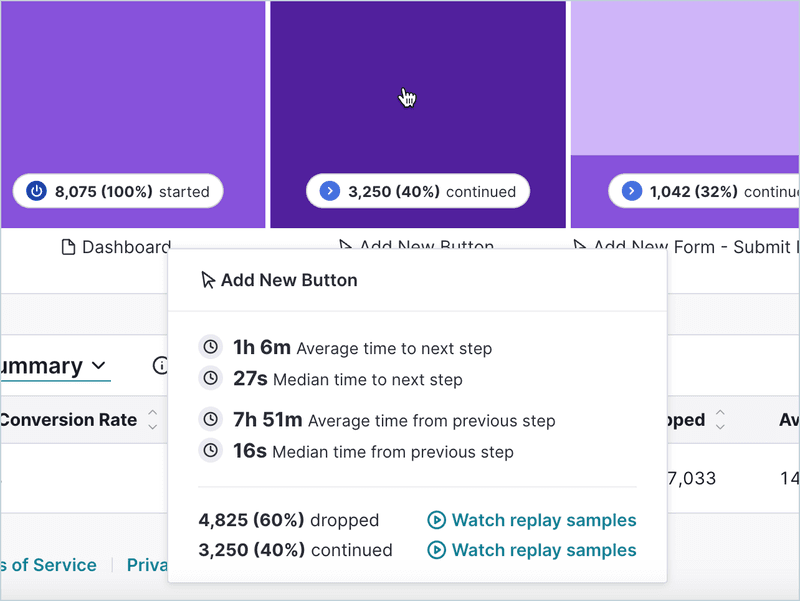
Pendo funnel analysis details.
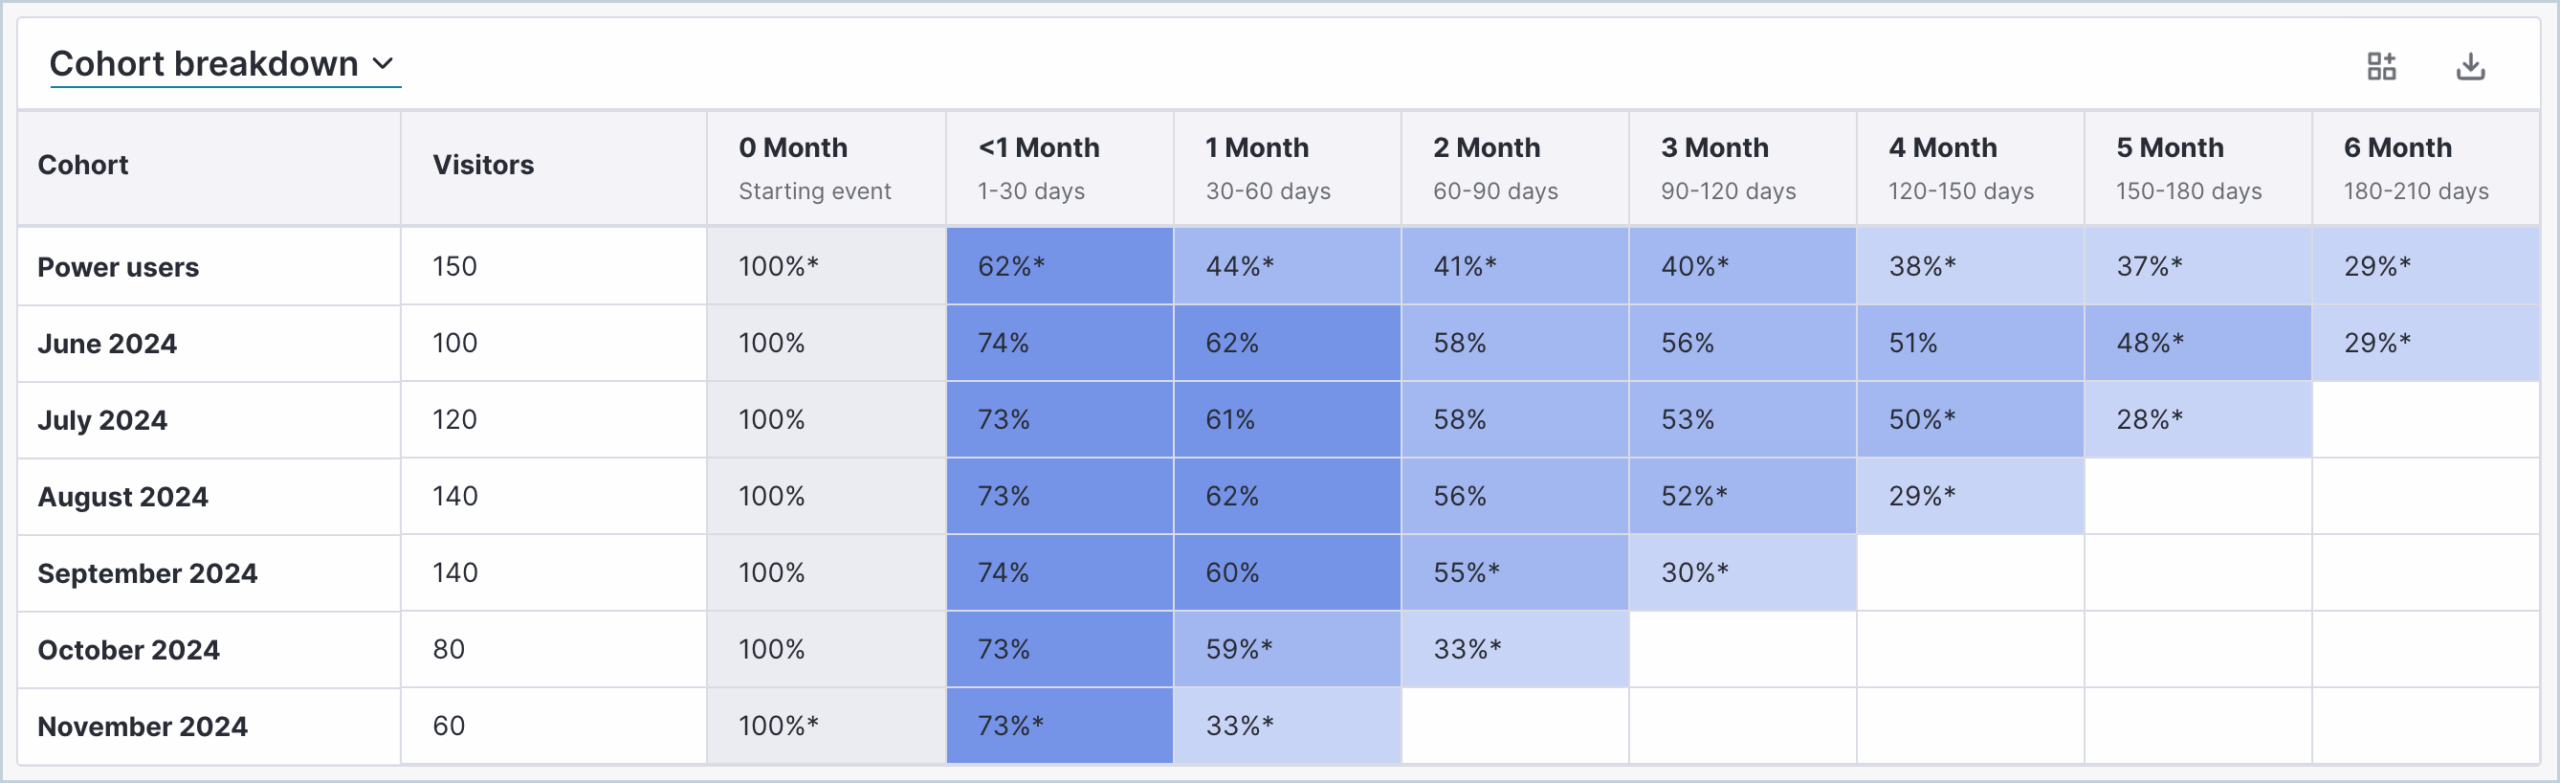
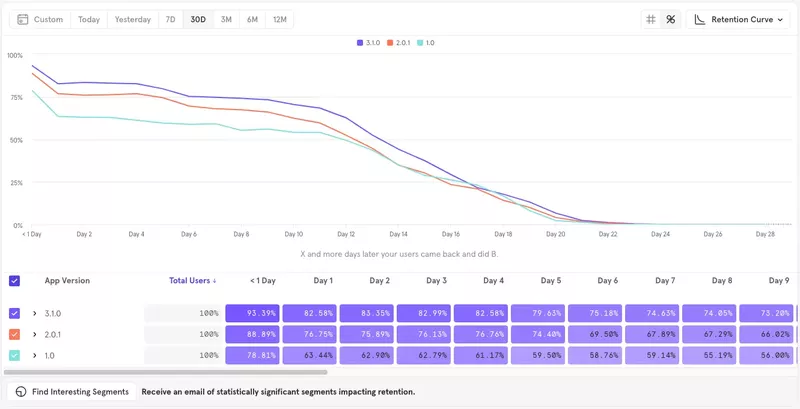
Pendo retention analysis
Retention analysis gives you insights into which customers stay with your product and use it regularly over a period of time. Based on that, you can determine how valuable your product is and forecast future growth and revenue.
Pendo presents the retention data in an interactive chart. You can filter it by:
- Activity type
- Apps
- Cohort type and size
- Segment
- Date range
Just like in the funnel charts, you can click on each of the bars for more detailed insights into the retained and dropped users.
Thanks to that, you can:
- Target each of them with a Pendo Guide, for example, to help them discover more advanced features.
- Reach out to the dropped users with emails to try to win them back.
- Launch surveys to collect feedback about customer experience.
Pros and cons of using Pendo for product analytics
Pendo has managed to nail quite a few aspects of its functionality:
- ✅ Works on both mobile and web apps.
- ✅ In-depth analytics, including retroactive data collection.
- ✅ Easy to set up and use.
- ✅ Product Engagement Score (PES).
- ✅ User feedback and NPS tools,
- ✅ Engagement layer that allows you to act on the feedback and data.
However, there are still some areas for improvement:
- ❌ User behavior data is displayed with up to a 1-hour delay, but the platform allows you to trigger contextual in-app guidance based on real-time user actions with minimal latency.
- ❌ The pricing structure is not very transparent.
- ❌ Leveraging Pendo to its full potential requires technical expertise.
- ❌ Reportedly, the higher plans are not affordable for bootstrapped SaaS startups.
- ❌ Limited customer support
Real customers prove the point. We saw this with Shelterluv: Pendo was too complex and costly for the slice of features they actually used. As their Senior Customer Solutions Manager, Matthew Brown said:
“One of the biggest feedback the team had about Pendo was like, we just don’t know how to use it. And it’s hard to figure out. We don’t have the time to just like, sit and read through everything to figure out how to use it.”
After switching to us, it only takes them 1-2 weeks to get everything live and start to see the results. Their support and onboarding teams reported a clear drop in ticket volume and won back hours each week.
Pendo pricing
We get it, Pendo offers a solid suite of analytics tools: session replays, Data Explorer for custom reports, behavioral analytics, and visual dashboards. But unlocking those features isn’t cheap, and the pricing model is anything but transparent.
There are 4 pricing plans with the availability of a demo and a limited free trial for certain plans.
- Free
- Base
- Core
- Pulse
- Ultimate
Pendo splits its analytics capabilities across several plans: Base, Core, Pulse, and Ultimat,e and you only get access to key analytics tools at higher tiers:
- Core Tier unlocks session replays.
- Pulse Tier adds NPS, idea prioritization, and a customer portal.
- Ultimate brings in journey orchestration, advanced reporting, and data sync.
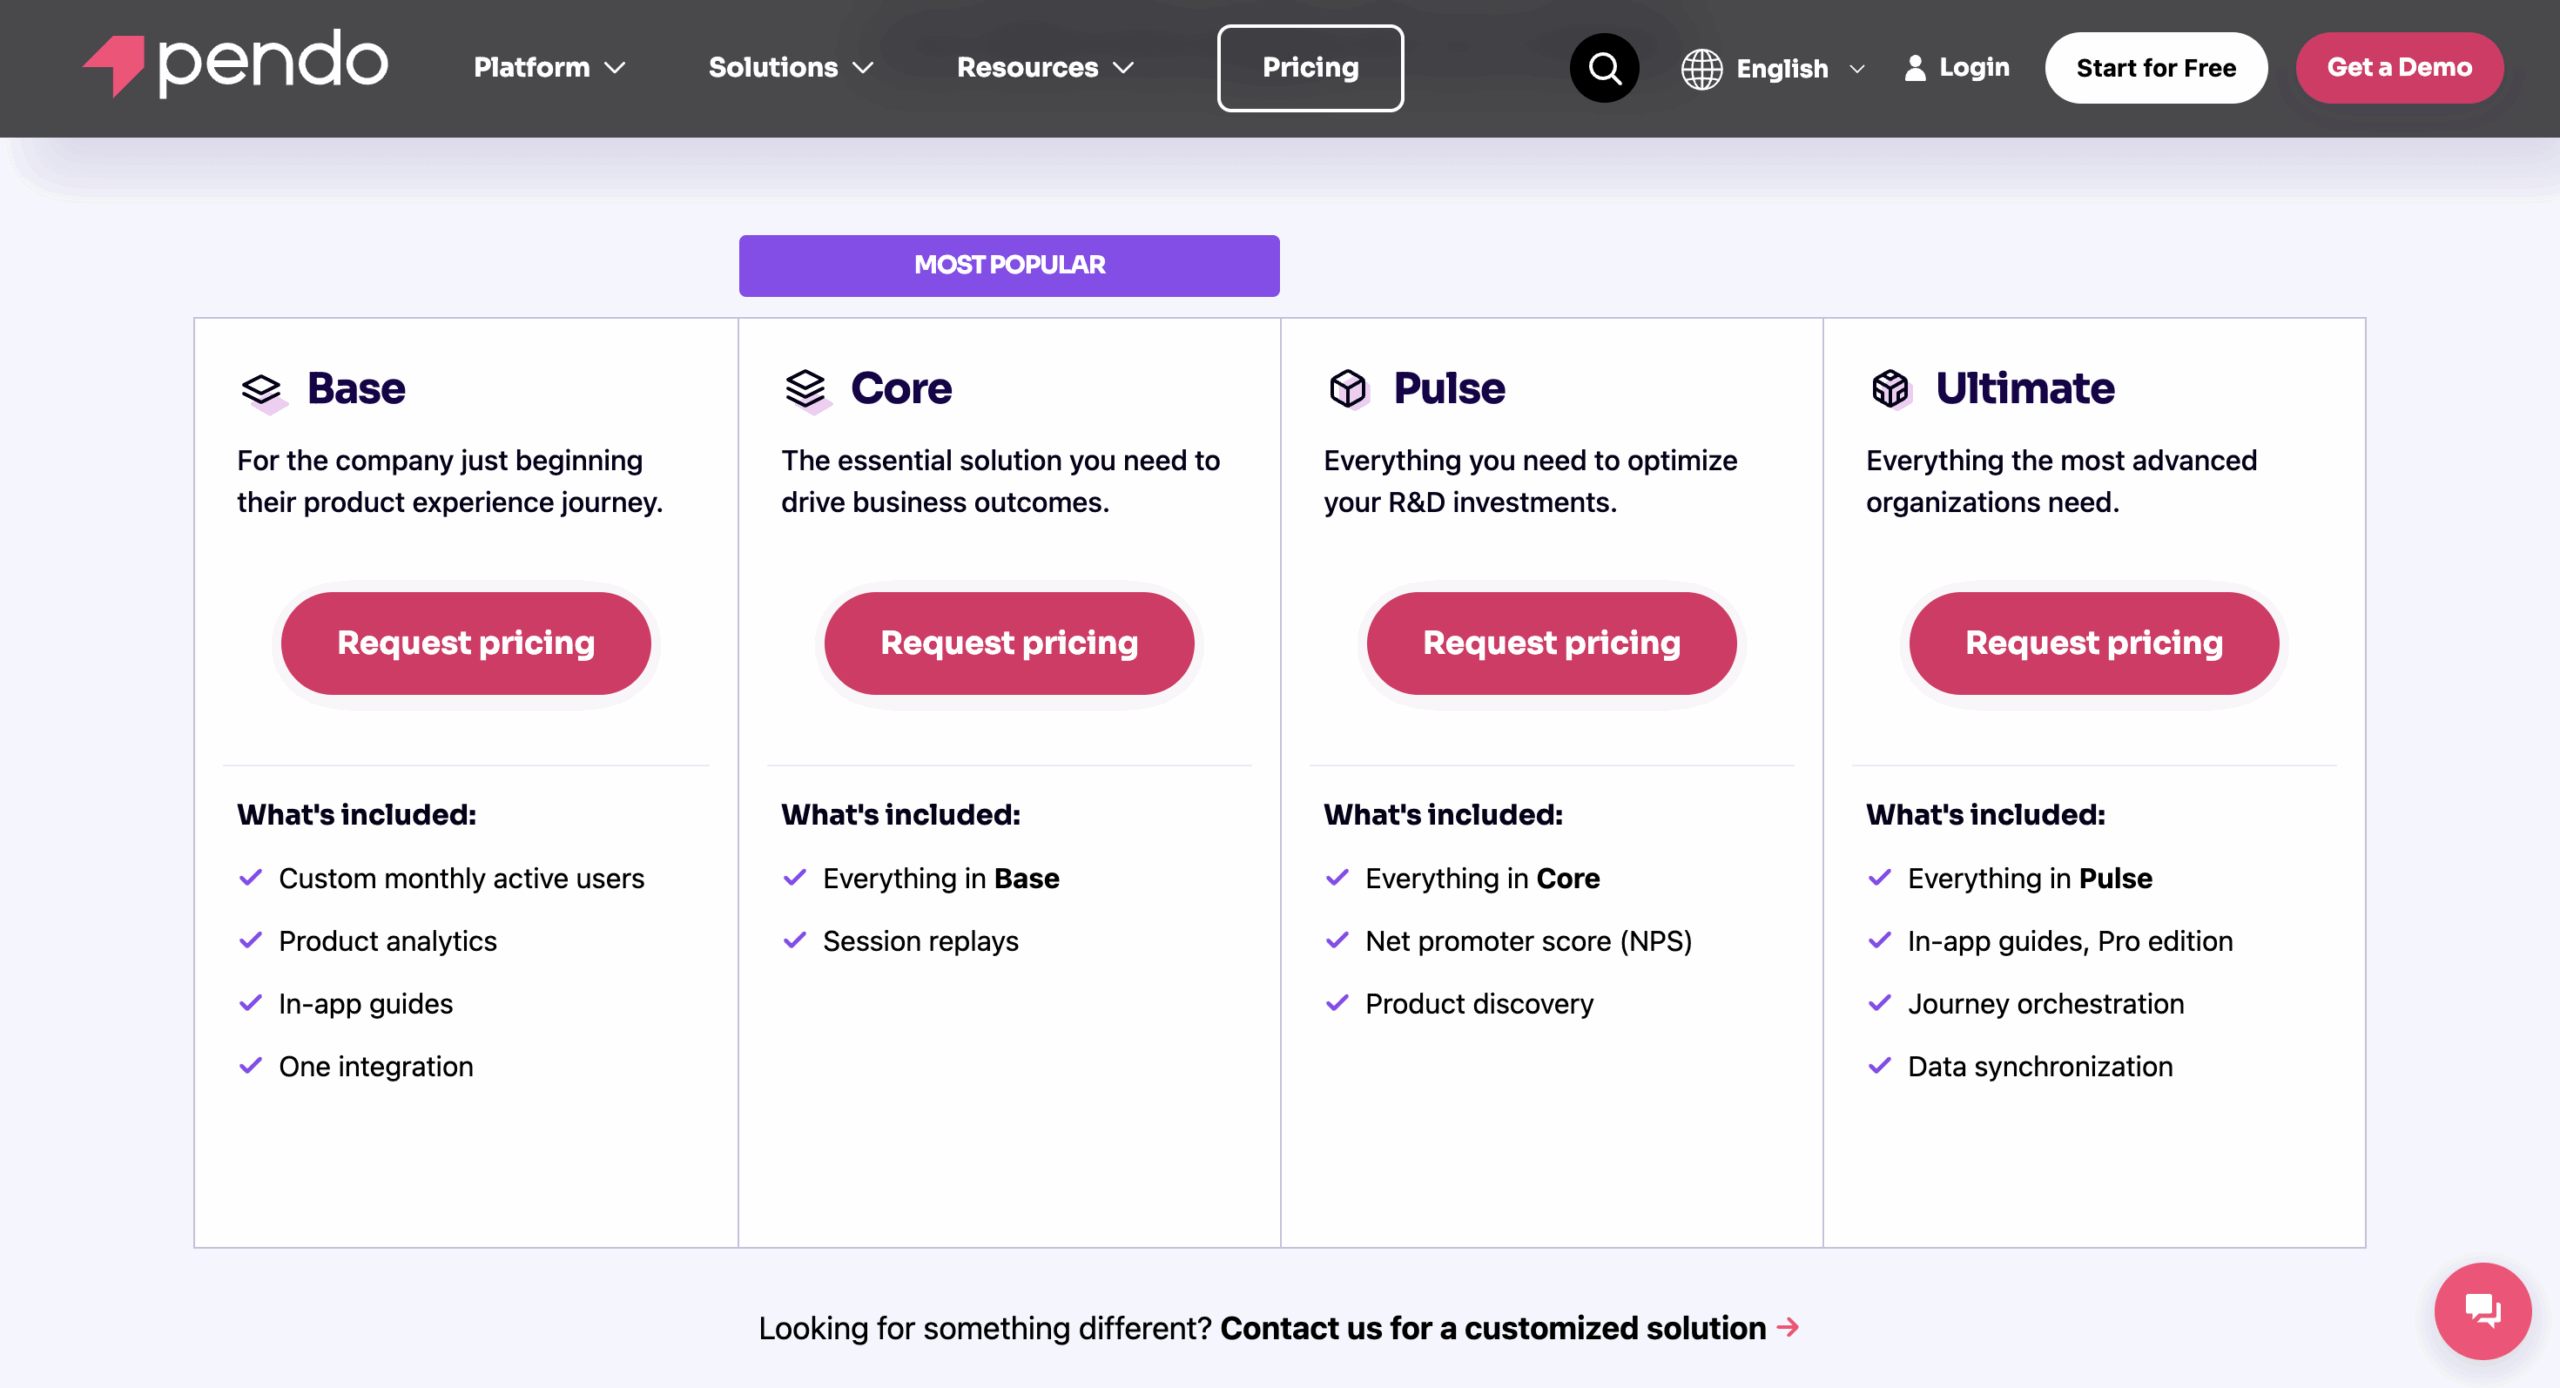
Everything is “Request pricing,” and quotes reportedly start at $15,900/year, with averages around $47,300/year and enterprise deals climbing to $140,000/year.
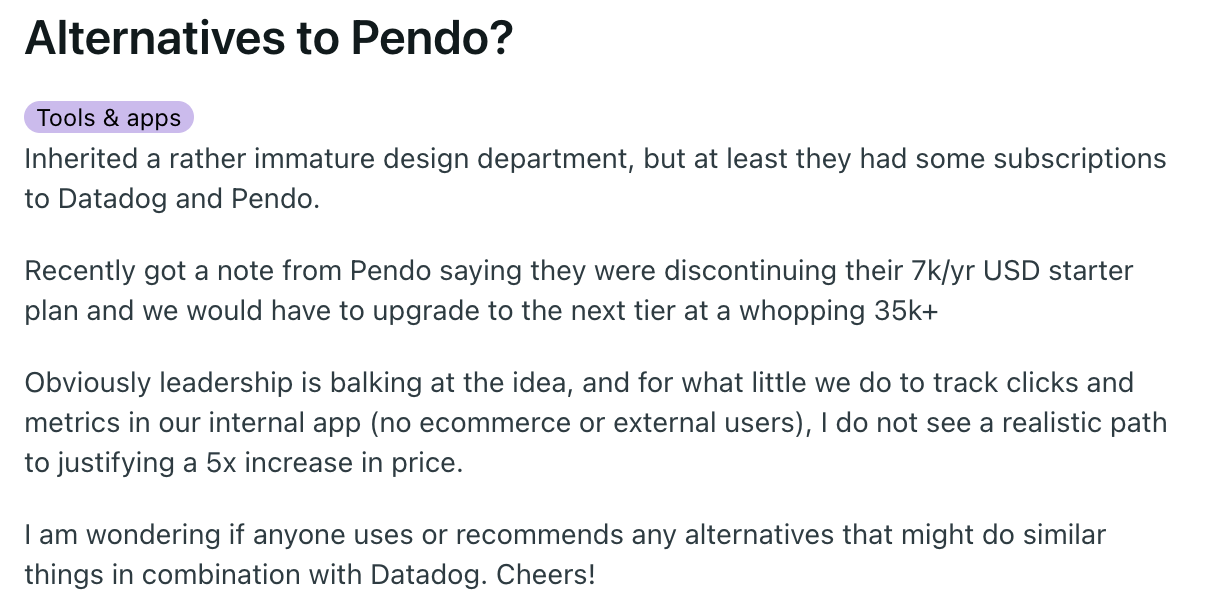
Even small teams dealing with simple click metrics have seen sudden price hikes; one note shows a 5× increase from ~$7k to ~$35k when renewing. And that was already a discussion on Reddit two years ago; imagine what the bill looks like today.
Mixpanel for product analytics
Mixpanel is a powerful self-serve product and user analytics platform that enables companies to track and increase user engagement.
It supports both mobile and web apps, and it’s an analytics tool of choice for product teams across the globe, regardless of the company size. Aside from serving product teams, it’s also considered a more advanced web analytics tool than Google Analytics.
Given that it’s an analytics tool, Mixpanel offers a whole host of features:
- Flows
- A/B testing
- Impact analysis
- Query-time data modeling, including custom events
- Custom dashboards
- User segmentation
- Funnel analysis
- Retention analysis
For consistency, we’re looking closely at segmentation, funnels, and retention analysis, just like we did with Pendo.
Dashboard in Mixpanel.
Mixpanel segmentation
Mixpanel Analytics offers potent user segmentation functionality.
You can create user segments based on user attributes, properties, or cohorts.
For a more granular view, you can break down the analysis by event or user property and add further breakdowns. This means you can easily analyze how people engage with your product in more detail. This isn’t something doable in Pendo.
Mixpanel segmentation.
Mixpanel funnel reports
Mixpanel’s funnel reports are very similar to Pendo’s.
In the chart, each step is represented as a bar annotated with the conversion rate. Clicking on the bar gives you more details. In addition to the default chart, you can also visualize the funnel as:
- Funnel Trend
- Time to Convert
- Frequency
Apart from filtering the data using a range of criteria, like the platform, Mixpanel allows you to customize your funnels with breakdowns. This means you can compare conversions across different products that share a similar funnel or of various user segments.
For example, you could compare how users from different sources progress down the funnel.
Mixpanel funnel analysis.
Mixpanel retention reports
The breakdown customization option is also available in the retention reports. In this way, you can compare the user engagement with different features, on different app versions, or based on whether they completed an event or not. In Pendo, this is limited to cohorts only.
At the bottom of the report, we can see a heatmap-like visualization of retention for each of the samples we’ve chosen in the breakdowns. In addition, Mixpanel also gives us a curve graph showing user retention over time.
This looks very similar to Pendo’s retention chart.
Mixpanel retention analysis.
Pros and cons of using Mixpanel for product analytics
Mixpanel has a number of strengths:
- ✅ Sophisticated features enabling granular data analysis.
- ✅ Real-time data display.
- ✅ Powerful interactive and easily accessible visuals for quicker decision-making to beat analysis paralysis.
- ✅ High levels of customization.
- ✅ A free plan that is sufficient for small SaaS companies.
What lets it down is:
- ❌ Expensive enterprise-grade features.
- ❌ Complex setup, so you’ll probably need help from the engineering team.
- ❌ No user feedback or engagement functionality, so you need 3rd party tools.
- ❌ Steep learning curve compared to Pendo
Mixpanel pricing
As mentioned, Mixpanel offers a free plan that gives you access to most of its user journey reports and unlimited integrations. But it’s event-capped, and the current free offering includes 1M monthly events. If you exceed that, Mixpanel charges an additional data rate (for orgs on the 1M plan, that rate is $0.00028 per event).
If you’re after analytics only, this trumps what Pendo has to offer in its free or Base plan.
The other two plans are:
- Growth – First 1M events/month for free, then $.00028 per event (scales quickly up to +2,000/month for 20M events.) Includes unlimited reports, up to 20K monthly session replays, and 5 alerts per project.
- Enterprise – Custom pricing and negotiated contracts for very high event volumes and enterprise features (data warehouse syncs, advanced governance, SSO, etc.)
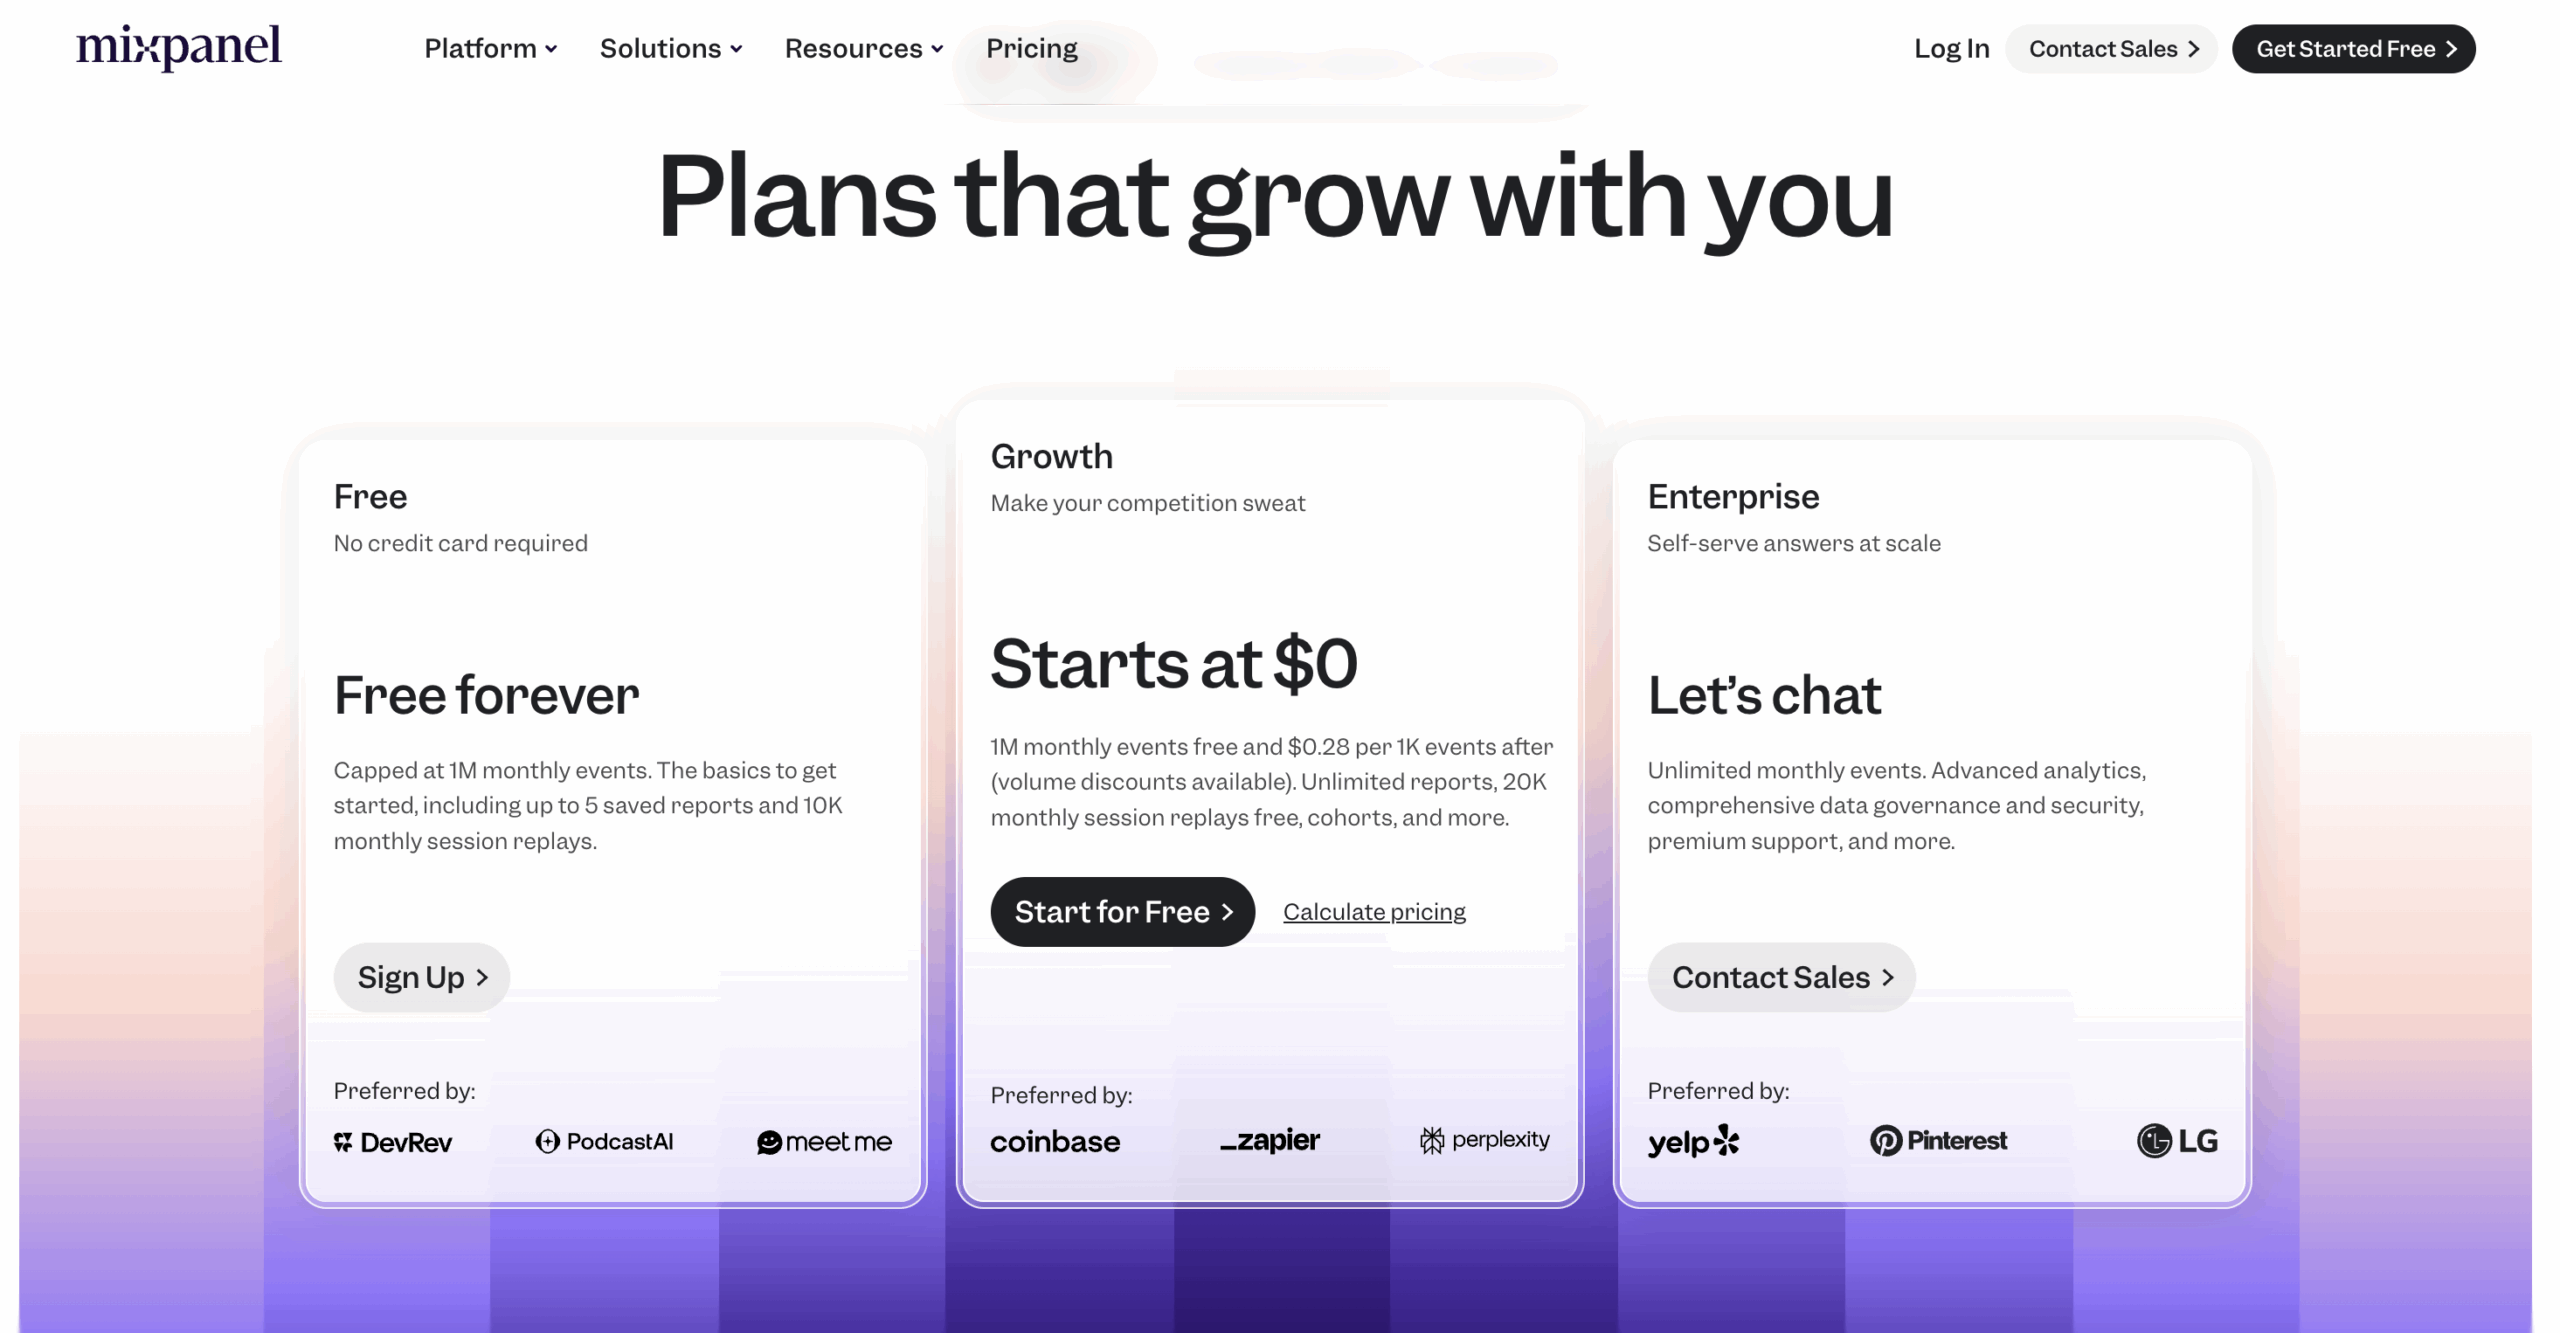
Mixpanel’s pricing plans.
Mixpanel vs Pendo: Userpilot as a cost-effective alternative for SaaS companies
Mixpanel’s free plan provides access to basic user journey reports and a limited number of integrations (up to 1,000 monthly tracked users). Advanced features, such as more integrations, are available with paid plans. Pendo offers these two and decent analytics but they’re fairly basic and come with a high price tag.
All this considered, is there a better product that ticks all the boxes? Yes, Userpilot.
In short, our platform may not support such advanced analytics as Mixpanel, but still offers enough to enable product managers to make data-driven decisions.
It allows you to collect and analyze user feedback and drive product engagement with features that are more advanced than what Pendo offers in its lower-tier plans. Additionally, you can get all these features at a competitive price point.
The analytics features include:
- Real-time product usage data display
- User behavior reports (including funnels, paths, cohorts, and trends)
- Auto-captured events that are more diverse in types (i.e., clicks, text input, form submissions)
- Session replays
- Advanced user segmentation
- Integrations with other analytics tools
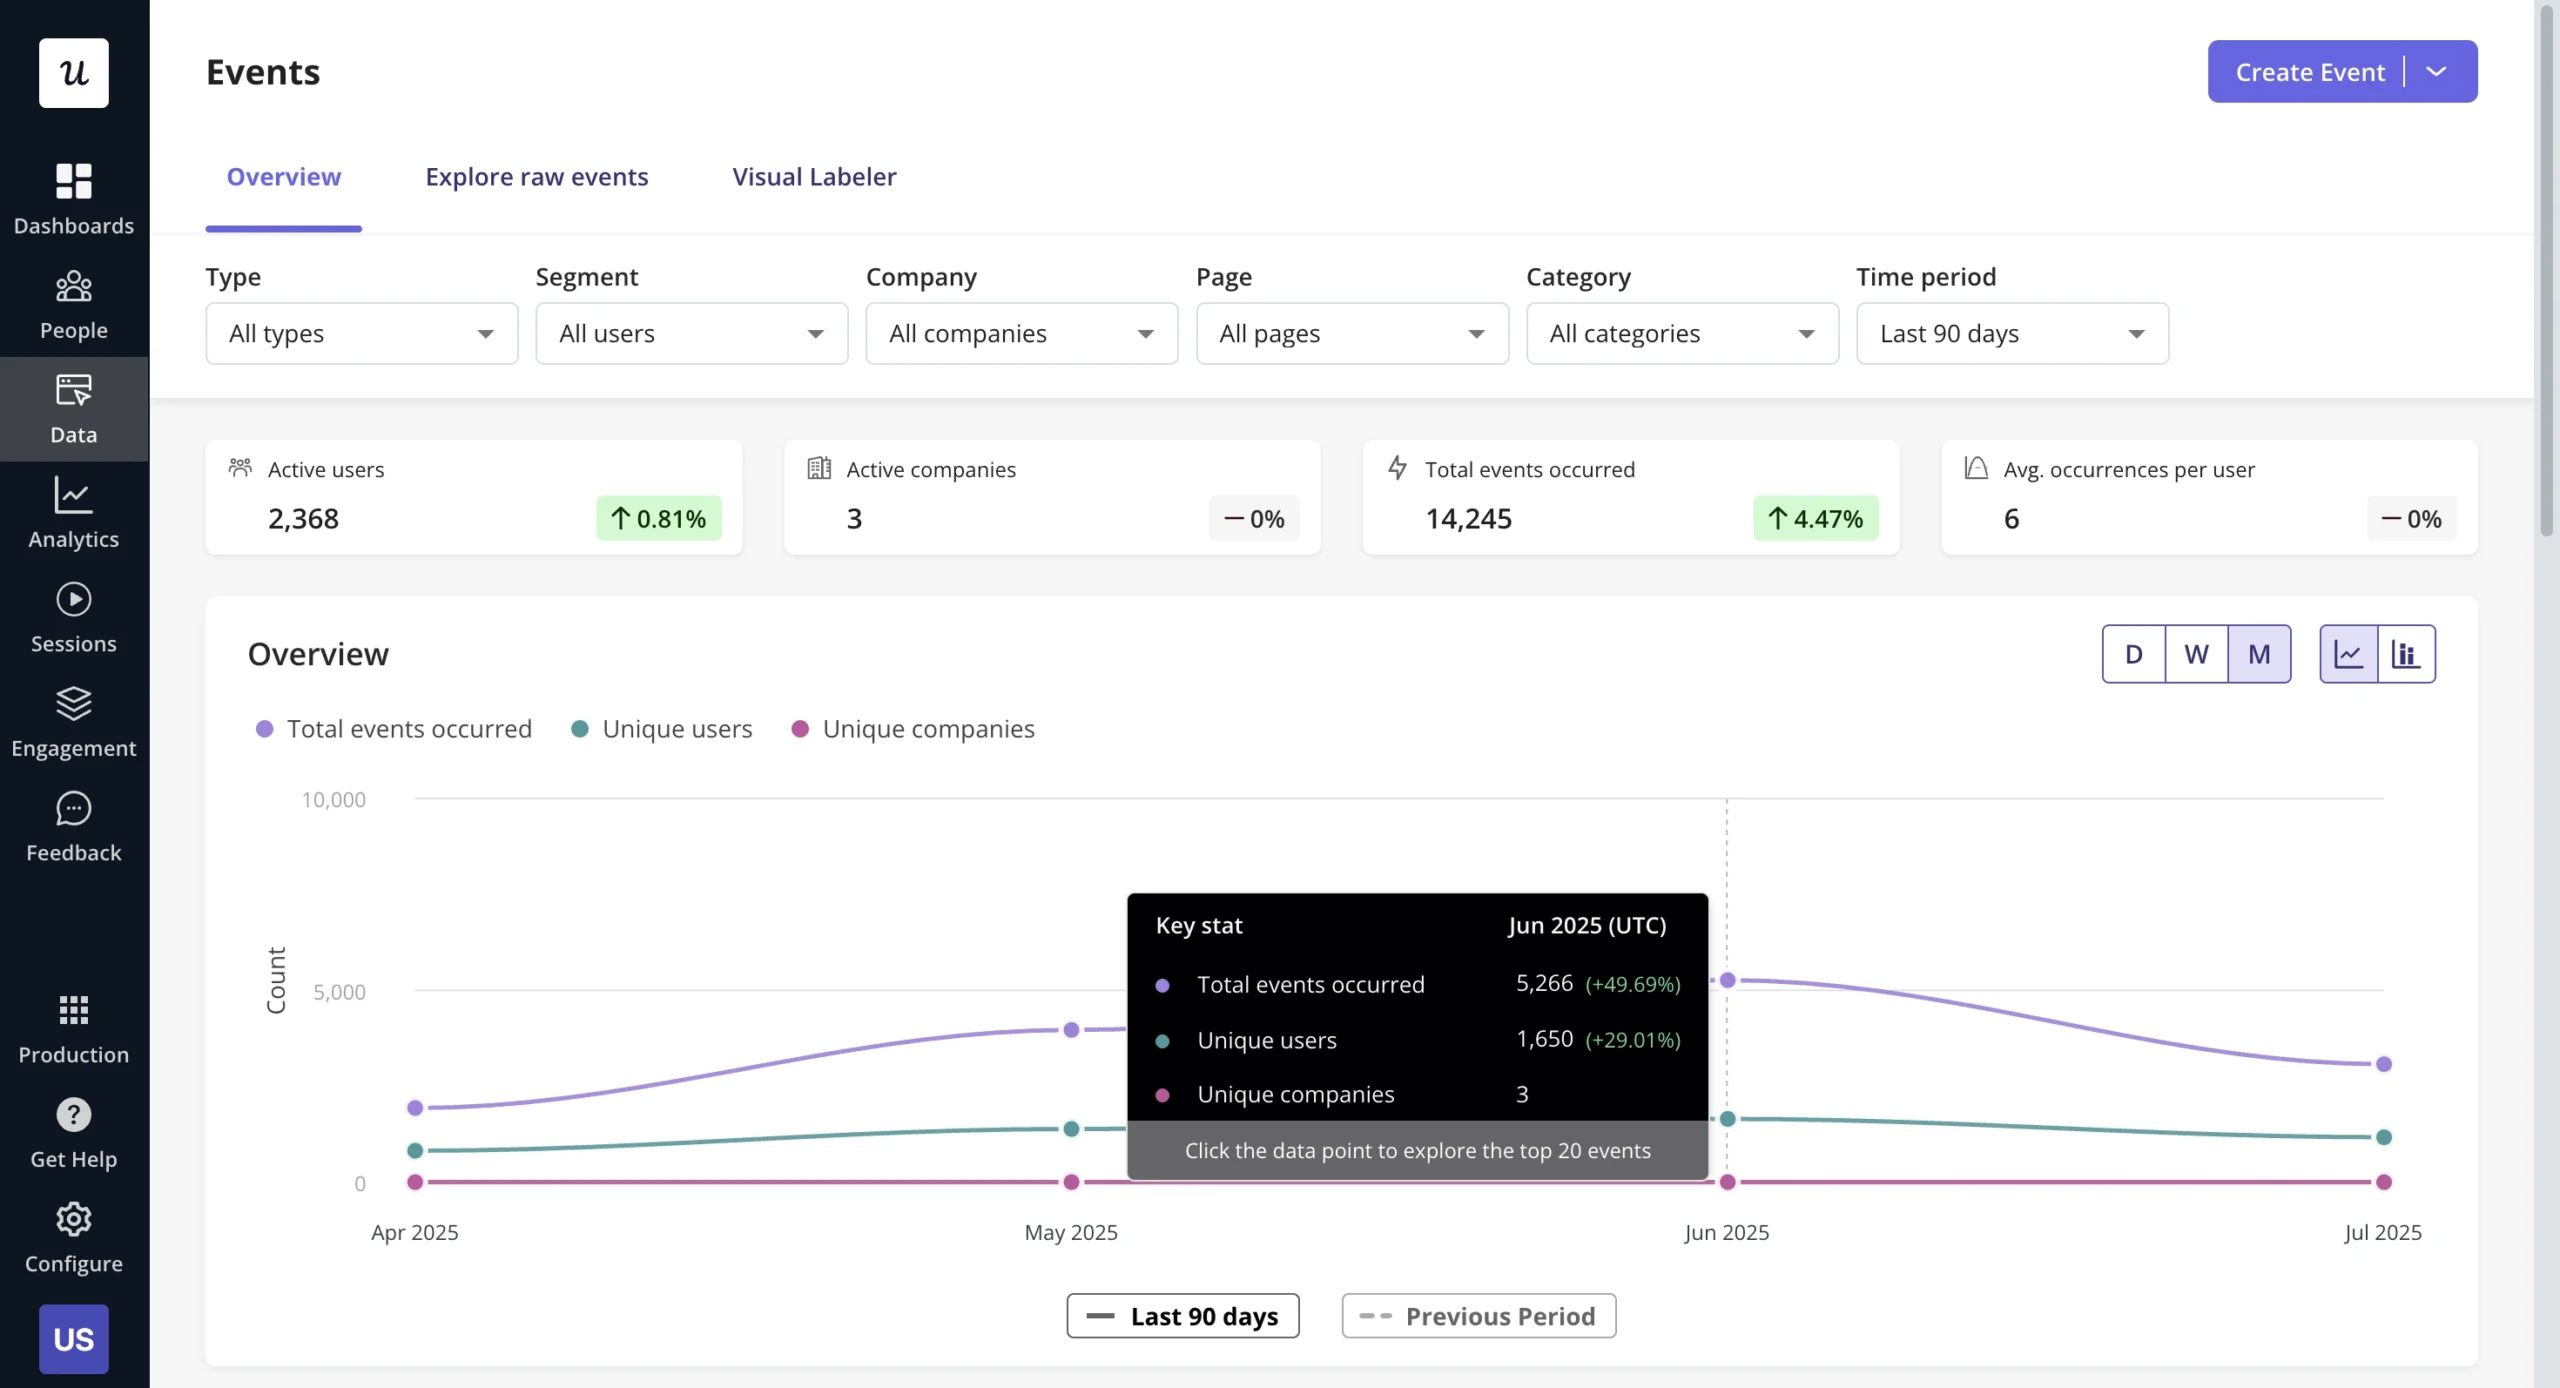
Feature & Events dashboard.
Userpilot segmentation
We offer advanced segmentation features for building and targeting different user groups.
This isn’t just “analytics for the dashboard”. Our segmentation is designed to trigger personalized onboarding and in-product experiences immediately.
And unlike Pendo, we treat time windows and count rules as first-class triggers without backend hacks or waiting. This means you can totally target a segment of users who “do X a number of times but not Y”.
You can segment users based on:
- User attributes, like their pricing plan
- Company data
- Tagged features they have engaged with/not engaged with
- Completed custom events
- In-app experiences they have engaged with, for example, a checklist
- User feedback – quantitative data, like NPS scores, and qualitative insights, like NPS responses
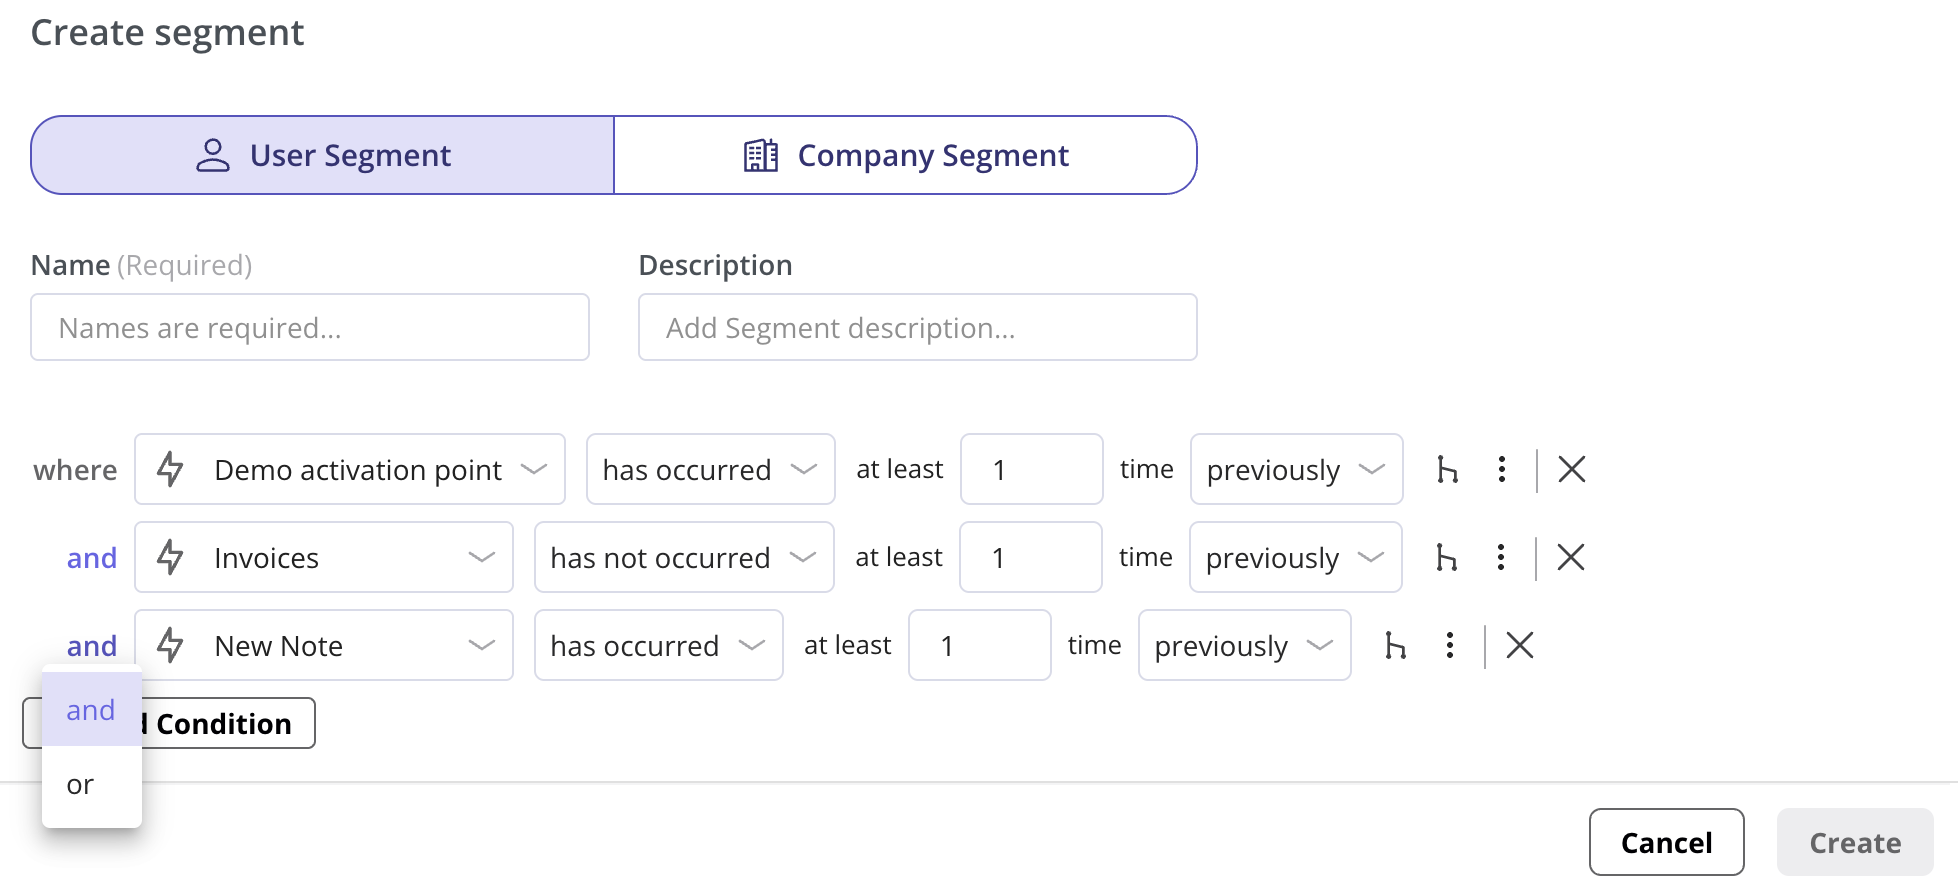
Segmentation options.
Userpilot funnel report
Just like Pendo and Mixpanel, Userpilot also supports funnel analytics. It lets you analyze how users move through specific sequences of actions, making it ideal for tracking conversions and identifying drop-off points.
It’s perfect for:
- Tracking what percentage of users completed signup within 7 days.
- Spot the primary drop-off point in the signup process.
- Learn if your A/B test impacted signup conversions.
- Watch how conversion rates change for the US payment funnel over time.
- Calculate the average time users take to complete the payment process.
You can even click on funnel steps to see a complete list of users reaching that step. It’s also possible to see session replays from Funnel reports and uncover why users drop.
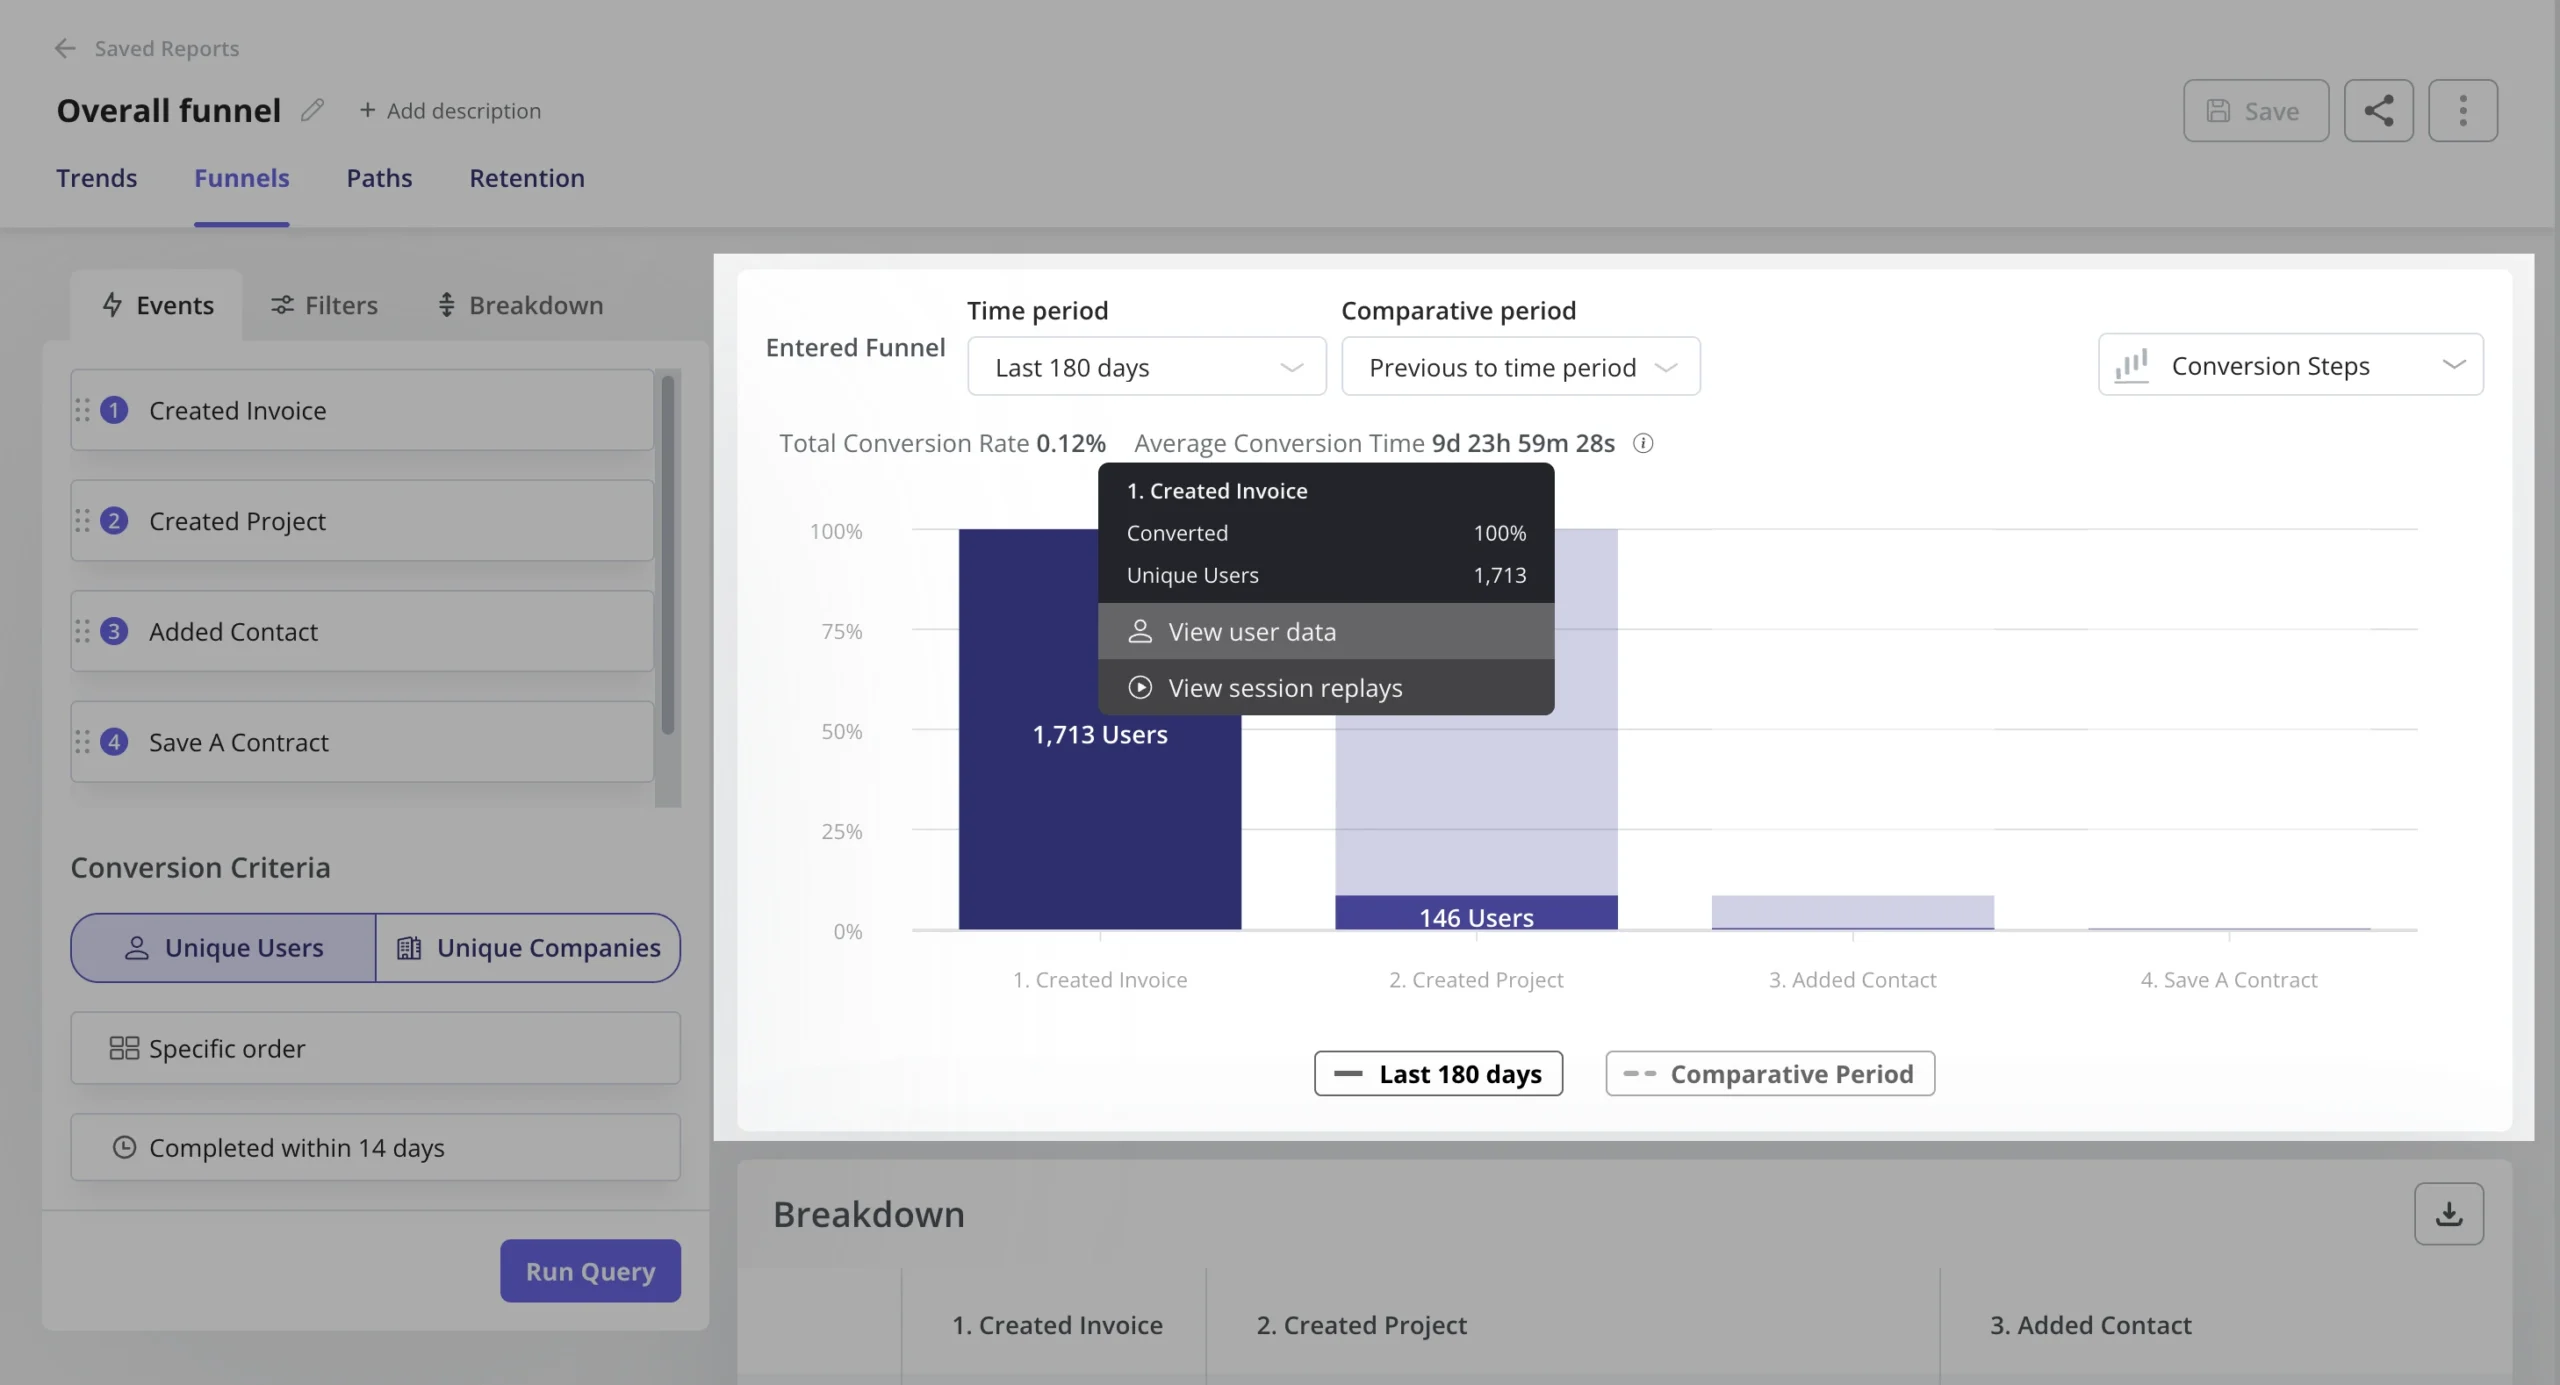
Funnel analysis.
Userpilot’s autocapture for event tracking
With autocapture, you’ll have historical data of every click, text input, and form submission from day one.
You can then label those raw events code-free in the dashboard to use them for reporting, segmentation, or triggering in-app experiences.
But we know single events don’t always tell the full story.
That’s why we let you group multiple actions into one Custom Event. For example, instead of tracking how many users “clicked signup,” “added team member,” and “created first project” separately, you can bundle them into a single “Activation Completed” event. This shows you exactly how many users hit the milestone that matters.
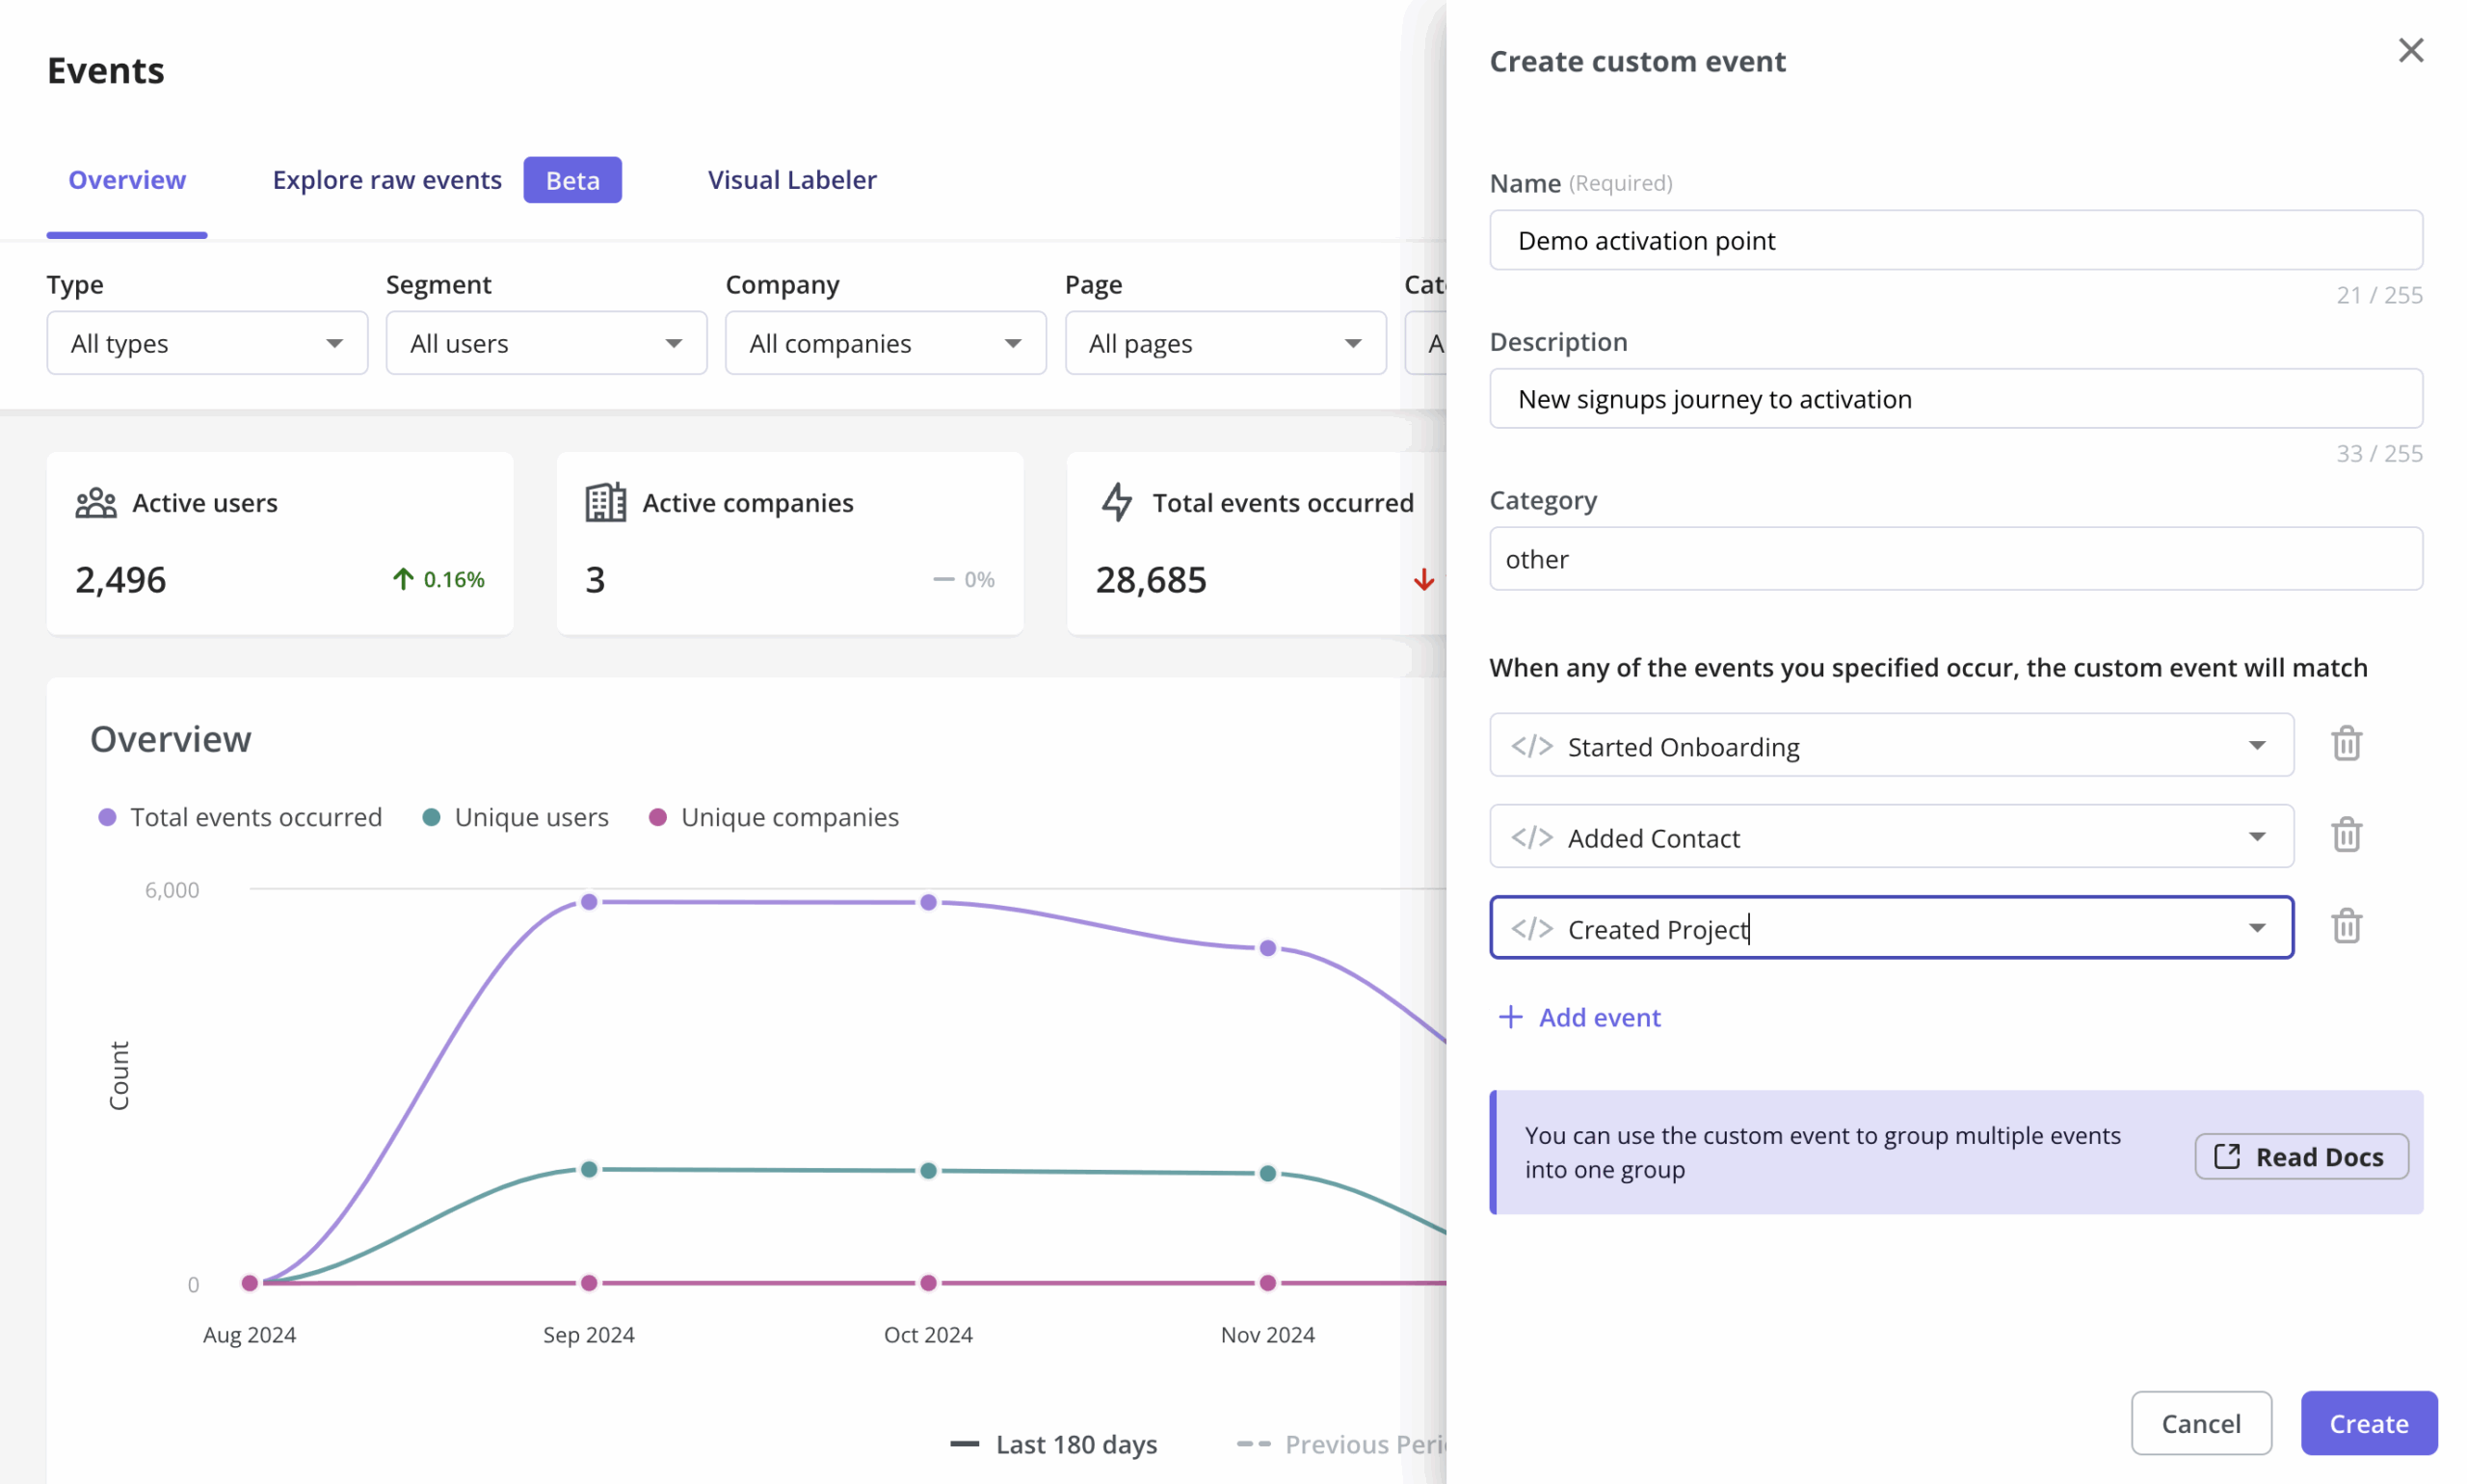
This grouped-event capability is something Pendo currently doesn’t offer.
Pros and cons of using Userpilot for product analytics
The pros include:
- ✅ Supports web and mobile apps.
- ✅ Code-free auto-captured events and session replays.
- ✅ Integrations with analytics tools and webhooks.
- ✅ A/B testing for in-app experiences you build.
- ✅ Detailed analytics for checklists and resource center modules.
- ✅ Feedback features, including NPS surveys and analytics.
How about the downsides?
- ❌ Too expensive for really small startups.
Userpilot pricing
We give you a 14-day free trial (no card required) and a demo so you can test product analytics end-to-end before you commit.
Plans are tiered by MAUs and split into Starter Plan, Growth, and Enterprise:
More specifically,
- Starter — from $299 / month (billed annually). Designed for small teams (up to ~2,000 MAUs). Includes in-app engagement, segmentation, basic product analytics and usage trends, and NPS/surveys. This is enough to measure core activation and early funnels without a heavyweight stack.
- Growth — custom pricing. This is the analytics tier most product teams pick. Growth adds advanced product analytics (funnels, paths, retention), event autocapture/retroactive events, richer segmentation, and the ability to build custom dashboards. Session replay and mobile engagement is available as an add-on for Growth customers (so you don’t have to pay enterprise prices just to get recordings).
- Enterprise — custom pricing. For large orgs, we add premium integrations, data warehouse syncs, SAML/SSO, security audits, and custom SLAs. This is priced case-by-case.

So, Pendo or Mixpanel for product analytics?
There’s no clear winner in the Pendo vs Mixpanel duel. Mixpanel’s analytics are more advanced than Pendo’s, but you need other tools to act on the insights. Pendo does provide tools like in-app guides, tooltips, and NPS surveys to act on data, but compared to a platform like Userpilot, Pendo’s engagement tools can be somewhat limited in flexibility and granularity, especially in its lower-tier plans.
Userpilot’s analytics features, engagement layer, feedback functionality, and attractive pricing plans make it a strong alternative to both.
Userpilot strives to provide accurate information to help businesses determine the best solution for their particular needs. Due to the dynamic nature of the industry, the features offered by Userpilot and others often change over time. The statements made in this article are accurate to the best of Userpilot’s knowledge as of its publication/most recent update on August 9, 2025.
About the author