
While Amplitude is a comprehensive behavioral analytics platform loved by many product teams, it does have some limitations that may be a dealbreaker for some companies. If you’re searching for Amplitude alternatives, this guide is for you!
In this article, we’ll go over the key features of Amplitude, weigh its pros and cons, and present compelling alternatives that may be better solutions for your business needs.
Let’s dive right in!
Try Userpilot Now
See Why 1,000+ Teams Choose Userpilot

Amplitude alternatives overview
- Amplitude Analytics is a product analytics platform best known for its superb event-tracking and digital analytics capabilities used in conversion optimization and customer retention.
- Amplitude comes with the following features: In-app events, cohorts & audiences, experimentation, and pathfinder.
- Amplitude offers four plans: Free, Plus ($49/month), Growth (Custom pricing), and Enterprise (Custom pricing)
- Amplitude comes with several drawbacks: A steep learning curve, no user engagement layer, and a lack of automated event tracking.
- Userpilot is a product growth and digital adoption platform for enterprises designed for user onboarding, feature adoption, and customer churn reduction.
- Google Analytics is a freemium website analytics software offering users robust customer analytics capabilities.
- Pendo is a digital experience optimization platform for product analytics of web and mobile apps.
- Mixpanel is a digital analytics platform equipped with impressive data visualization capabilities.
- Heap is a digital analytics platform with tools that facilitate digital experiences, user journeys, conversions, feedback, retention, and other tools.
- Hotjar is a user behavior analytics platform known for its heatmaps and session recording functionality.
- Crazy Egg is a behavior analytics software with customer analysis tools like heatmaps, scroll maps, etc for conversion rate optimization.
- Adobe Analytics is a product insights platform for improving customer experiences using AI for its predictive and marketing analytics.
- Sign up for a free Userpilot demo and start reaping the rewards of user journey analytics made easy!
What is Amplitude?
Amplitude is an event-based analytics tool for growth teams, providing insights into user behavior and customer journeys.
Amplitude helps customers guide their product strategy, improve engagement and conversion rates, and increase user retention.
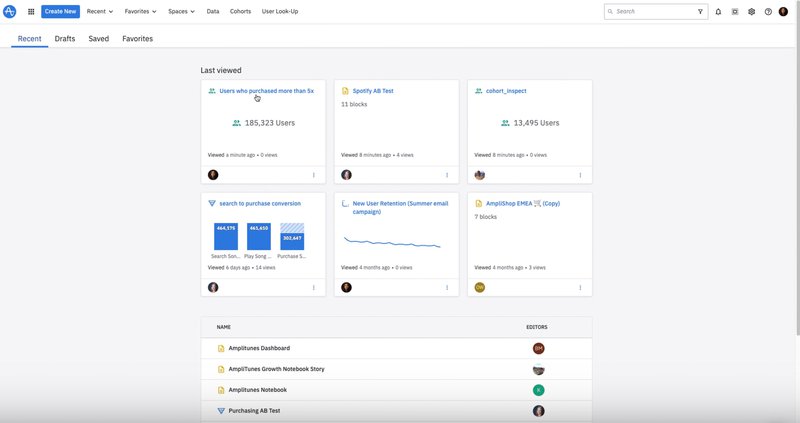
Amplitude features and functionalities
Amplitude Analytics possesses powerful features that make it a popular choice for many companies.
Some of its most notorious features include:
- Cohorts and audiences: Cohorts in Amplitude are groups of users who share specific traits or behaviors. Amplitude allows for two types of cohorts: predictive and behavioral. Behavioral cohorts are defined based on user actions within a specific time period. Predictive cohorts use past behavior to predict future behavior by creating a mathematical model based on hundreds of behavioral signals, including events, event properties, and user properties.
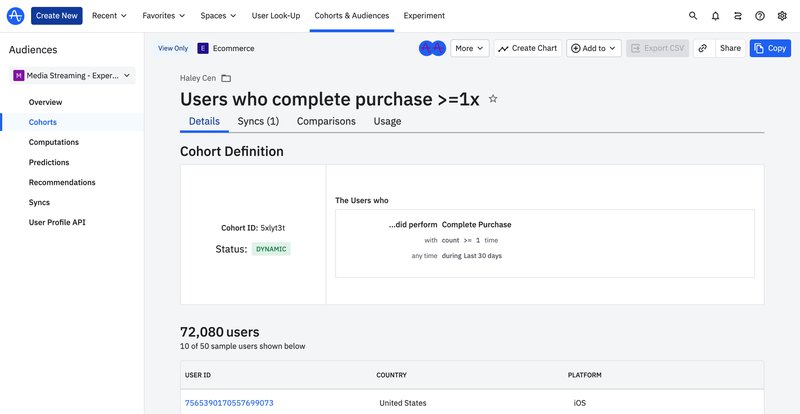
- Event segmentation: Any action users take within your product is called an ‘event’. This could be something as simple as pressing a button or making a payment. With Amplitude, you can create charts based on specific event properties. For example, you can identify commonly performed events over a selected period, frequency, and the number of unique users who perform a specific event or understand which user segments are most likely to trigger certain events.
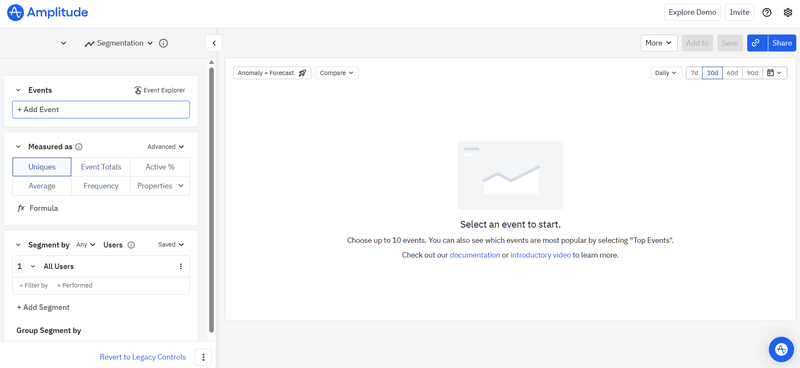
- Pathfinder: Amplitude’s pathfinder visualizes all the events customers participate in and even exhibits the sequences of events your customers take during a specific period. For example, you can examine the top common paths that new users can take to convert into paying customers.
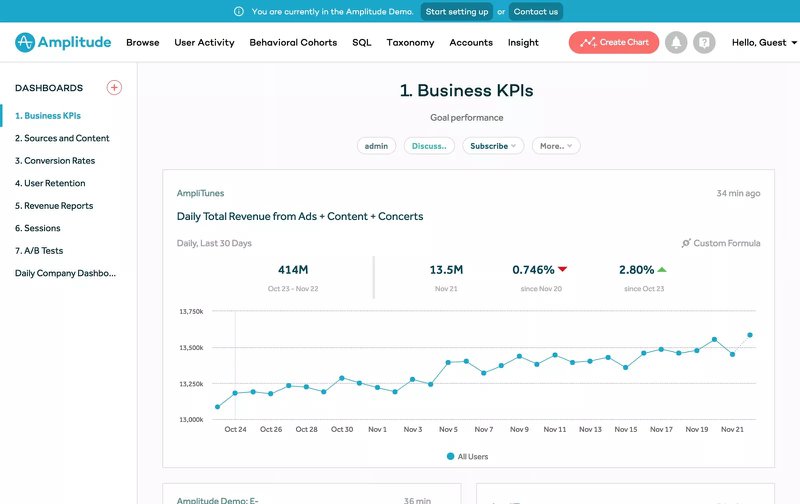
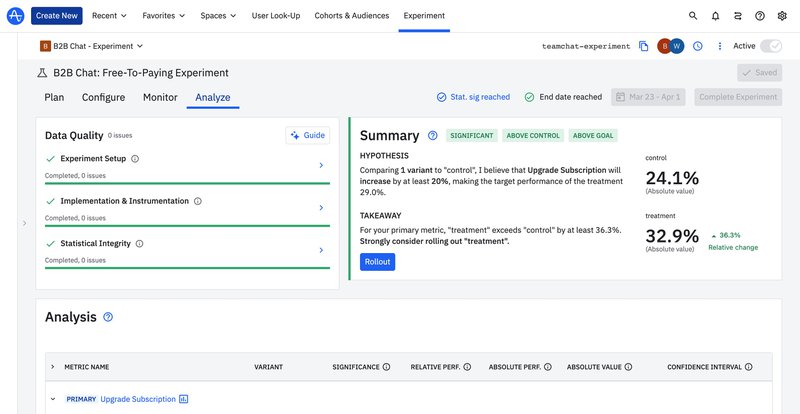
- Experimentation layer: Amplitude lets you run tests to improve onboarding, reduce friction, launch new features, or see how they affect your KPIs. Also, the progressive feature delivery capabilities help you plan upcoming features, stage them for your beta testers, show them to a fraction of your user base, or even target specific segments with them. This will help you gauge how your audience responds to new features before a full launch.
Pricing
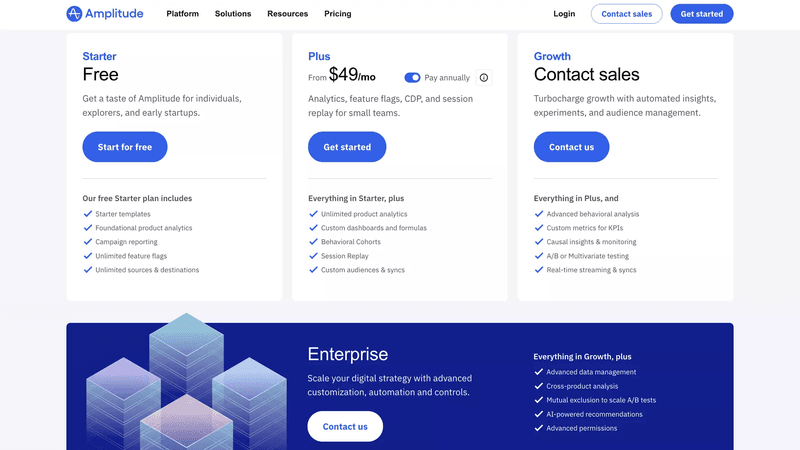
Amplitude has a freemium pricing model with a free plan and 3 paid plans. Although it doesn’t publicly disclose the price of the premium plans, we’ll help you get an idea about the price range.
The Amplitude pricing structure is as follows:
- Starter – Free plan.
- Plus – $49 per month.
- Growth – This paid plan can cost you $995+/monthly, depending on your demands. You can request a demo to get the exact amount and see how it works.
- Enterprise – It starts at $2,000+ per month, and you can contact sales to decide on the scale and price.
Why may you need an Amplitude alternative?
Despite the plethora of powerful analytics tools, Amplitude comes with its own set of drawbacks. A few that spring to mind are:
- Steep learning curve. Amplitude is a complex tool meant to be used in enterprises with dedicated departments for product management. If you don’t have in-house analysts, you’ll probably find it overwhelming to set up and maintain Amplitude.
- No user engagement layer. Despite its sophisticated analytics features, Amplitude doesn’t have built-in functionalities to turn product data into actions. You’ll need a separate product adoption platform to create product experiences and drive user engagement based on Amplitude’s analytics.
- Lack of automated event tracking. Amplitude doesn’t automatically track events like clicks, page views, and swipes. You have to set up the events you want to track manually and you also need to update them after every product update to maintain consistency.
- Lack of data connectivity. Amplitude lacks integrations with some major data warehouses, making it difficult to move data in and out of it.
Top 8 Amplitude alternatives for user behavior analysis
If Amplitude is not the right tool for your company, no worries, there are many other tools out there.
Here are the top 8 Amplitude alternatives for customer behavior analytics.
1. Userpilot
Userpilot is a product growth platform specializing in user onboarding and product analytics.
The platform is geared towards mid-size SaaS companies and enterprise businesses.
Main features
Here’s a brief overview of Userpilot’s customer analytics features:
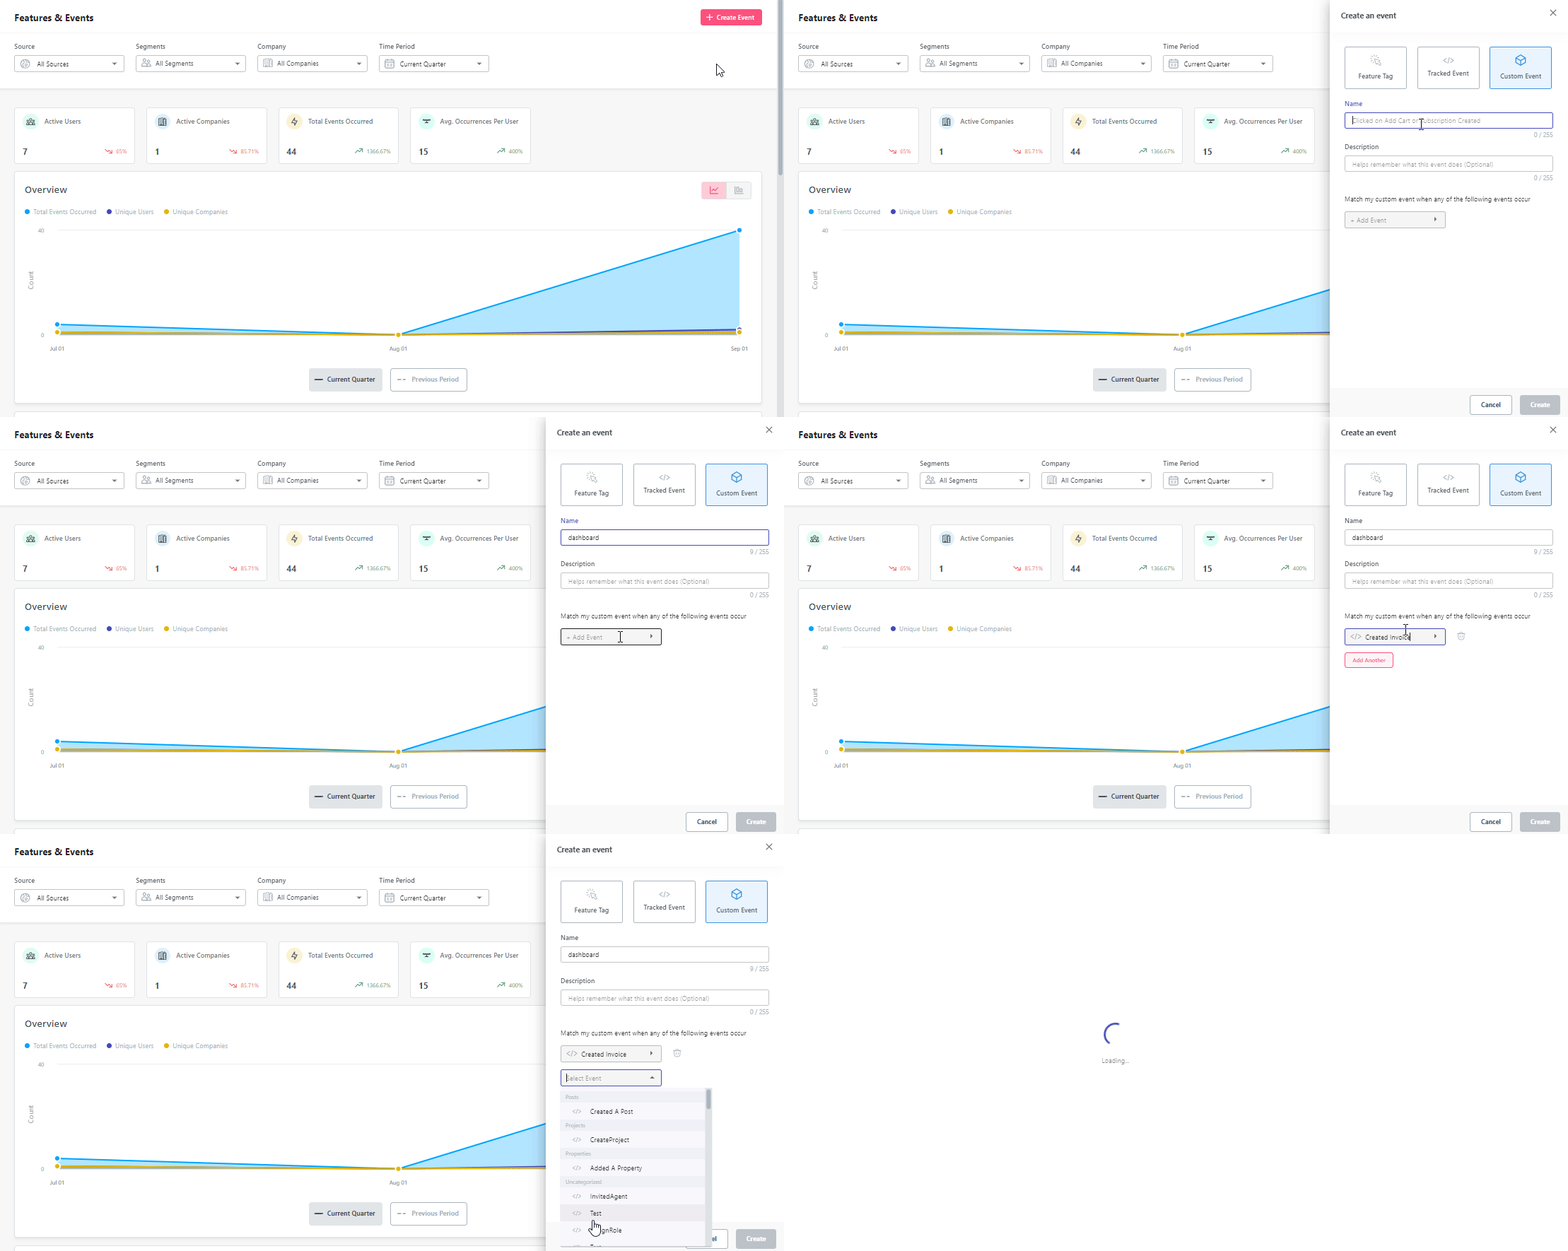
- Custom event tracking: With custom event tracking, teams can create their own events to track in Userpilot. Track relevant milestones in a customer journey that reflect desirable user behavior, like downloading a Chrome extension, and then monitor how many users behave in that manner.
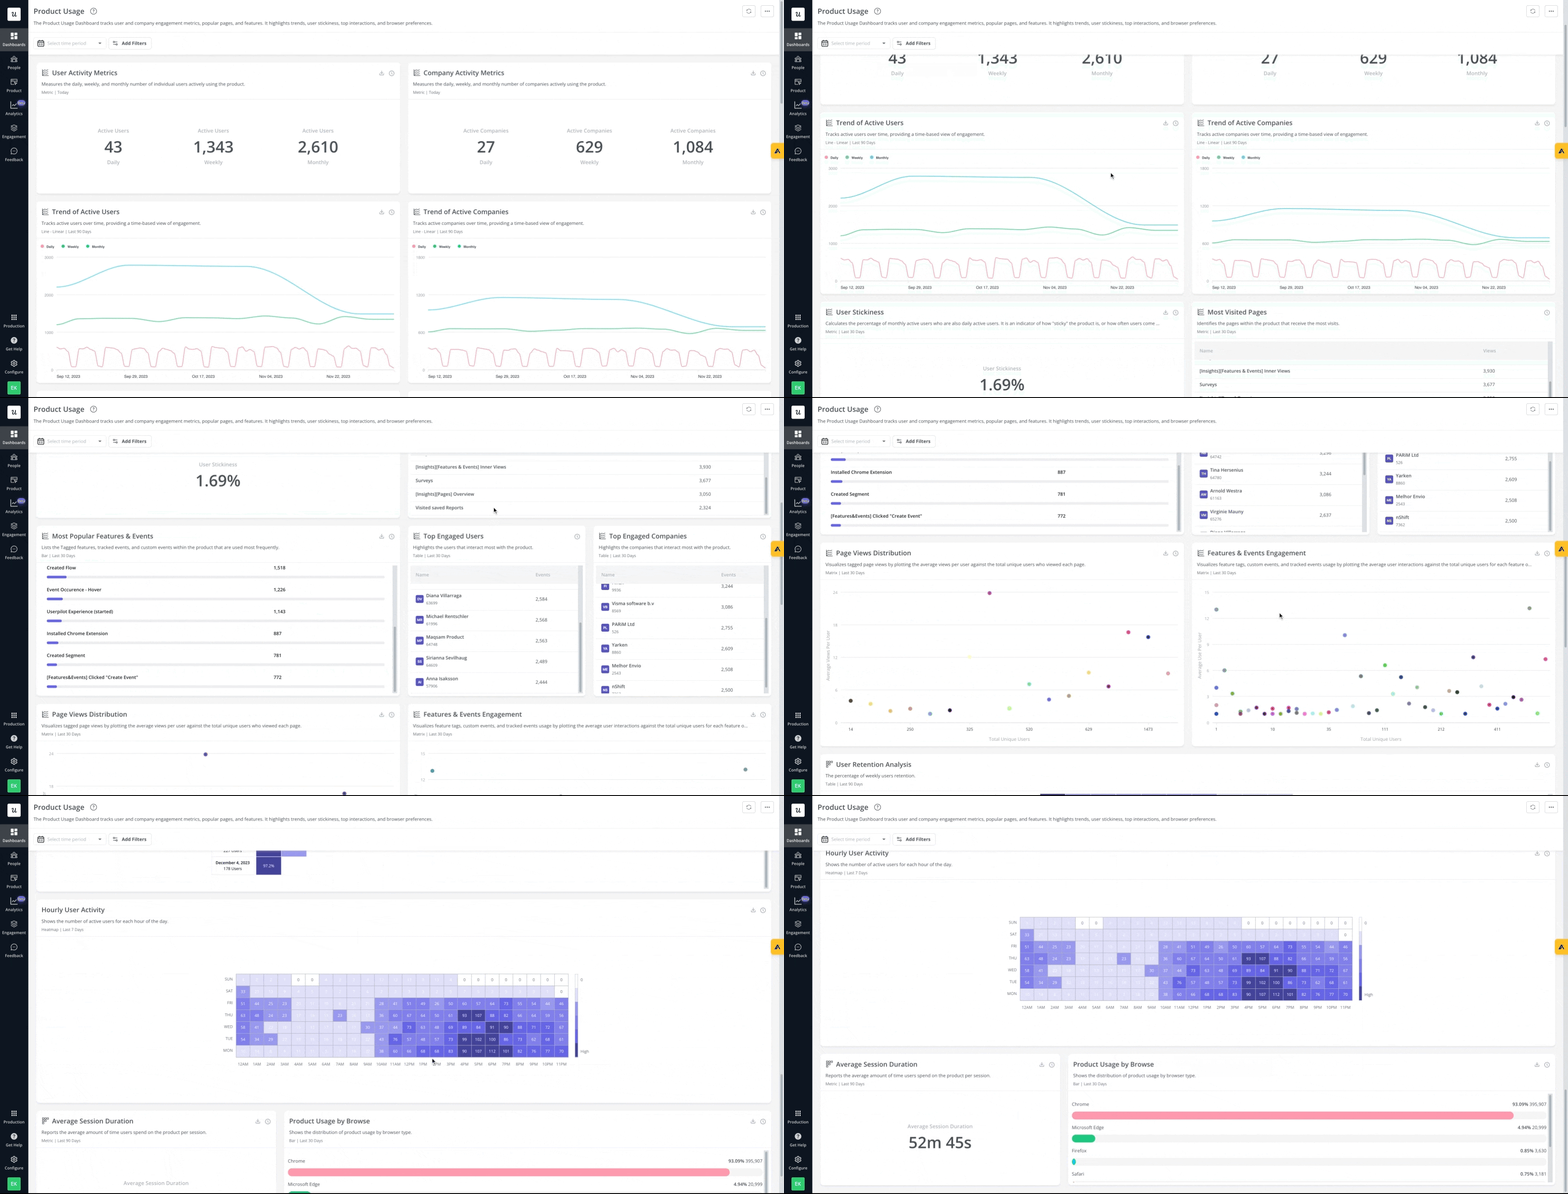
- Analytics dashboards: Userpilot’s various dashboards enable you to track product usage metrics such as the number of active users, sessions, average session duration, and feature adoption rate from a single view.
- Funnel analysis: Userpilot’s funnel analysis tool will track how users progress through different user funnels, enabling you to discover friction points in the user journey and optimize them to improve the user experience.
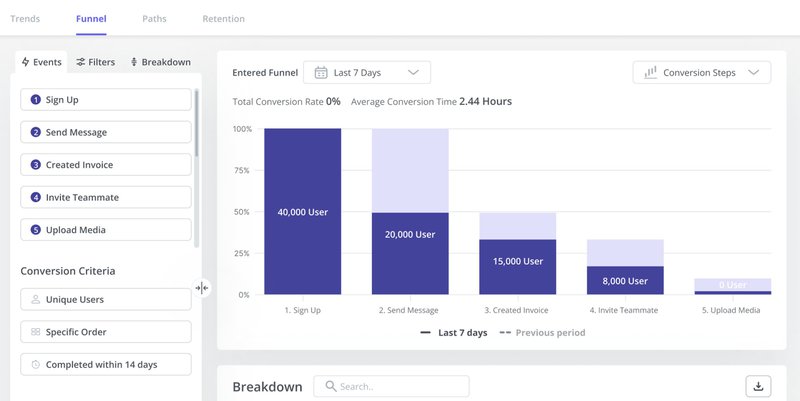
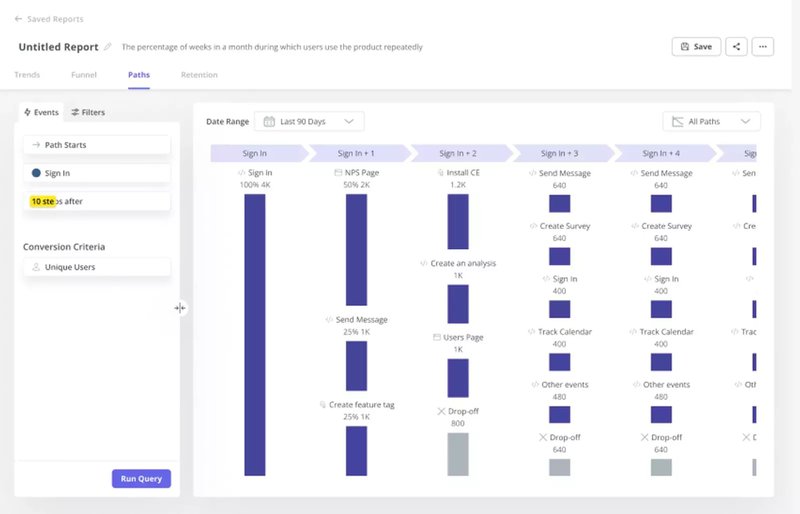
- Path analysis: Userpilot’s Paths are a user behavior analysis report mapping out user actions leading up to or following an event. This enables you to analyze the efficacy of different paths and discover the best path users take the most.
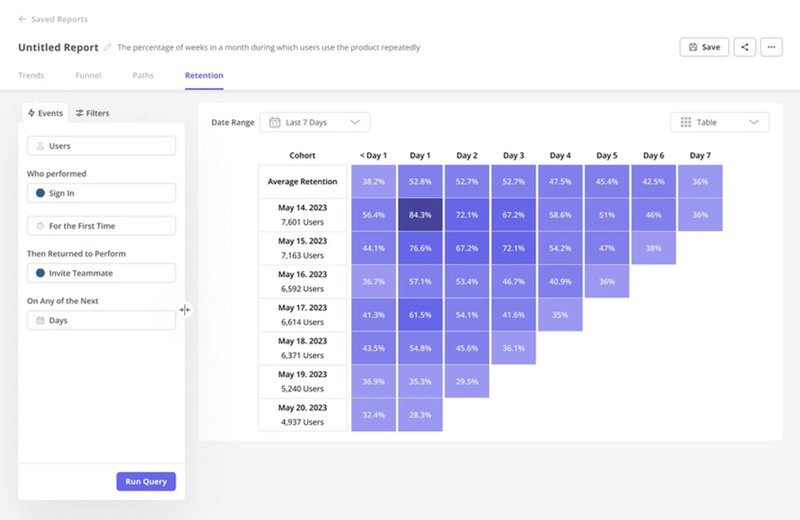
- Retention tables: You can create cohort tables to monitor retention rates among users over time. By doing this, you can discover trends and patterns among user groups and find out the factors that cause stick out.
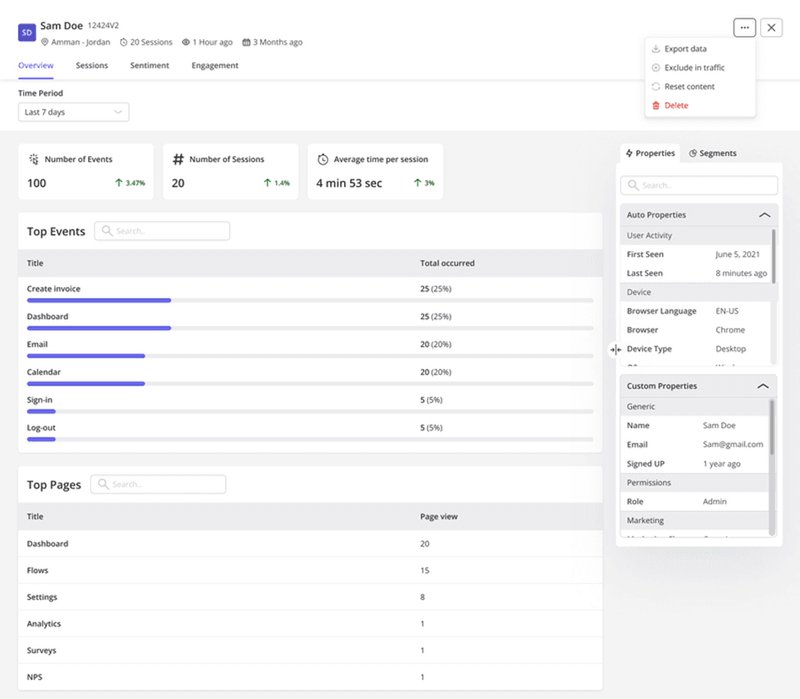
- Customer profiles: With the customer profiles tool, you gain granular insights into user behavior. You can zoom in and investigate the interactions of each user as well as their sentiment change over time.
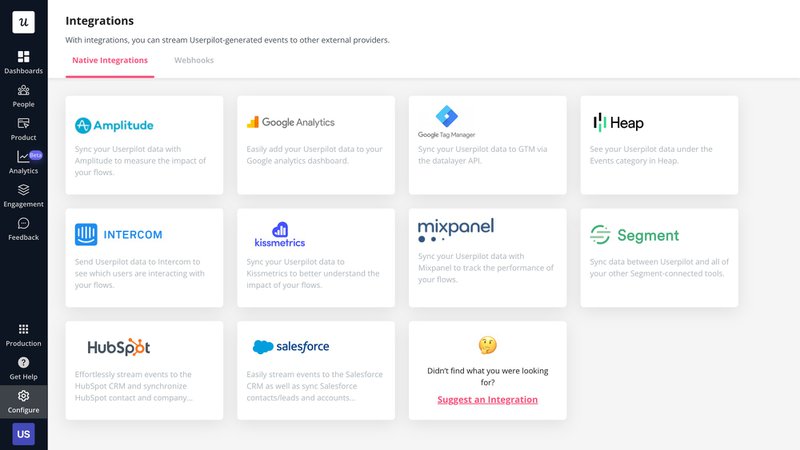
Data Integrations: Userpilot connects with many industry-leading tools and allows for easy data exchanges and nuanced data analysis. Currently, Userpilot supports integrations with:
- Google Analytics
- Mixpanel
- Kissmetrics
- Heap
- Amplitude
- Google Tag Manager
- Segment
- Intercom
- HubSpot (two-way)
- Salesforce (two-way)
Pricing
Userpilot offers flexible pricing based on your monthly active users (MAUs). Plans start at $299 per month for smaller teams and scale as your user base grows.
Below are the pricing tiers you can choose from:
- The Starter plan begins at $299/month (billed annually) for up to 2,000 monthly active users. It includes in-app user engagement, usage trend analysis, NPS surveys, and essential product analytics—ideal for mid-market SaaS teams getting started.
- The Growth plan offers custom pricing and adds advanced analytics, retroactive event auto-capture, in-app surveys, session replay, and more. It’s the most popular choice for growing teams that need deeper insights and scale.
- The Enterprise plan offers custom pricing and includes everything in Growth, plus bulk data handling, custom roles and permissions, SOC 2 Type 2 compliance, and enterprise-level support.

2. Google Analytics
Google Analytics is a popular freemium analytics service provided under the Google Marketing Platform.
Designed for individuals and small businesses, it tracks and reports website and mobile app traffic, user engagement events, and conversion data.
Key features
Here’s a summary of Google Analytics’s analytics tools:
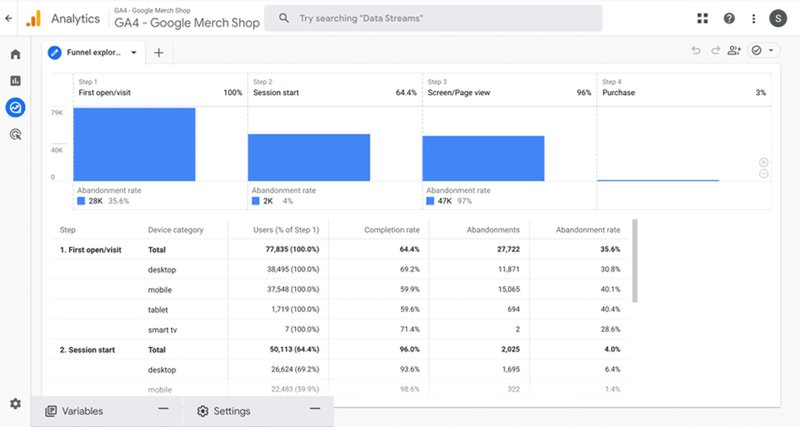
- Real-time analytics. Google Analytics uses real-time data to generate insights. This ensures data freshness, making data-driven decisions more relevant and impactful.
- Predictive analytics. With its machine learning model, Google Analytics takes customer data to build a predictive model of what users will likely do next.
- Engagement reports. The events report takes data from event tracking efforts to show a detailed view of user interactions. Conversion reports show the effectiveness of marketing strategies, and screen reports indicate the landing pages that users interact with the most.
Pricing
Google Analytics employs a freemium pricing model.
They offer their basic version for free while their premium version with advanced features (Google Analytics 360) is available for enterprises. You can contact sales for more information.
3. Pendo
Pendo is a digital experience optimization platform for both web and mobile apps.
Key features
Here’s a rundown of Pendo’s product analytics tool functionalities:
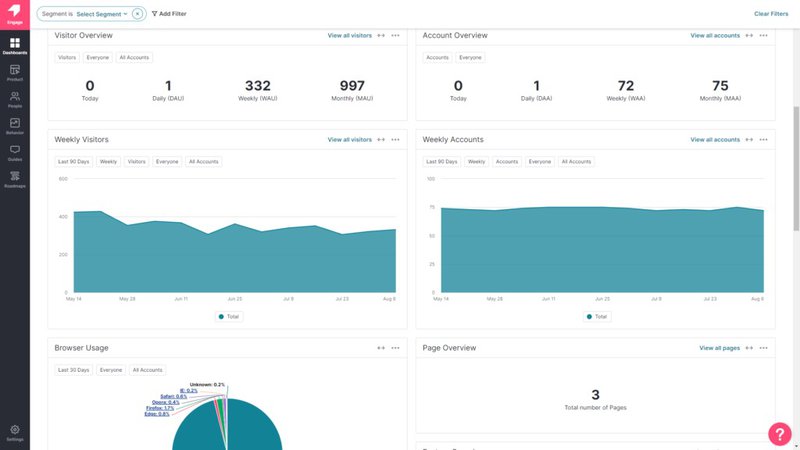
- Multi-platform analytics: Pendo can track product analytics data on both web and mobile apps. This provides a more holistic view of how users interact with your product on different platforms.
- Pendo paths: One great thing about Pendo paths is that when users perform the same actions on multiple occasions, Pendo’s analytics algorithm will automatically remove the duplicates and show the user path as a single occurrence.
- Retention dashboard: Pendo’s retention analytics dashboard lets you see cohort retention data from month to month. You can also toggle between visitors and accounts, switch between weekly or monthly views, and measure retention for specific segments.
Pricing
Pendo operates a quote-based model for all its pricing tiers and offers a free plan with limited features.
4. Mixpanel
Mixpanel is a digital analytics platform equipped with impressive data visualization capabilities.
Key features
Here’s a brief overview of Mixpanel’s digital analytics platform tools:
- Warehouse connectors. Mixpanel’s warehouse connectors tool makes exchanging data with other industry-leading tools swift and seamless. Connect your data warehouse with any analytics tool from other tools like Userpilot without any coding required.
- Cohorts segmentation. Group your customers into cohorts and analyze their impact on your product growth.
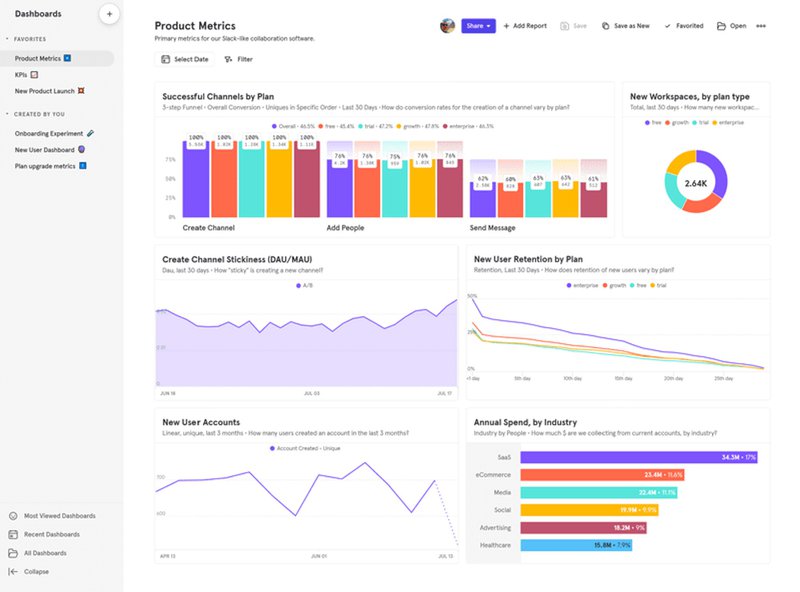
- Dashboards. Mixpanel provides teams with dashboards that visualize behavioral data into easy-to-read reports. You can also take advantage of dashboard templates that are organized by industry, lowering the barrier for non-technical teams.
Pricing
Mixpanel offers two paid plans: Growth, priced at $20/month, and Enterprise, the price available upon request. Mixpanel also offers a free plan.
For startups founded less than five years ago, Mixpanel offers the first year of their Growth plan for free.
5. Heap
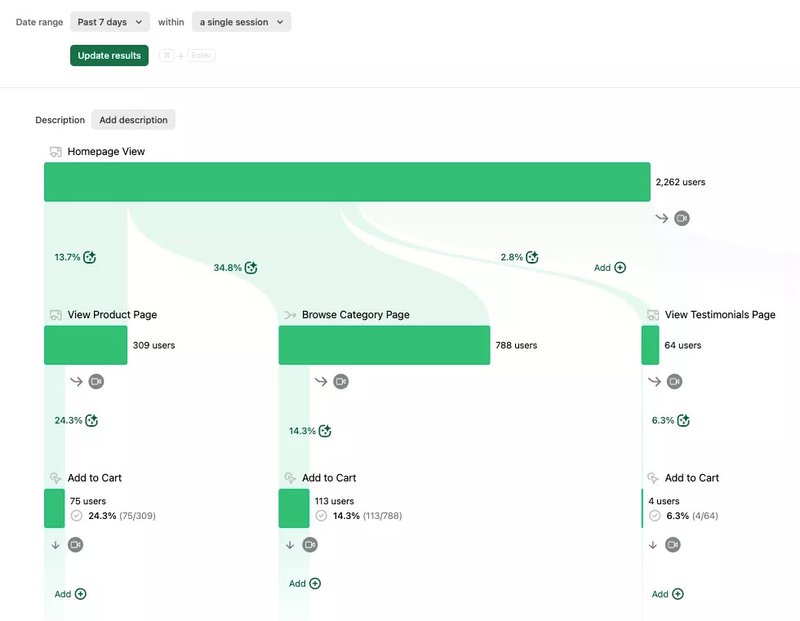
Heap is a product analytics platform that allows customer success teams, marketers, and product managers to track user interactions with the product across all touchpoints in the user journeys.
Key features
Here’s a summary of Heap’s digital analytics platform tools:
- Event auto capture. Data collection is made robust and effortless with Heap’s auto-capture tool. With just a single line of code, start tracking events like clicks, views, swipes, and more. This works for multiple platforms, whether website or mobile focus.
- Heatmaps and Session replay. Heap is well-known for its digital experience analysis tools. The heatmaps tool presents qualitative reports depicting areas website traffic gravitates towards, while the session replay tool replicates user actions that reveal friction points, hot zones, etc.
- Journeys. Journeys is an advanced tool that combines the functions of funnel and path analysis tools. Follow along user journeys and discover untracked events that figure in your conversion funnel.
Pricing
Heap operates a quote-based pricing model across all payment tiers. Fortunately, they offer a free plan and a 14-day free trial.
6. Hotjar
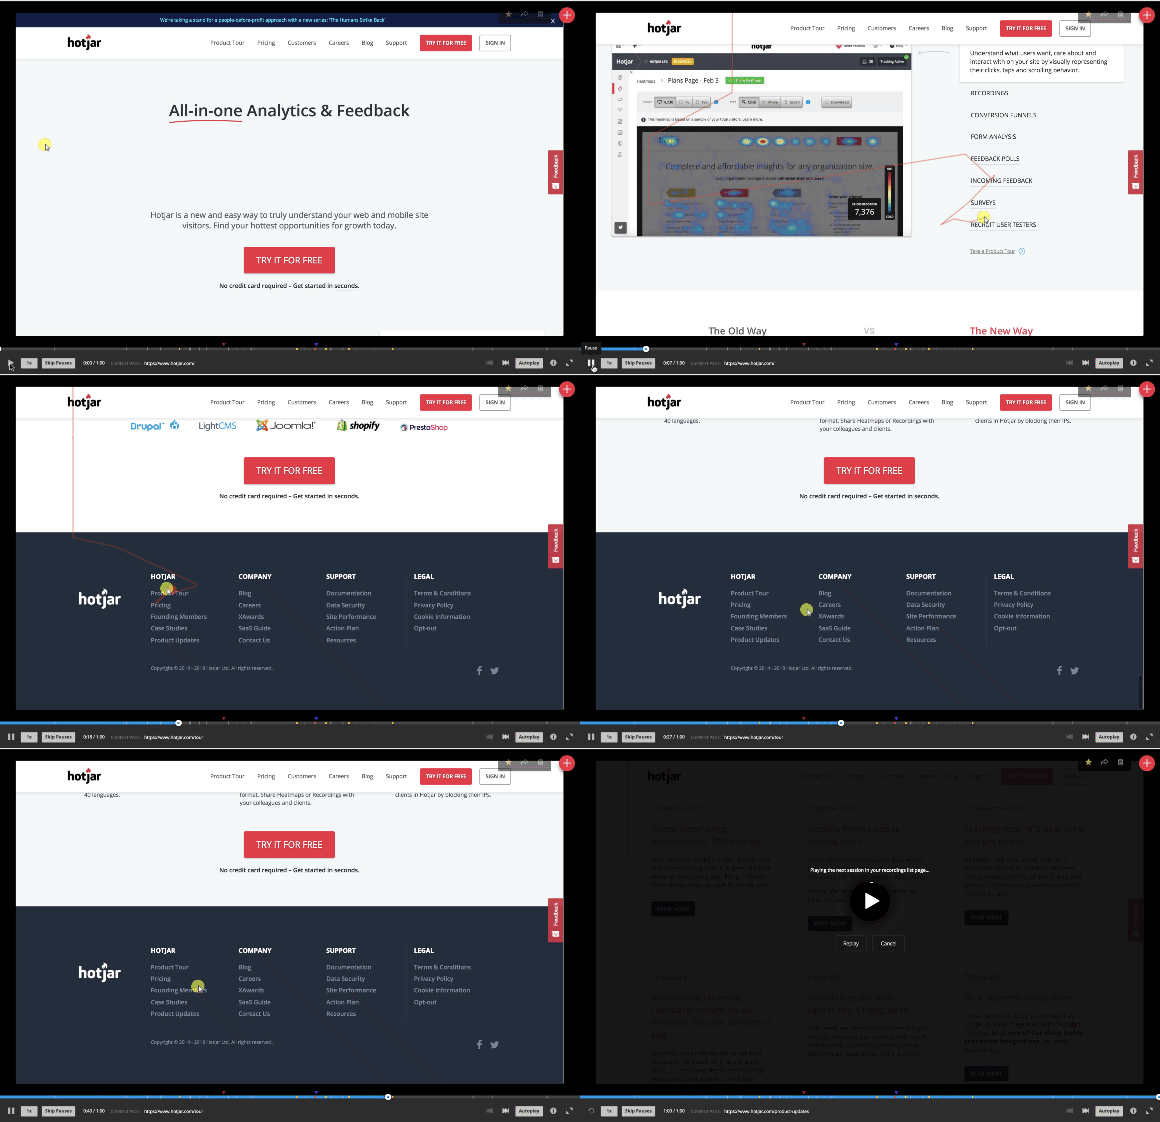
Hotjar is a customer behavior analytics platform known for its heatmaps and session recording functionality.
Key features
Here’s a rundown of Hotjar’s customer behavior analytics platform tools.
- Session recordings. Hotjar’s session recordings are renderings of real actions taken by visitors as they browse a website. Coupled with other qualitative research methods, they can help you discover rage clicks or other user frustrations.
- Heatmaps and scroll maps. The heatmaps and scroll maps tools create a visual report that reflects user behavior as accurately as it can. Heatmaps show website visitors’ areas of interest, and scroll maps show how far users scroll.
- Highlights. Troubleshooting and optimizing your product can be cumbersome without proper context. The highlights tool lets team members add contextual notes to elements in the report, giving information about how to troubleshoot.
Pricing
For its heatmaps and session recordings tools, bundled under its Observe product, Hotjar offers two paid plans (starting with Plus’ $32/month billed annually, up to Business’ $56/month billed annually) that also include the basic plan for its Ask and Engage products.
It also offers a free plan called Basic and a 15-day free trial.
7. Crazy Egg
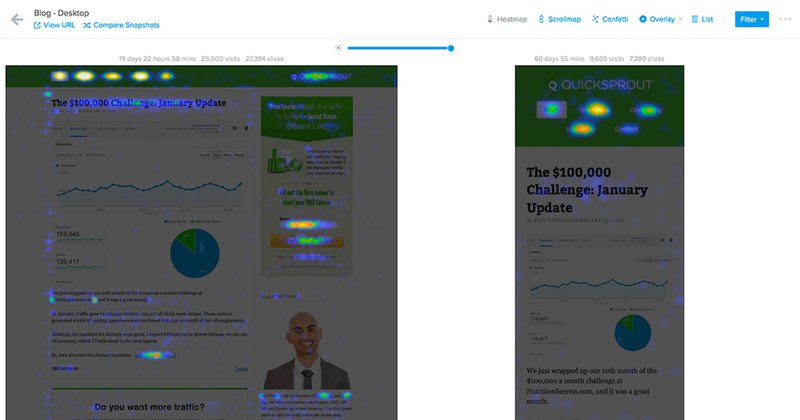
Crazy Egg is a behavior analytics software with customer analysis tools like heatmaps, scroll maps, etc for conversion rate optimization.
Key features
Here’s a brief overview of Crazy Egg’s behavior analysis tools:
- Traffic analysis. Crazy Egg’s website visitor tracking tools allow you to discover your top 10 traffic sources and analyze the performances of your marketing campaigns from different platforms.
- Snapshots. Snapshots is Crazy Egg’s premier heatmap tool. As one of its key features, snapshots give you five visual reports for a single snapshot. Get common reports like its heatmaps and scroll maps, or utilize the confetti report that doubles as a cohort analysis tool.
- A/B testing. Crazy Egg’s A/B testing tool comes with a user-friendly interface and AI to handle the business process. The A/B testing tool runs the experiment and immediately switches the live website to the most effective variant in an instant.
Pricing
Crazy Egg offers three paid plans (starting at Standard’s $49/month billed annually up to Enterprise’s $249/month billed annually) and a 30-day free trial.
8. Adobe Analytics
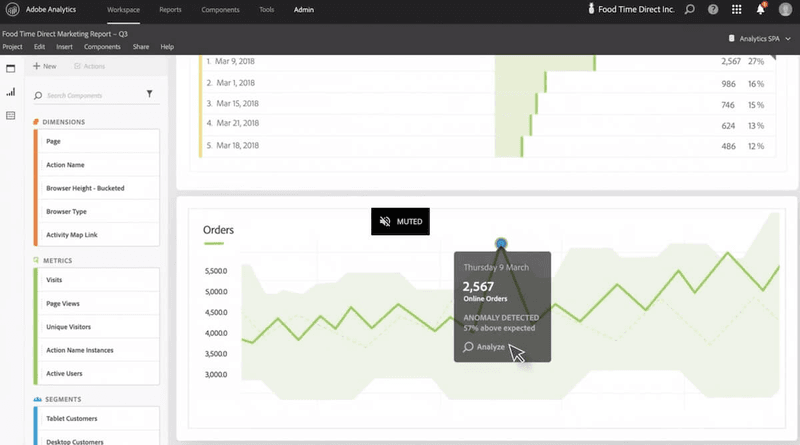
Adobe Analytics is a powerful tool for businesses to gain insights into customer data, personalize experiences, and optimize experiences.
Key features
Here’s a summary of Adobe Analytics’s product insights tools.
- Multichannel data collection. Adobe Analytics can collect data from a multitude of channels, from email, marketing campaigns, websites, mobile applications, and much more. Find the entirety of your collected data in one system, reducing the need for data silos.
- Attribution analysis. The attribution analysis tool from Adobe Analytics digs into user data to determine which marketing campaigns contributed to user conversions.
- AI-powered prediction analysis. With powerful machine learning and advanced statistical modeling, it offers teams access to AI-empowered analytics. Use AI to dig into your massive data set and find patterns and trends your team couldn’t have seen.
Pricing
Adobe Analytics operates a quote-based model for all of its products. Additionally, and albeit unfortunately, they do not offer free plans or free trials for would-be users.
Conclusion
Amplitude is an amazing product for customer behavior analysis and conversion rate optimization. However, its high technical knowledge requirement will make businesses think twice about adopting it.
Thankfully, there are several alternatives that get the job done, and then some!
Are you ready to see Amplitude’s alternative Userpilot in action? Sign up for a free demo and start reaping the rewards of customer journey analytics!


