Comparing 12 Mobile App Analytics Tools: Features, Pricing, and More


When you’re building a mobile product, data is your lifeline. Whether for tracking feature adoption or spotting drop-off points, the right analytics tool can make or break your growth.
But if you ask me, there’s simply no one-size-fits-all solution. Some tools are great for marketers, and others are for product or development teams. What works for a startup might not scale for an enterprise.
So, instead of listing tools for mobile app analytics randomly, I’ve grouped them into three categories here: cross-platform analytics, marketing attribution, and performance monitoring. Hopefully, this post will help you find the best match for your goals, stack, and budget!
Shortlist of top mobile app analytics tools
| 🧰 Tool | 🎯 Best For | ✨ Main Features | 💸 Pricing | ⚠️ Consider If |
|---|---|---|---|---|
| Mixpanel | Detailed custom event tracking | Funnels, cohorts, retention, dashboards | Free for 1M events/mo; usage-based plans | Setup complexity and steep learning curve |
| Amplitude | Predictive analytics and segmentation | Pathfinder, Compass, funnels, cross-device tracking | Free for 50K MTUs; Plus from $49/mo | Pricing can scale quickly with data |
| CleverTap | Retention and lifecycle campaigns | Segmentation, in-app messaging, real-time analytics | 30-day trial; from $75/mo | Slow customer support reported |
| AppsFlyer | Mobile attribution & ad campaign tracking | Install tracking, ROAS, deep linking, fraud protection | Free plan; paid from 7¢/conversion | Limited product analytics capabilities |
| Adjust | Privacy-first attribution and fraud detection | Fraud prevention, SKAdNetwork, audience builder | Free up to 1,500 attributions; custom plans | UI delays and report lag reported |
| AppMetrica | Free full-suite analytics & attribution | Attribution, crash reporting, cohort analysis | Free up to 100M events; paid from $905/mo | Limited integrations beyond Yandex |
| Firebase (Google Analytics) | Free mobile analytics inside Google ecosystem | Attribution, real-time tracking, segmentation | Free | High-level data; not granular product analytics |
| Sentry | Crash diagnostics and error reporting | Real-time errors, performance metrics, session data | Free for 1 user; from $26/mo for teams | Lacks product-level engagement insights |
| New Relic Mobile | Enterprise performance and version monitoring | Crash logs, API latency, app version comparison | Free for 100GB/mo; custom enterprise plans | Best when combined with backend monitoring |
| Instabug | Crash reporting with user feedback | Crash logs, surveys, annotated bug reports | 14-day trial; from $249/mo | React Native users may face integration limits |
| UXCam | Visual diagnostics with session replay | Session replays, heatmaps, rage taps, journey maps | Free for 3K sessions; custom pricing | Less focused on traditional metrics dashboards |
| Userpilot | Cross-platform product usage analytics | Autocapture, session replays, in-app messaging | 14-day free trial; from $299/mo (billed anually) | May not suit early-stage startups |
Top mobile analytics tools for cross-platform insights
If your app lives on both mobile and web, you’ll want mobile analytics that give you the full picture. These tools help you track user behavior across platforms, so you can see what’s working where and how users move between them. Here are a few that I think do that well.
Mixpanel for event-based mobile analytics
🏆 Best for: Teams that want detailed, customizable event tracking.
💰 Pricing: Free plan available (up to 1 million events/month); Growth and Enterprise plans are usage-based.
🌟 G2 rating: 4.6/5 based on 1,100+ reviews.
⚠️ Consider if: You don’t have time to set up custom events. Mixpanel is powerful, but there’s a steep learning curve.
If you’re looking for an analytics vendor that offers full flexibility in how you track user behavior data, I’d say Mixpanel is a solid choice. It’s especially useful if you want to go beyond basic metrics like daily active users or bounce rates, and start analyzing feature usage, event flows, and retention patterns across your mobile app.
Mixpanel analytics can be tedious to set up, but they’re great for teams who want to deeply understand which actions drive app downloads, retention, and conversions across platforms.
Main features:
- Custom event tracking: Define exactly what you want to measure in your mobile app, with no rigid templates or limits on data points.
- Funnels: See where users drop off in key flows like onboarding or checkout.
- Retention reports: Lets you track how often users return after their first visit.
- Cohorts: Group users based on behavior (like “opened app 3x this week”) and analyze them over time.
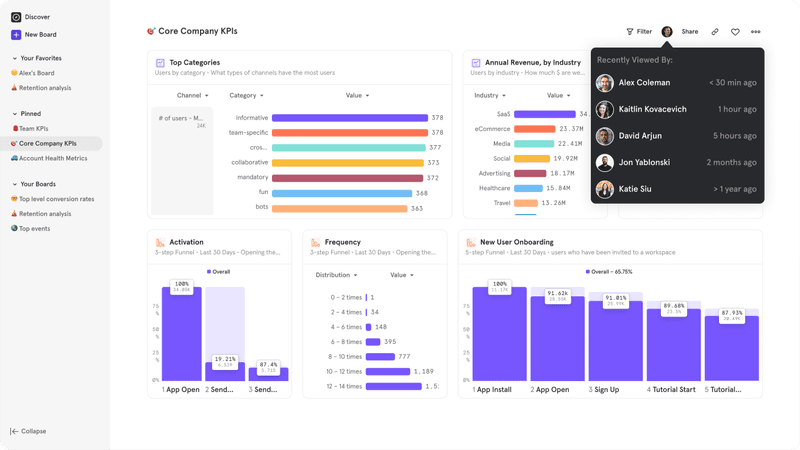
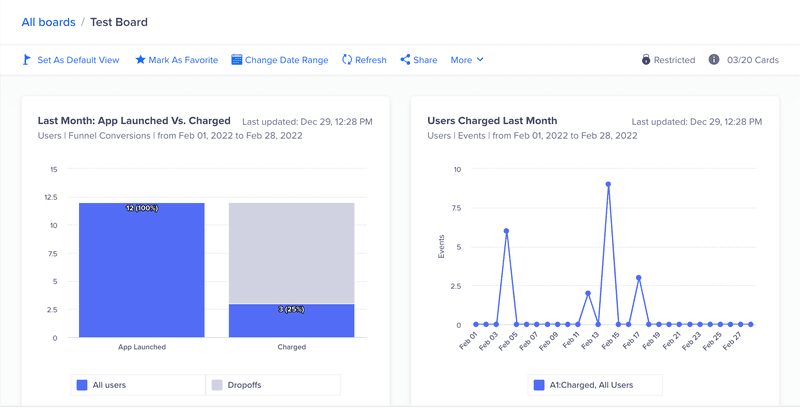
- Boards: Build custom dashboards on Mixpanel to keep your most important mobile metrics front and center.
Amplitude for predictive mobile analytics
🏆 Best for: Teams who want to spot patterns and predict what keeps users around.
💰 Pricing: Free plan available (up to 50K MTUs). The Plus plan starts at $49/month, while Growth and Enterprise plans are custom-priced.
🌟 G2 rating: 4.5/5 based on 2,200+ reviews.
⚠️ Consider if: You’re not ready for enterprise-level investment. Pricing can scale quickly depending on your data volume.
Amplitude stands out for its predictive analytics insights and deep behavioral segmentation. It doesn’t just show you what users did, but also helps you forecast what they’re likely to do next. That makes it especially powerful for growth teams running experiments or A/B tests, where knowing what drives retention or churn can guide smarter decisions. It’s a top choice when it comes to analytics for enterprise companies that want to go beyond tracking and into proactive optimization.
Main features:
- Behavioral cohorts: Segment users based on in-app behavior and compare outcomes.
- Pathfinder: Visualize the most common paths users take in your mobile app.
- Funnels: Identify where users drop off in multi-step flows (like sign-up or feature adoption).
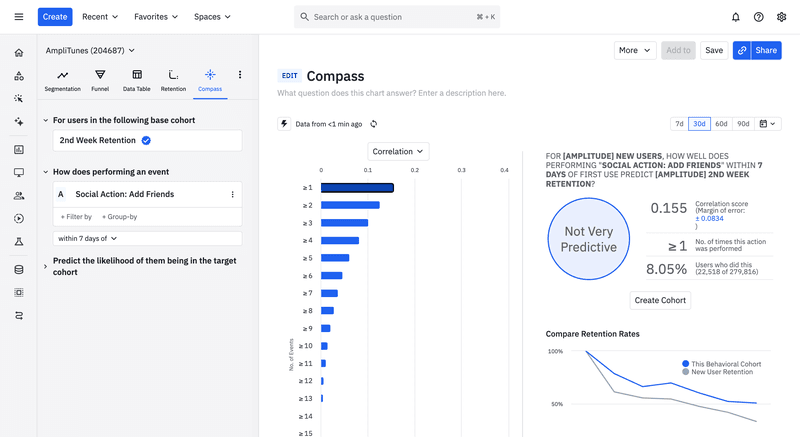
- Predictive Compass: Spot which behaviors lead to retention or conversions, and prioritize them.
- Cross-platform profiles: Track how customers switch between mobile and web to get a complete view of engagement.
CleverTap for engagement and retention analytics
🏆 Best for: Driving user retention with lifecycle campaigns and in-app messaging.
💰 Pricing: 30-day free trial. No free plan; pricing starts at $75/month.
🌟 G2 rating: 4.6/5 based on 600+ reviews.
⚠️ Consider if: You need quick answers from support. Users report long wait times and slow issue resolution.
In my opinion, CleverTap is especially useful for mobile app retention and lifecycle marketing. For example, you can segment at-risk users and retarget them with multichannel messaging, from emails, push notifications, to SMS. It’s a solid pick if your product and growth teams work closely and want one place to both analyze behavior and engage users.
Main features:
- User segmentation: Group users by actions, frequency, or lifecycle stage to trigger personalized messages.
- Retention analysis: Understand what keeps users coming back and identify early churn signals.
- In-app messaging and push notifications: Create behavior-based campaigns to boost engagement in real time.
- Funnels and journeys: Visualize drop-offs and optimize flows like onboarding or feature adoption.
- Real-time analytics: Monitor key user actions and engagement metrics as they happen.
AppsFlyer for mobile attribution and marketing analytics
🏆 Best for: Tracking where installs come from and measuring campaign performance.
💰 Pricing: Free-for-life plan available. Growth plan starts at 7¢ per conversion, while Enterprise plans are custom-priced.
🌟 G2 rating: 4.5/5 based on 600+ reviews.
⚠️ Consider if: You also want product analytics. AppsFlyer focuses more on marketing performance than on in-app behavior.
If you’re running paid campaigns to drive installs, AppsFlyer is one of those tools I’d easily recommend. It’s made for mobile attribution and helps you answer all the big questions, like which ads are actually converting or where your customers are really coming from. It’s especially helpful if you’re on a growth or UA team and need clear, reliable data to prove what’s working (and what’s not).
AppsFlyer doesn’t dive deep into product usage, but if marketing performance and attribution are your main goals, it’s a strong choice.
Main features:
- Install attribution: Track the full customer journey from ad click to app download, so you know which campaigns are paying off.
- Deep linking: Guide users to the right spot in your app after they click.
- ROAS dashboards: Connect campaign spend to actual in-app revenue with real-time return on ad spend reporting.
- Fraud prevention: Automatically detect and block fake installs, bots, and click spam.
- Partner integrations: Connect with thousands of ad networks and partners.
Adjust for secure and data-rich attribution analytics
🏆 Best for: Privacy-compliant attribution with strong fraud protection.
💰 Pricing: Free Base plan available (up to 1,500 monthly attributions). Core and Enterprise plans are custom-priced based on annual volume.
🌟 G2 rating: 4.2/5 based on 150+ reviews.
⚠️ Consider if: You’re sensitive to UI lag or downtime. Some users mention performance bugs and delays in weekday reporting, which could disrupt fast-paced marketing ops.
Adjust is another solid choice for mobile attribution, especially if privacy and data accuracy are top priorities for you. It’s designed for marketers who want to track performance across campaigns, without losing sleep over fraud or compliance issues. What I like is how it blends secure attribution with tools for building and targeting custom audiences, all while staying GDPR- and SKAdNetwork-compliant.
If you’re scaling up your performance marketing efforts and want a platform that is all about privacy and precision, Adjust might be the one for you.
Main features:
- Attribution tracking: Understand which campaigns bring in your most valuable customers.
- Fraud prevention suite: Filter out suspicious installs and clicks before they skew your data.
- Audience builder: Create custom segments for retargeting or lookalike audiences.
- SKAdNetwork support: Stay compliant with iOS privacy changes without losing key insights.
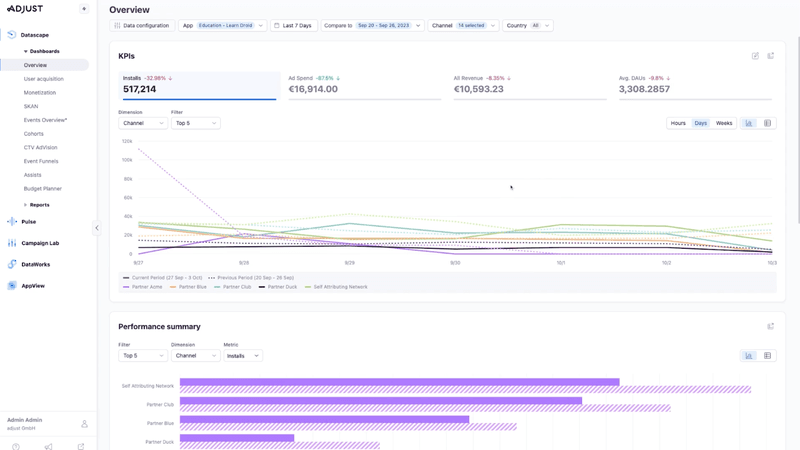
- Analytics dashboards: Visualize campaign performance and user trends in one place.
AppMetrica for all-in-one analytics and attribution platform
🏆 Best for: Teams looking for a free, full-featured attribution and analytics tool.
💰 Pricing: Completely free for up to 100M events/month. Custom and Pro plans start from $905/month and $3000/month respectively.
🌟 G2 rating: 4.5/5 based on 30+ reviews.
⚠️ Consider if: You need deep integrations, since AppMetrica’s ecosystem is more limited outside of Yandex services.
AppMetrica is a surprisingly capable pick for teams with a tight budget who’d still like to have solid attribution and mobile web analytics. It’s built by Yandex and gives you the essentials, like install tracking, user behavior insights, and campaign performance, all without spending a dime.
The interface isn’t the slickest out there, but it does get the job done. And if you’re just starting out and want product and marketing insights in one place, it’s a great way to get going without the overhead.
Main features:
- Attribution tracking: See which channels drive installs, whether they’re organic or paid.
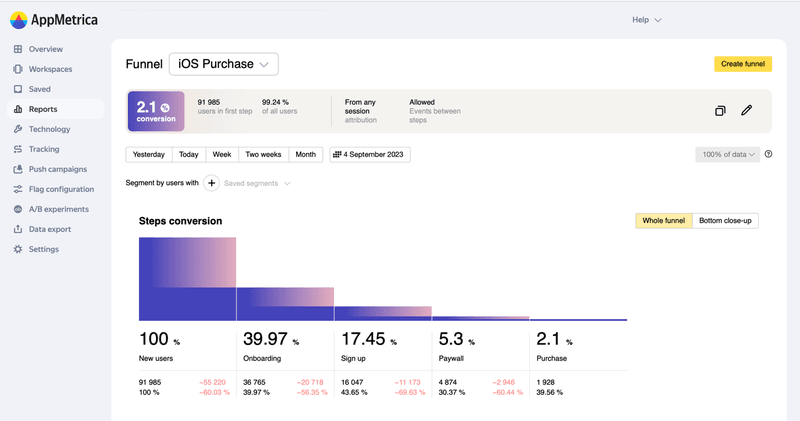
- Event analytics: Track specific in-app actions like subscriptions, feature use, and conversions.
- Crash reporting: Get visibility into app stability by spotting bugs and crashes as they happen.
- Cohorts and retention: Understand how long users stick around after install and what keeps them engaged.
- Real-time dashboards: Get live updates on installs, usage, and engagement.
Google Analytics (via Firebase) for marketing campaign tracking
🏆 Best for: Teams already using Firebase and Google’s ecosystem.
💰 Pricing: Free.
🌟 G2 rating: 4.5/5 based on 250+ reviews.
⚠️ Consider if: You need more detailed product analytics. Firebase focuses more on big-picture trends than granular insights.
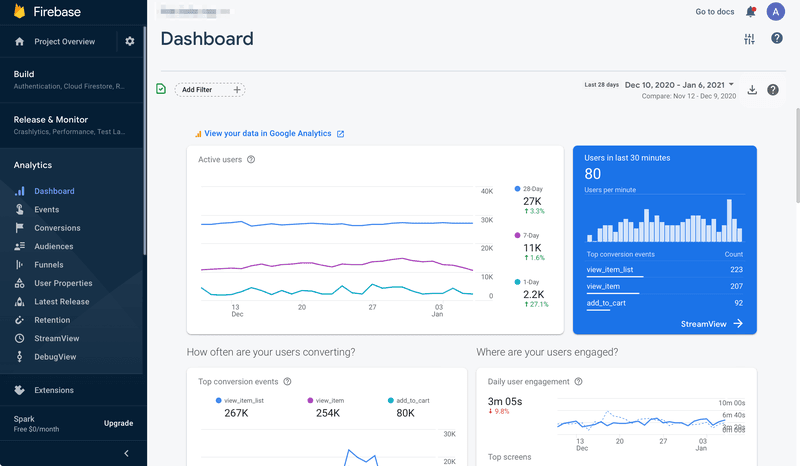
If you’re already using Firebase, adding Google Analytics into the mix is kind of a no-brainer. It gives you a free and reliable way to track user acquisition, engagement, and campaign performance without needing to learn a whole new tool.
It’s not the most advanced when it comes to deep segmentation or behavioral cohorts, but for top-level trends and quick campaign insights, it does the job. Especially if you’re already using tools like Crashlytics or Firebase Messaging.
Main features:
- Campaign attribution: Track where installs are coming from and how users behave after.
- Event tracking: Monitor user actions like opens, sign-ups, or purchases.
- Audience segmentation: Group users for analysis or targeting in Firebase Messaging.
- Real-time data: See live stats on customer activity and campaign performance.
- Tight ecosystem integration: Works seamlessly with Google Ads, BigQuery, and other Firebase tools.
Sentry for full-stack error and performance monitoring
🏆 Best for: Real-time error tracking and crash diagnostics across mobile platforms.
💰 Pricing: Free for solo devs (1 user). Paid plans start at $26/month for teams.
🌟 G2 rating: 4.5/5 based on 100+ reviews.
⚠️ Consider if: You’re looking for broader product analytics, since Sentry is mainly focused on performance and debugging.
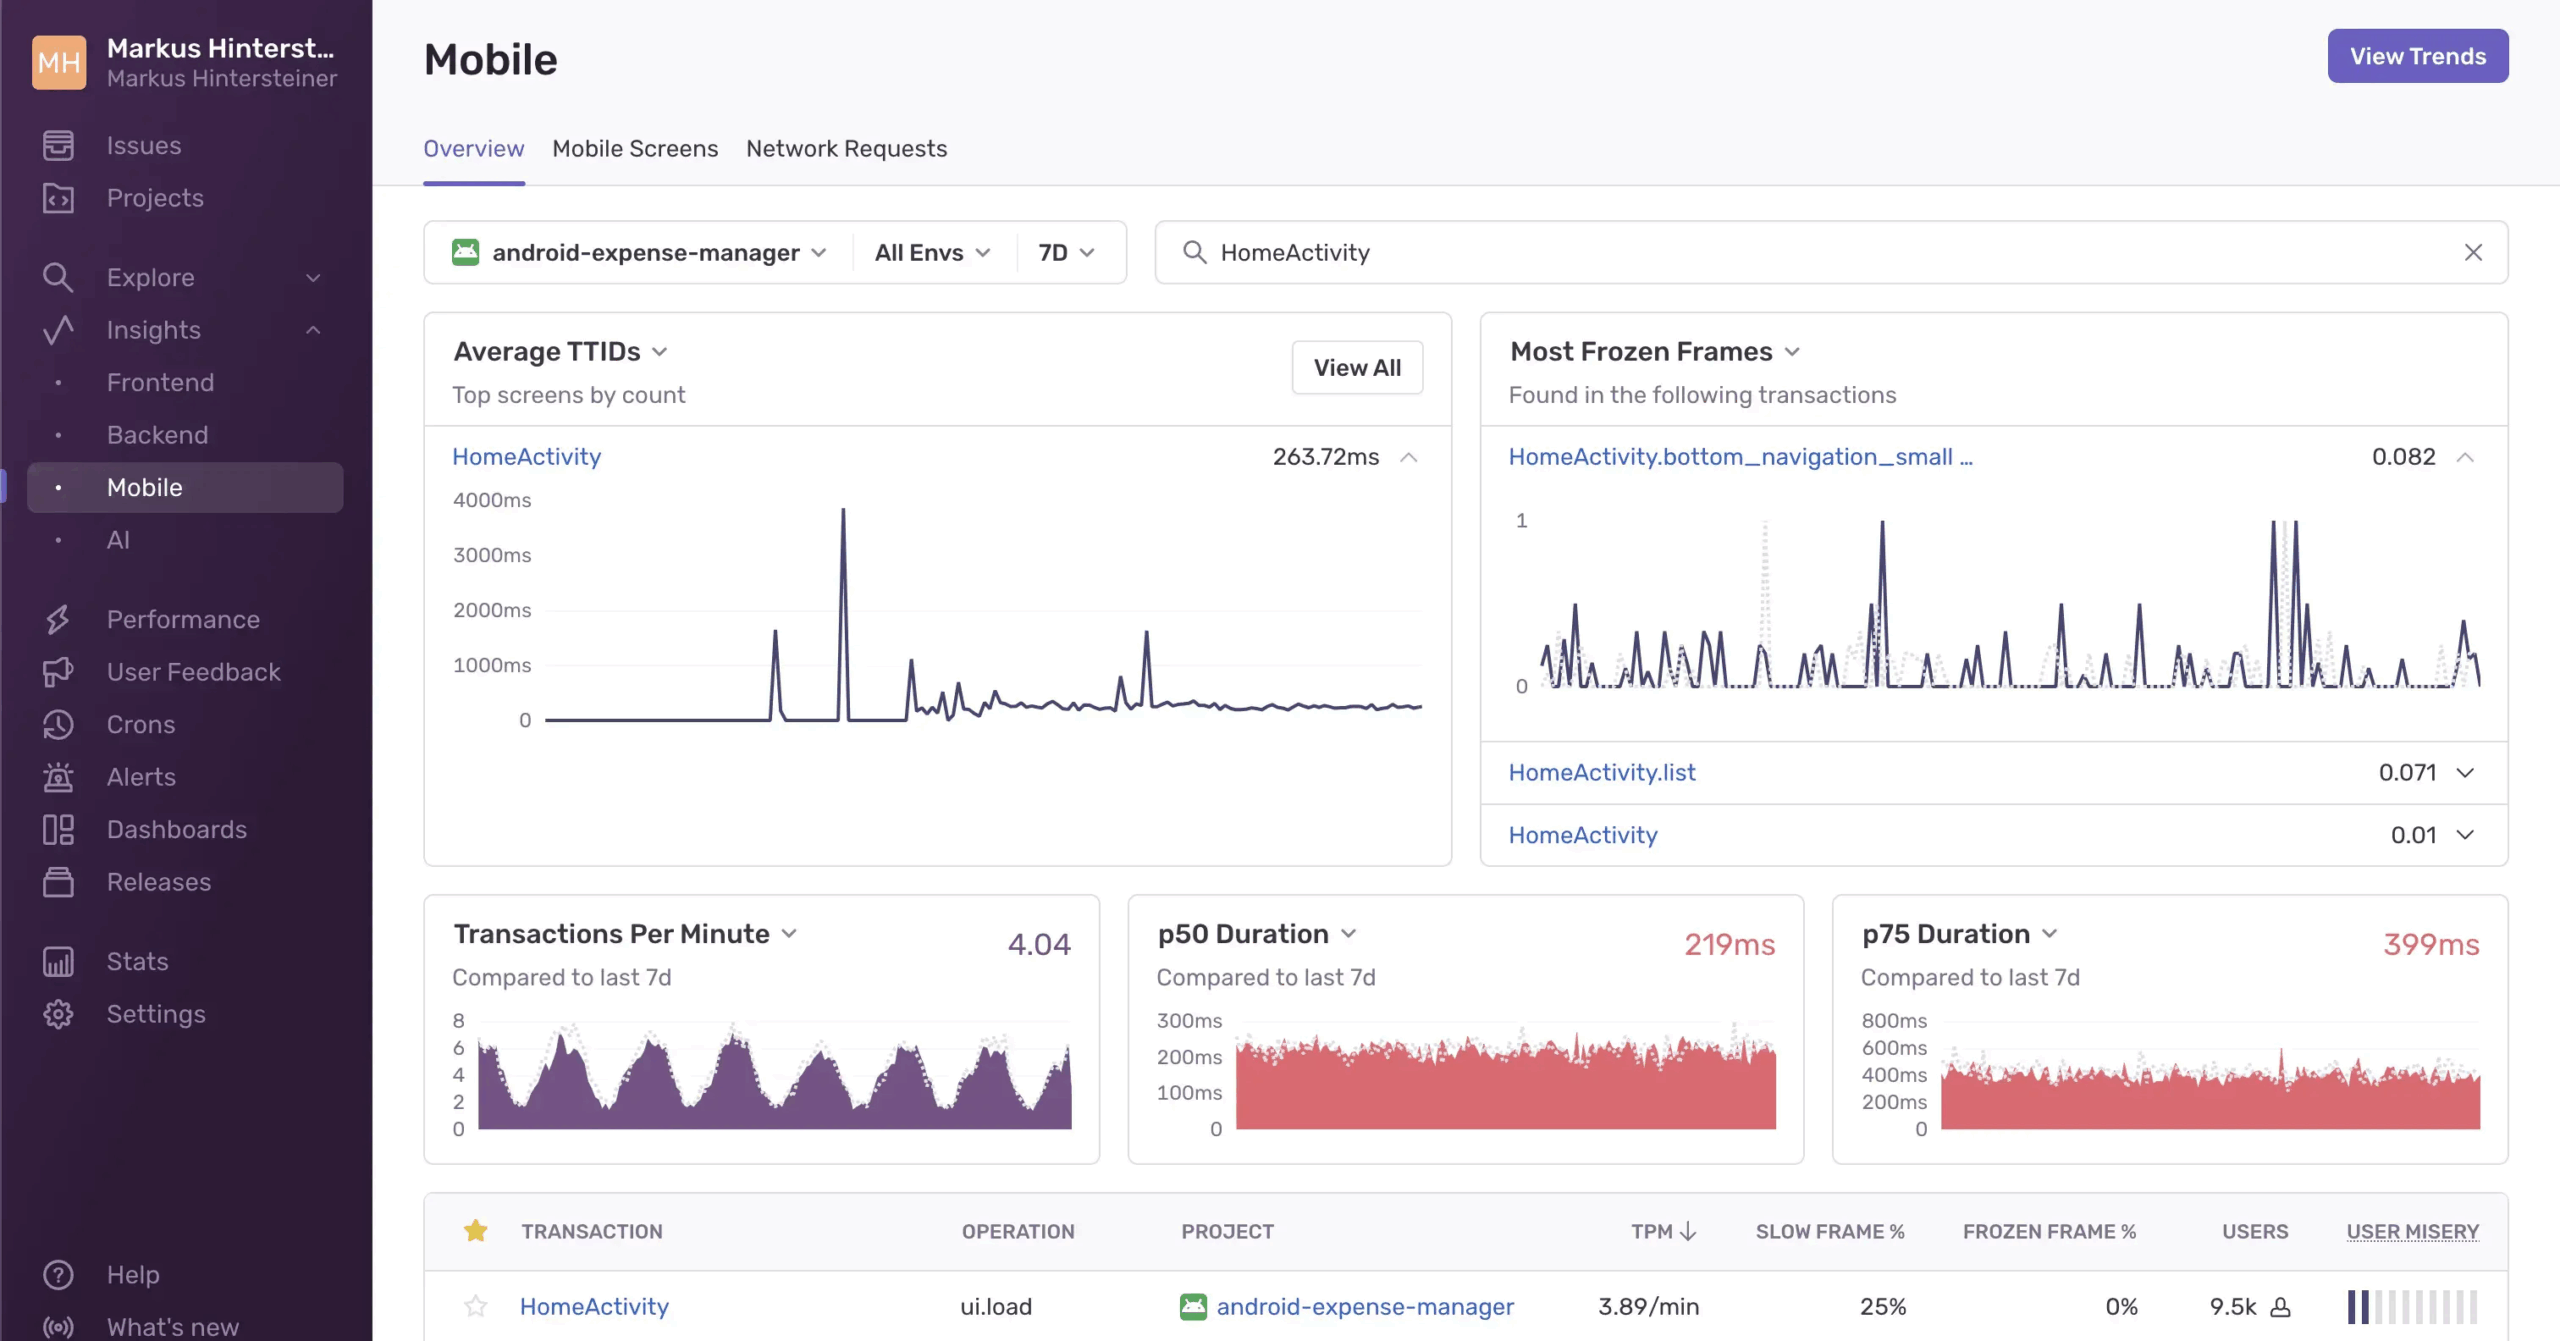
If you’ve ever had a user drop off because of a bug or crash (and let’s be real, we all have), Sentry’s one of the best tools to catch those issues before they cause too much damage. It’s built to give developers fast, detailed feedback on what went wrong, so you can debug without digging for hours.
It’s a strong pick for engineering or QA teams who want to quickly catch hold of performance problems and cut down on any bug-related churn. While it doesn’t give you product usage data, it’s a strong choice if your priority is stability and speed.
Main features:
- Crash reporting: Get real-time alerts with stack traces, device data, and user context when your app crashes.
- Performance monitoring: Measure app speed and latency across key flows like screen loads or checkouts.
- Issue grouping: Automatically bundle similar errors so you can tackle recurring problems more efficiently.
- Release tracking: Monitor app performance by version to catch regressions.
- Session details: See what users were doing right before a crash occurred.
New Relic Mobile for enterprise application performance monitoring
🏆 Best for: Enterprise teams tracking mobile performance at scale.
💰 Pricing: Free tier available (includes 100 GB/month of data). Standard, Pro, and Enterprise plans offer custom pricing.
🌟 G2 rating: 4.4/5 based on 500+ reviews.
⚠️ Consider if: You’re only focused on mobile. New Relic works best when paired with backend and infrastructure monitoring.
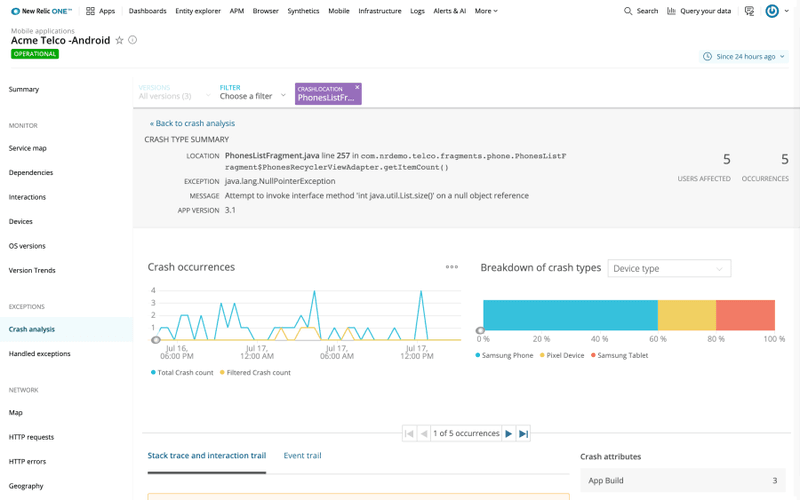
From what I’ve seen, New Relic Mobile makes the most sense when your team is already deep into the New Relic ecosystem. It gives you everything you need to monitor mobile performance, which is especially helpful if your frontend and backend teams are working closely together. I’d say it’s ideal for teams that need real-time data on crashes, network errors, and app version performance across a large user base.
Main features:
- Crash analytics: Spot and diagnose mobile crashes with full stack traces, device info, and contextual data.
- Network monitoring: Track mobile API performance, latency issues, and network-related errors in real-time.
- App version comparison: Compare performance and stability across different app versions to pinpoint regressions.
- Custom dashboards: Visualize key mobile KPIs alongside backend metrics.
- Error trends: Spot patterns in how, when, and where issues occur.
Instabug for crash reports with user feedback
🏆 Best for: Catching crashes and collecting real-time user feedback in one place.
💰 Pricing: 14-day free trial. Paid plans start at $249/month (billed annually).
🌟 G2 rating: 4.3/5 based on 200+ reviews.
⚠️ Consider if: You rely heavily on bulk actions or React Native. Some users report bugs, Jira sync issues, and a lack of SDK flexibility for debugging.
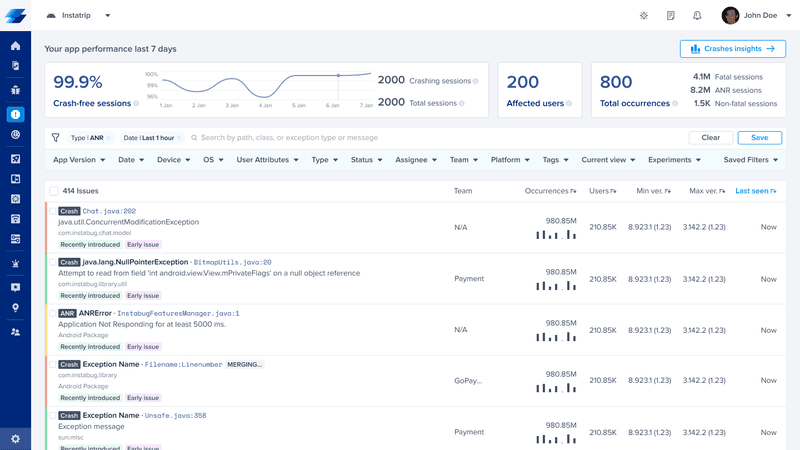
Instabug isn’t just another crash-reporting tool. What makes it valuable is how it blends diagnostics with in-app feedback, so you’re not chasing down second-hand bug reports or vague complaints from reviews. I think it’s an especially useful tool for testing phases, new feature rollouts, or when you want to stay closely connected to what users are experiencing.
Main features:
- Crash reporting: Get detailed reports on errors, device info, and stack traces.
- Customer feedback capture: Let users report bugs with annotated screenshots, screen recordings, and comments, from inside the app.
- In-app mobile surveys: Collect feedback on app performance or new features in real-time.
- Session profiling: Understand device usage, OS versions, and environment context.
- Third-party integrations: Sync data with tools like Slack, Jira, and Zendesk.
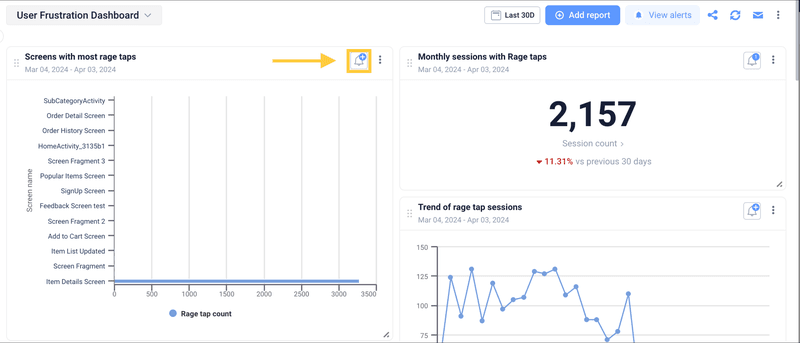
UXCam for crash reporting with session replay
🏆 Best for: Understanding user frustration through crash reports and session replays.
💰 Pricing: Free plan available (up to 3,000 monthly sessions). Starter, Growth, and Enterprise plans are custom-priced based on usage.
🌟 G2 rating: 4.6/5 based on 200+ reviews.
⚠️ Consider if: You need traditional analytics, too. UXCam focuses more on UX and visual diagnostics than metrics.
This one’s built for product folks who need more than charts and crash logs. UXCam helps you actually see what’s going wrong (or right) in your app by combining crash reporting with session replays. That makes it ideal for mobile teams who want to go beyond logs and understand user behavior in context.
If you’re ever dealing with UX issues that are hard to reproduce or want to visualize how bugs impact user flows, UXCam is a great pick to help you out.
Main features:
- Session replay: Watch screen recordings of user sessions to see exactly what happened before a crash or user drop-off.
- Crash analytics: Break down crash reports by OS, device, and app version to troubleshoot more effectively.
- Heatmaps: See which parts of the UI are getting the most interaction (or confusion).
- User journey mapping: Track how customers move through your app from start to exit.
- Frustration signals: Spot rage taps, unresponsive gestures, and abandonment points.
Userpilot for cross-platform engagement and analytics
🏆 Best for: Tracking and improving product usage across both web and mobile.
💰 Pricing: 14-day free trial available; paid plans start at $299/month (billed annually) and scale to custom enterprise tiers.
🌟 G2 rating: 4.6/5 based on 700+ reviews.
⚠️ Consider if: You’re a very early-stage startup. The pricing might not suit smaller teams just getting started.
I know, I might be biased here. But if you’re looking for a tool that brings together product analytics and in-app engagement across both mobile and web, Userpilot brings you the best of both worlds. It’s especially great for product and growth teams who want to drive user engagement, improve app performance, and act on insights without relying too much on engineering.
Also, we recently launched full support for mobile analytics, which builds on our existing web capabilities. Now, you can track how users interact with your app across platforms, understand their behavior in context, and respond with in-app experiences, all from the same dashboard.
Main features:
- Autocapture for web and event-based tracking for mobile: Lets you automatically collect key user actions with minimal dev effort. Mobile event tracking is no-code, so PMs can set it up themselves.
- Session replays: Watch user sessions to understand app behavior in context, spot bugs, or troubleshoot where users are getting stuck. This helps you bridge the gap between numbers and real experience.
- Analytics dashboard: Gives you a centralized view of performance metrics like retention, feature adoption, and account expansion, alongside user behavior and conversion trends.
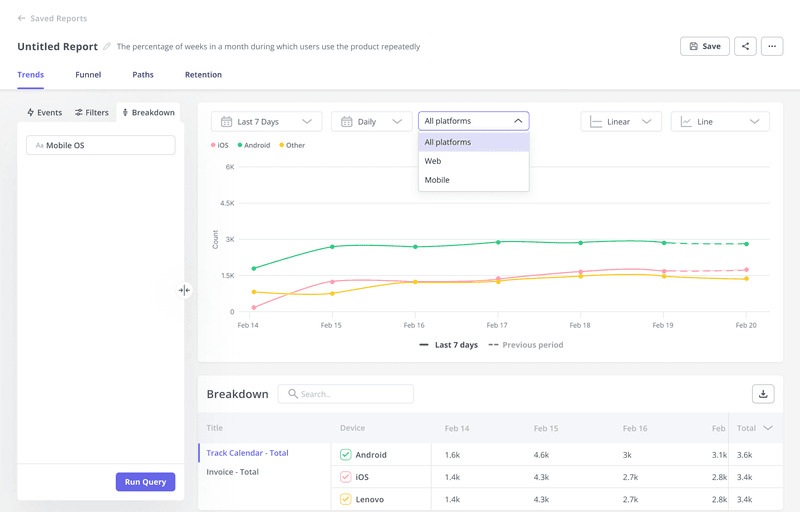
- Custom analytics reports: Build funnels, path analyses, and retention breakdowns so you can quickly find actionable insights and optimize user journeys over time.
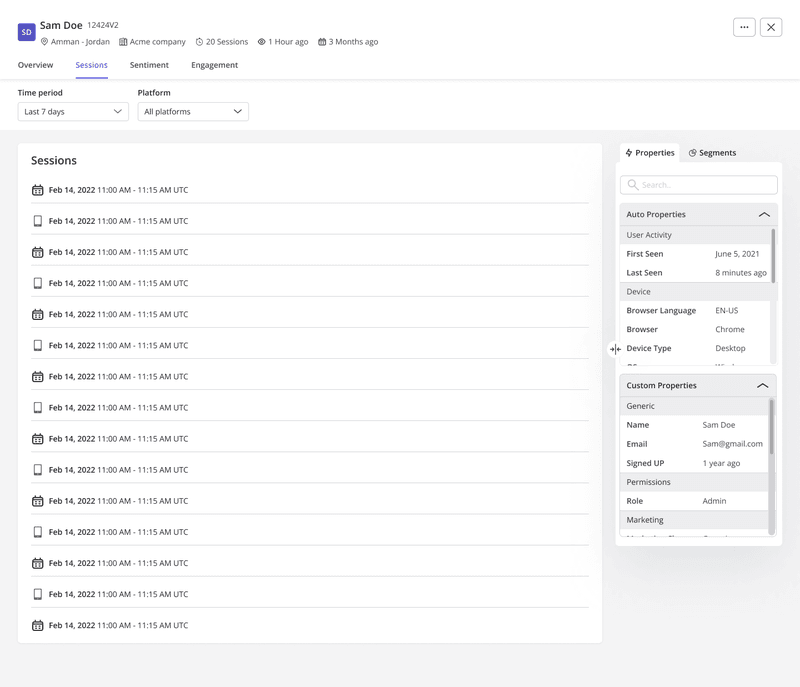
- User and company profiles: Bring together timelines of activity across mobile and web, so you can understand how each customer or account interacts with your product overall.
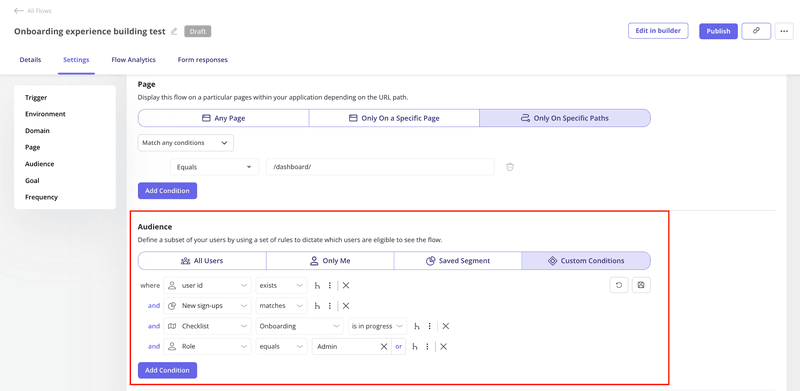
Beyond mobile and web analytics, Userpilot also helps you engage users directly with personalized in-app messaging. You can launch onboarding flows, tooltips, nudges, or checklists based on user behavior on both mobile and web, all without writing any code. This makes it easier to guide users when they’re stuck or highlight features they might have missed.
The newly added mobile support has made it much more convenient for teams to analyze mobile data alongside web, and act on it. But don’t just take my word for it. Here’s what one of our mobile users had to say:
FAQ
What is app analytics?
App analytics refers to the collection, measurement, and analysis of user data within a mobile application. It helps product and growth teams understand how users engage with the app, which features drive value, and where friction exists. These insights support better decision-making around product development, UX, and user retention.
Which tool is often used for in-app analytics?
Tools like Userpilot, Mixpanel, and Amplitude are commonly used for in-app analytics. They allow you to track user actions, analyze journeys, and measure engagement. The best tool for you depends on your app’s goals, team size, and whether you need mobile-only insights or cross-platform coverage.
How to measure app analytics?
To measure app analytics, start by setting up event tracking for key user actions such as sign-ups, clicks, and feature usage. Then use reports like funnels, retention analysis, and user paths to interpret the data. This helps you identify what’s working and where users are dropping off.
About the author