
How do you conduct user engagement analysis? What metrics should you track? How do you use the insights to improve user engagement?
These are the main questions the article explores.
We also look at a couple of analytics tools for analyzing user engagement.
Let’s dive right in!
Try Userpilot Now
See Why 1,000+ Teams Choose Userpilot

Summary of user engagement analysis
- User engagement is a measure of how active your users are inside the product and how good the product is at keeping them interested.
- Customer engagement is a wider concept than user engagement encompassing customer interactions with the brand across all customer journey stages. The latter is only limited to user behavior within the product.
- High user engagement indicates that users are satisfied with the product value, and as such, it’s vital to retain them and turn them into loyal customers.
- The user engagement rate is the percentage of users who use the product in a given period.
- Other popular user engagement metrics include user activation rate, DAUs/WAUs/MAUs, user stickiness, product usage frequency, NPS, CSAT, customer retention rate, and customer churn rate.
- AI writing assistants help teams make their microcopies concise but informative and engaging.
- When your user engagement analysis reveals that users don’t use a feature enough, design interactive in-app flows to help them discover the feature and teach them how to use it.
- Gamifying the customer experience, for example with leaderboards, celebration animations, or progress bars, makes it more engaging and increases retention.
- Webinars not only educate existing users and keep them engaged but also attract potential customers seeking a solution to their problems.
- Loyalty programs involving rewards like exclusive access to new features or discounts are yet another way to maintain user engagement.
- Userpilot is a product growth platform that allows you to collect customer feedback, analyze user in-app behavior, and drive engagement through in-app experiences. Book the demo to find out more!
What is user engagement?
In SaaS, user engagement is the measure of user activity inside the product over time, often expressed in terms of usage frequency and intensity.
That’s one way to explain the term.
User engagement could also refer to the strategies that businesses use to drive user interactions with the product, such as in-app messages or emails.
User engagement vs customer engagement
Customer engagement and user engagement refer to different interactions.
User engagement focuses on how users interact with the product. More specifically, it’s their behavior inside the product.
Customer engagement is a broader term encompassing the whole relationship between a brand and its target audience across all touchpoints and channels, not just within the product.
For example, this could involve social media interactions, newsletter consumption, or communication with customer support.
Why is user engagement important?
Whether you’re looking at user engagement from the user activity or business effort perspective, it’s essential for product success.
Highly engaged users are an indication that the product satisfies their needs and provides a positive experience. Consequently, it leads to higher user satisfaction, retention, and loyalty.
Your ability to engage users is evidence that you understand both your user preferences, needs, and pain points and the weak spots of your product experience.
For example, designing an onboarding flow that helps users activate a feature relevant to their use cases sends them a clear signal: that you know what matters to them and are ready to accommodate it.
How to calculate the user engagement rate?
The user engagement rate is the percentage of users who interact with the product in a given period.
To calculate it, divide the number of active users in a specific timeframe, e.g. a day or week, by the total number of users, and multiply it by 100.
So if 10,000 users sign up for your product, and 1,200 use it every week, the engagement rate is 12%:
(1,200/10,000) x 100 = 12%
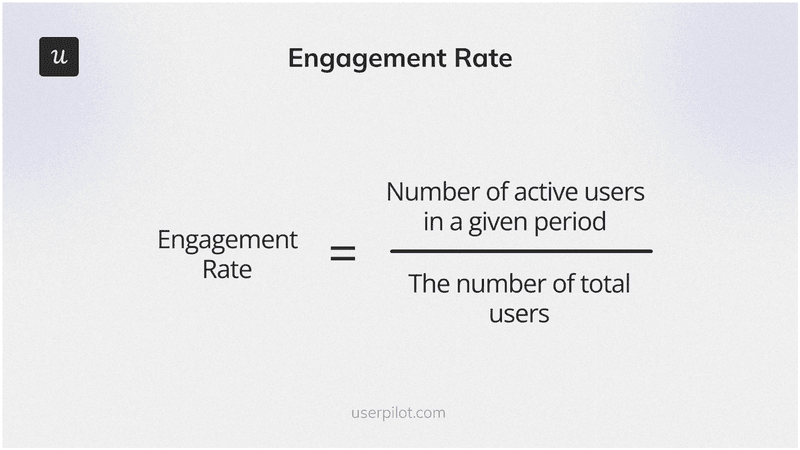
User engagement rate.
Is the 12% engagement rate good?
Probably not, but this depends a lot on your product. That’s why it’s best to use the initial user engagement rate calculation as a baseline and devise strategies to improve it.
Other user engagement metrics to track
Apart from the user engagement rate, there are a few other metrics to track.
This poses a challenge: keeping a pulse on all of them can be time-consuming and you may unintentionally miss some insights.
Unless your product analytics platform supports analytics dashboards to track user engagement metrics from one place.
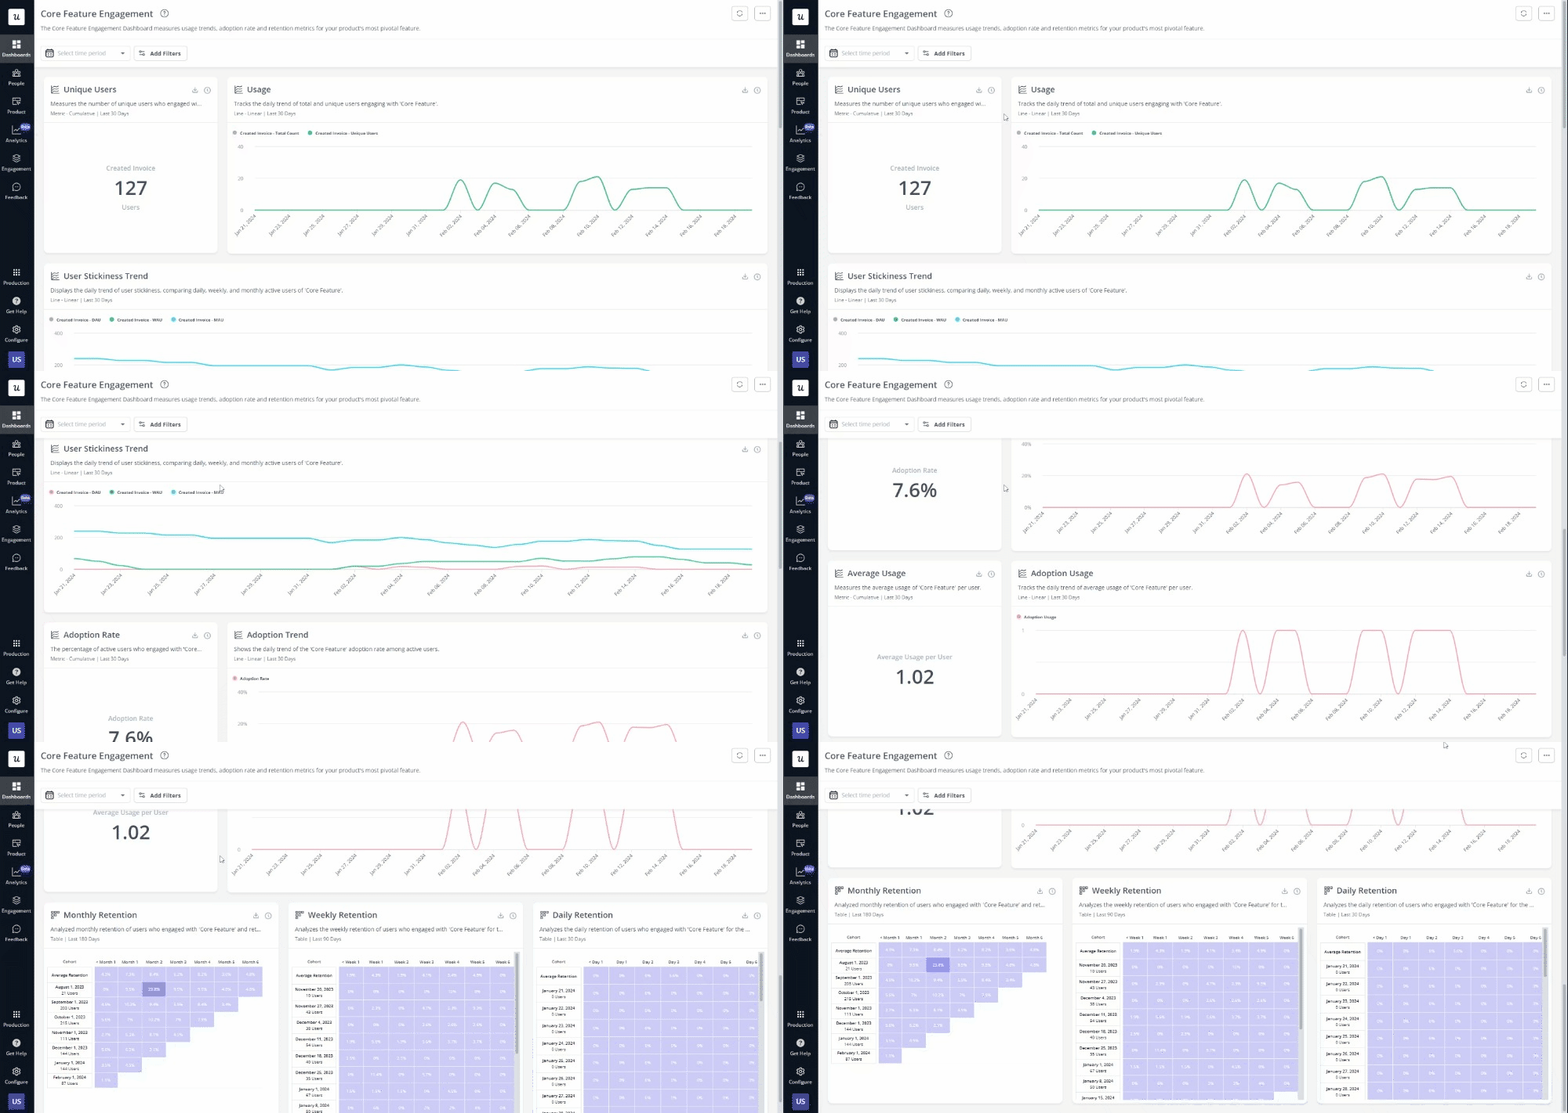
User activation rate
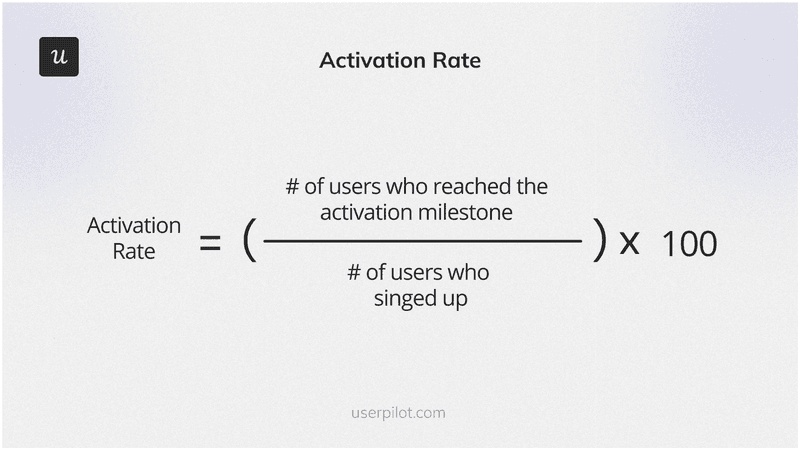
User activation rate is the percentage of users who have reached the activation milestone.
To calculate the activation rate, divide the number of users who have reached the activation stage by the total number of sign-ups, and multiply it by 100.
So if 100 users sign up for your product and 10 of them activate, the activation rate is 10%:
User activation rate = (1,000/10,000) x 100 = 10%
Daily active users, Weekly active users & Monthly active users
The definition of Daily active users (DAUs), Weekly active users (WAUs), and Monthly active users (MAUs) is pretty self-explanatory: the count of users who engage with the product every day, week, or month respectively.
Which of these you track depends on the product.
If your product is designed to be used daily, like a fitness tracker, DAUs are the key metric. Accounting software, on the other hand, tends to be used less regularly, for example, to create invoices, so MAUs are your metric.
The number of DAUs may fluctuate a lot, so looking at WAUs instead can help you smooth out the curve and get a more stable view of user engagement, while MAUs can give insights into long-term engagement trends.
User stickiness
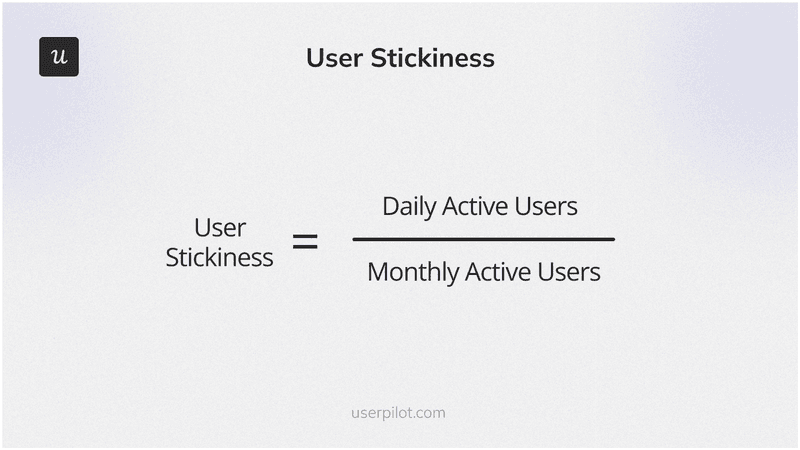
User stickiness measures the level of active user engagement and retention over time. It reflects how often users return to the product after their initial visit.
High stickiness indicates that users find the product valuable, engaging, and essential to their daily operations.
To calculate user stickiness, divide the number of DAUs by the number of MAUs and multiply it by 100.
So if you record 100 DAUs and 2000 MAUs, user stickiness is 5%:
User Stickiness = (100/2000) x 100 = 5%
Product usage frequency
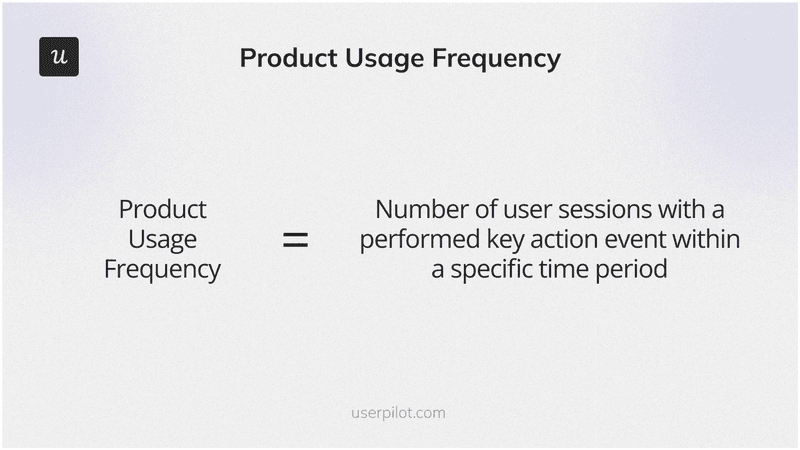
Product usage frequency refers to the number of user sessions during which users performed a key action event within a specific period.
Let’s break it down:
The key action event is an important activity that is crucial to the user’s engagement with the product, like completing a purchase or creating a post.
So if a user logs into your app, they must complete this key event otherwise they will be excluded from the count.
As such, the metric is more insightful than DAUs/WAUs/MAUs because it focuses on meaningful user interactions inside the product, not just any activity.
NPS
NPS stands for Net Promoter Score and is a metric used to evaluate user sentiment and measure customer loyalty.
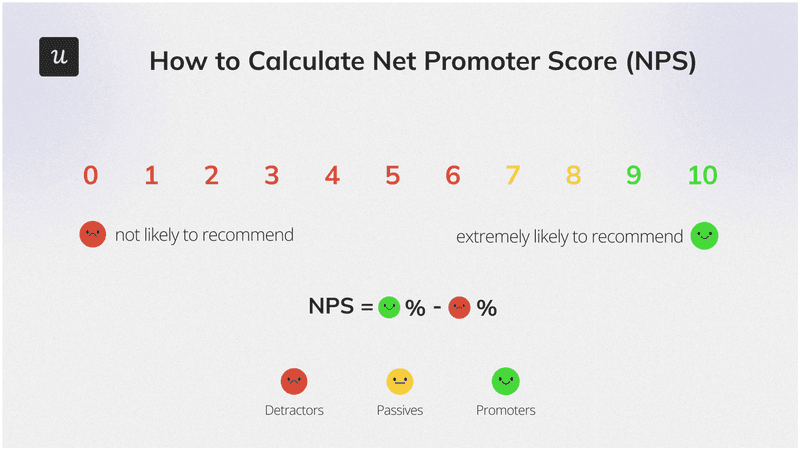
To collect the data for NPS calculation, we use a survey asking users how likely they are to recommend the product to their friends or colleagues, on a scale from 1 to 10.
Next, divide the respondents into 3 categories:
- Detractors (0-6)
- Passives (7-8)
- Promoters (9-10).
With that in place, deduct the percentage of detractors from the percentage of promoters to get the NPS score.
So if 100 users respond to the survey, 70 of them are promoters, 20 are detractors, your NPS score is 50.
NPS= ((70/100) – (20/100)) x 100 = 50
CSAT
CSAT is a measure of customer satisfaction.
Just like in NPS, the metric data comes from the survey. The question is ‘How satisfied are you with [your experience/product/feature X]?’ and includes a 1-5 Likert scale, where 1 stands for ‘very dissatisfied’.
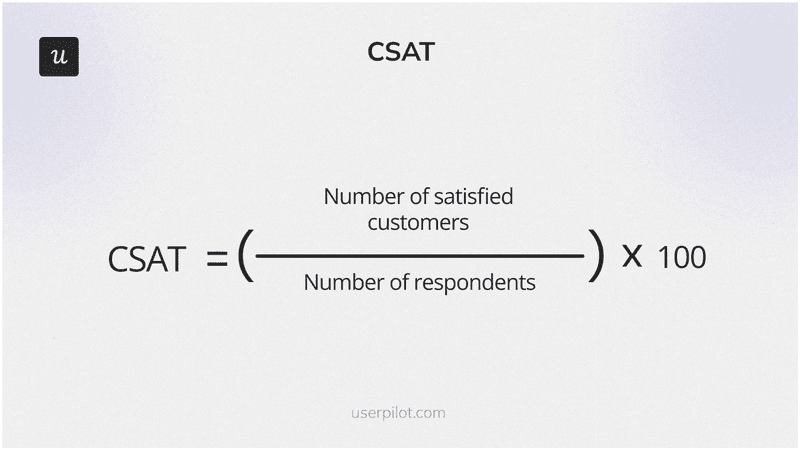
To calculate the CSAT score, divide the number of satisfied users by the total number of respondents and multiply it by 100.
So if 200 people complete the survey and 10 rate their experience as 4 or 5, the score is 5.
CSAT = (10/200) x 100 = 5%
Customer retention rate
Customer retention rate is the percentage of users who keep engaging with the product at the end of a given period.
It’s one of the key metrics used to measure customer satisfaction with the product, its ability to meet user needs, and the overall attractiveness of the product.
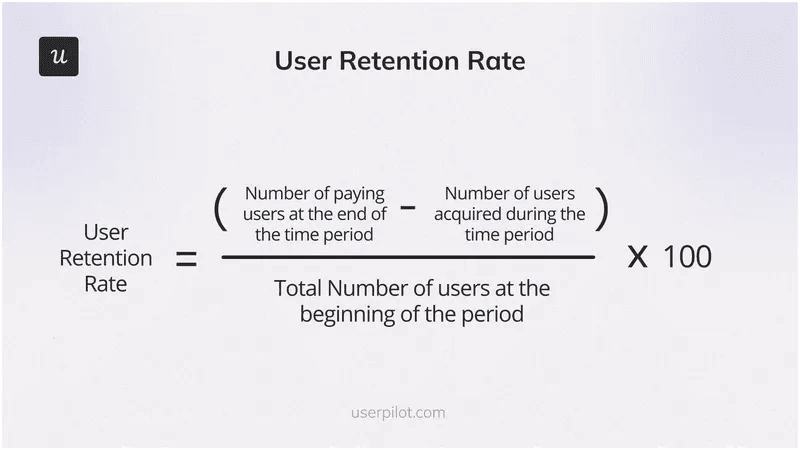
We distinguish between gross and net retention rates. The former doesn’t include customers acquired during the period in question, while the latter does.
Let’s imagine, that at the beginning of last month you had 200 customers. You then acquired 30 more but lost 20, so there were 210 pay customers at the end of the month.
Gross User Retention = ((210 – 30)/200) x 100 = 90%
Net User Retention = (210/200) x 100 = 105%
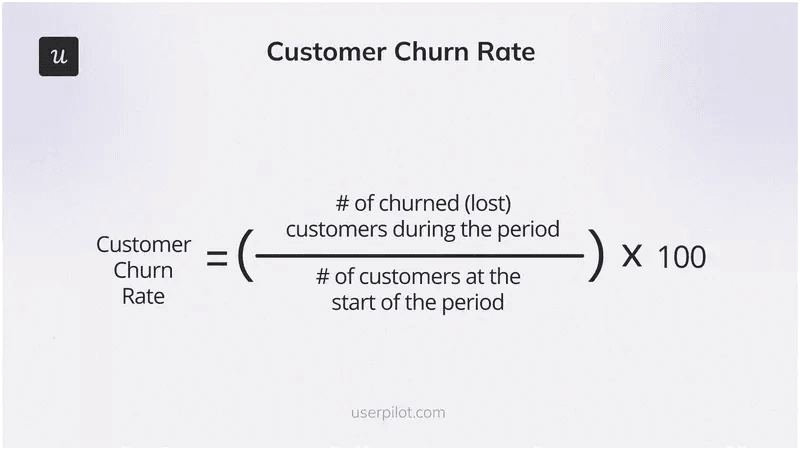
Customer churn rate
The customer churn rate is the opposite of the retention rate. Instead of the number of paying customers retained at the end of the period, we look at the percentage of those lost during that time.
So if we started the month with 200 customers but lost 20, the churn rate is 20%. We achieve this figure by dividing the number of churned users by the number of users at the start of the period and multiplying it by 100.
Customer churn rate = (20/200) x 100 = 20%
While some churn is inevitable, especially if we’re looking at free trial data, bleeding too many customers is evidence of poor customer engagement, unsatisfactory product experience, or a value gap.
How to improve user engagement metrics
Now that we know what user engagement metrics to track, let’s have a look at a few practical ways to optimize them.
Use AI to fine-tune your microcopies
Microcopies are short snippets of text in in-app messages that provide product information and guidance.
Good microcopy is succinct yet informative, engaging, and motivating.
With so little space and so much to say, this is easier said than done, though.
Fortunately, AI-powered writing tools that many companies integrate into their software can help you refine your microcopy.
For example, Userpilot’s AI writing assistant can help you generate your messages, announcements, notifications, survey questions, and support resources from scratch. You can also use it to extend, shorten, summarize, and improve your existing content.
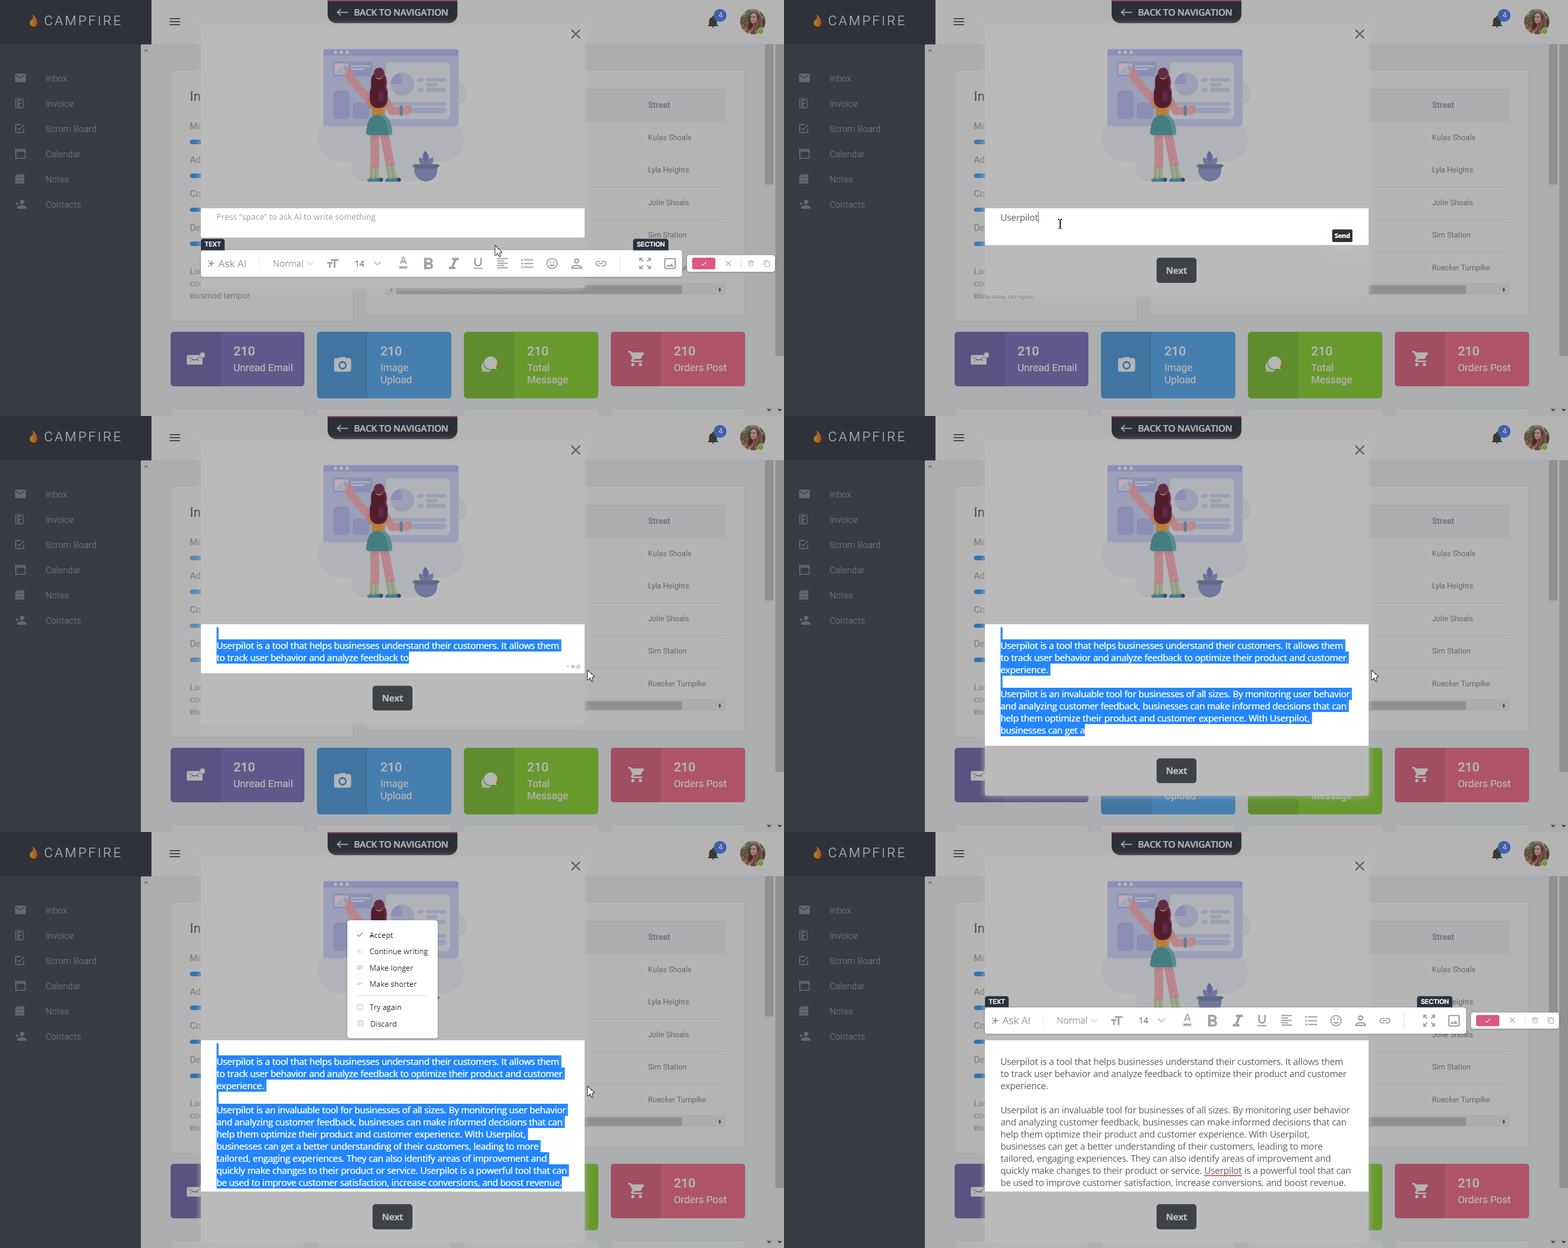
If you’re not lucky to have access to such a tool, good old chatGPT can be of massive help.
Create contextual user interactions throughout the customer journey based on user engagement analysis
Let’s imagine you’ve just launched a new feature that addresses one of your users’ main pain points. And yet, your users don’t seem to appreciate it: analytics show little usage.
Assuming you’ve done your discovery and validation properly, the odds are users simply don’t know how to use the new feature. They may not even know it exists!
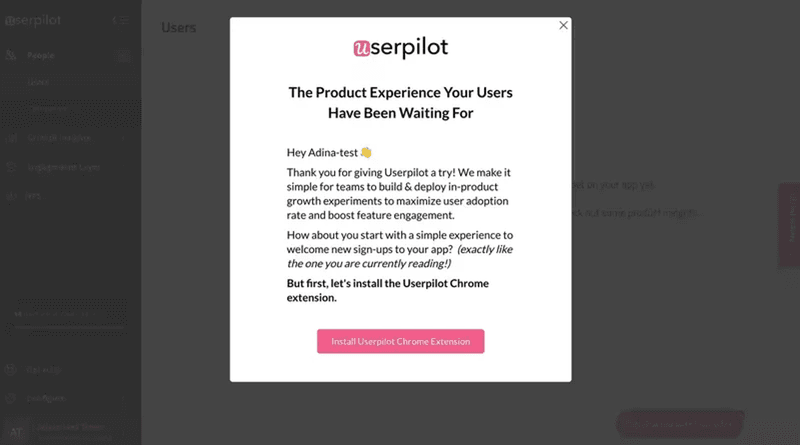
To improve engagement, design an in-depth walkthrough that introduces the feature and educates them on how to best leverage its capabilities.
It’s good practice to use contextual triggering for such flows. In this way, the users will see the flow exactly when they need it.
Gamify the customer experience
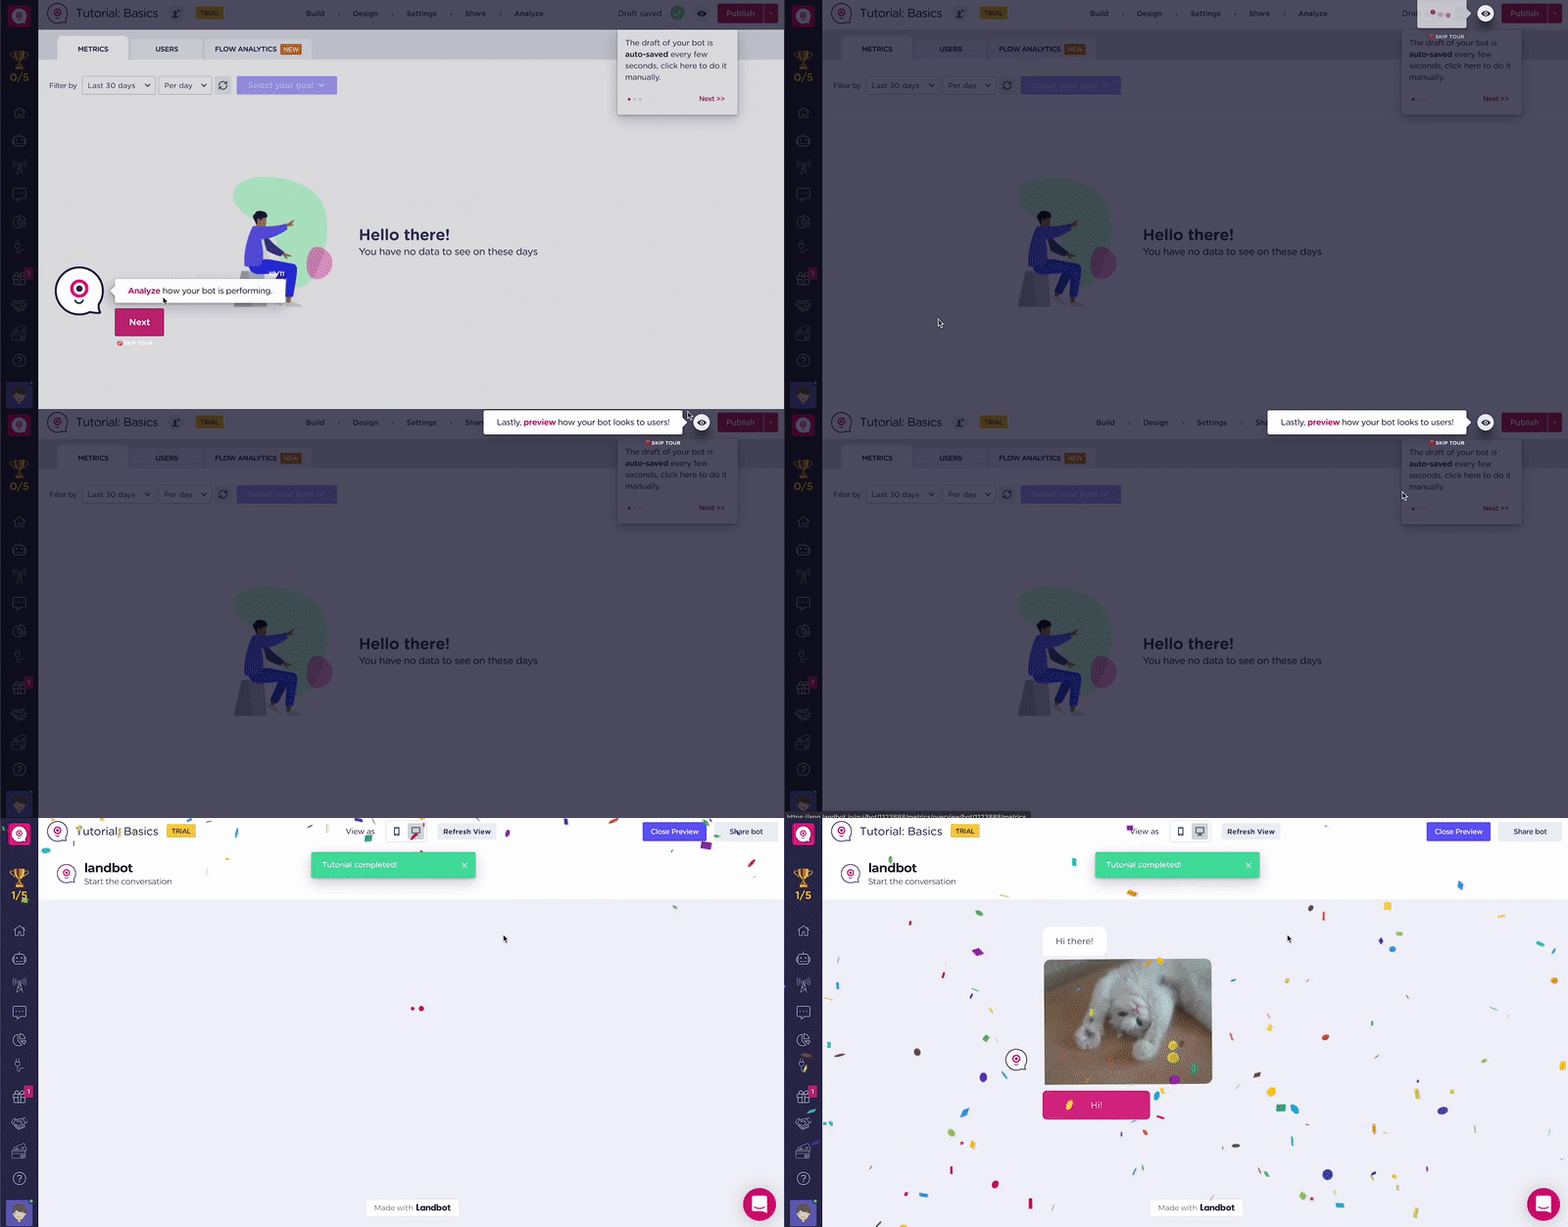
Adding elements of gamification to the user experience makes it more engaging and increases the chances they stick around for longer.
This could be in the form of:
- Congratulatory messages and animations when users reach a milestone.
- Leaderboards.
- Achievements and badges.
- Social sharing.
- Progress bars.
- Leveling systems with new features are unlocked when the user reaches a higher level.
If you want a coursebook example of gamification, look at Duolingo.
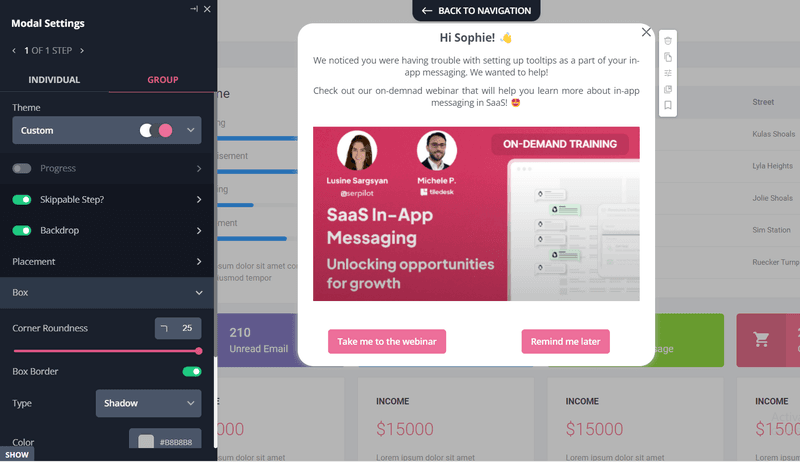
Educate users about the product with engaging webinars
By hosting webinars you kill a few birds with one stone:
- Educate your current users on how to use the full potential of your product.
- Keep them engaged.
- Capture the attention of prospective customers by presenting your product as a solution to their programs.
To see how engaging and informational webinars could be, have a look at the free events organized by Userpilot.
Increase user engagement with loyalty programs
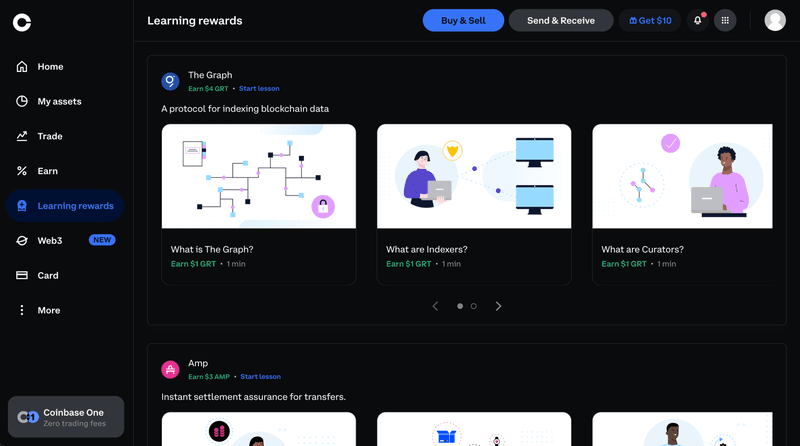
Loyalty programs are a means of maintaining and increasing user engagement through incentives.
How can you reward your customer loyalty?
There are tons of possibilities:
- Exclusive access to new features and products.
- Discounts and promotions.
- Increased usage limits and access to premium features.
- Dedicated priority support.
- Exclusive events, webinars, and training sessions.
- Referral rewards.
- Opportunity to take part in beta tests.
Best tools for measuring user engagement
In SaaS, all user interaction with the brand and the product happens in the digital space. This means tracking user engagement metrics across all touchpoints is dead easy. That’s if you have the right tools for the job.
Here are 3 product analytics tools that will help you do it.
Userpilot
Userpilot is a product growth platform built to drive user engagement with interactive in-app experiences informed by customer feedback and analytics.
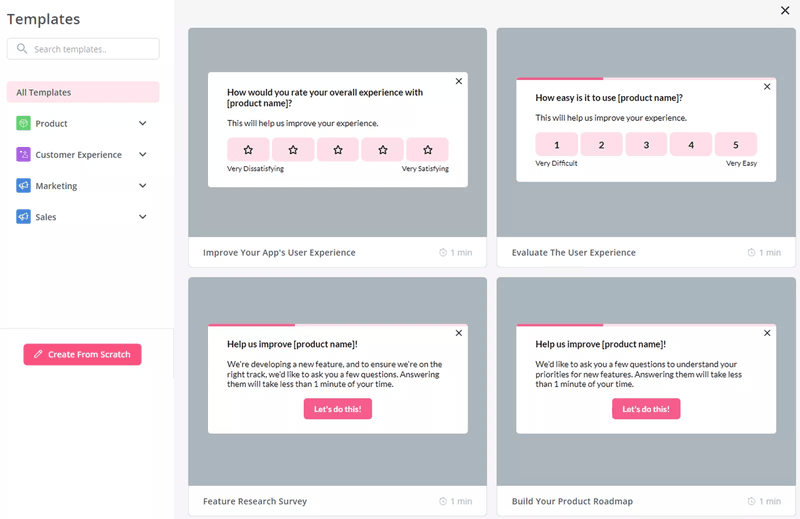
Userpilot enables you to collect user feedback code-free with in-app surveys.
Just pick a template from the library (NPS and CSAT included) and customize it a bit to match your UI. Once that’s done, you set when to launch the survey and who receives it, and the job is done.
There’s also a dedicated NPS dashboard with the key metrics and trends, so you don’t have to waste time on manual calculations.
When it comes to tracking user behavior, no other DAP can match Userpilot’s advanced analytics capabilities:
- Funnel analysis.
- Path analysis.
- Trend analysis.
- Flow analytics (to measure engagement with in-app experiences).
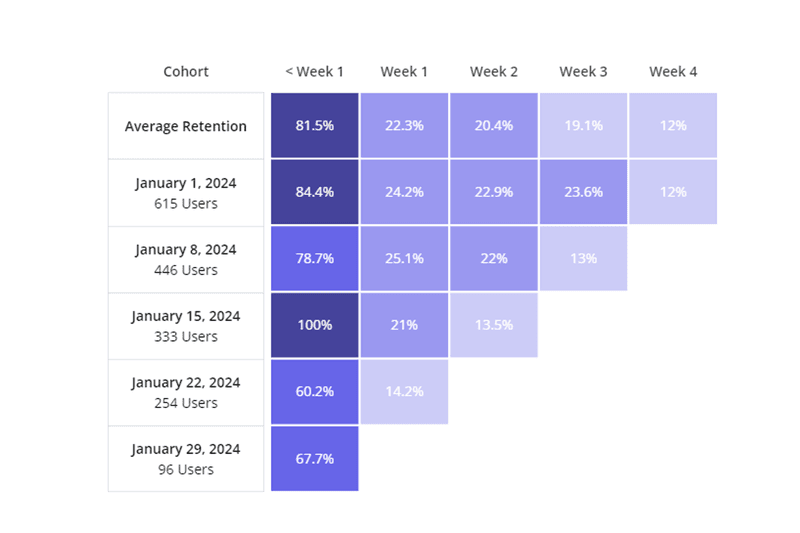
- Retention analysis.
Want to know the real kicker?
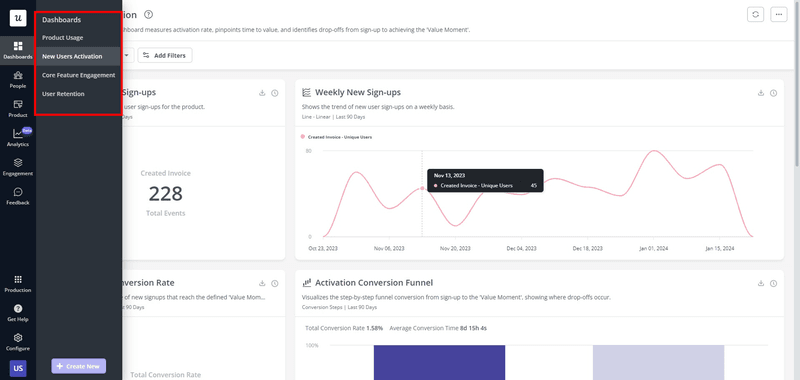
You can use different dashboards to track your engagement metrics from one place.
Better yet, you will soon be able to tailor the dashboards to your unique needs.
Hotjar
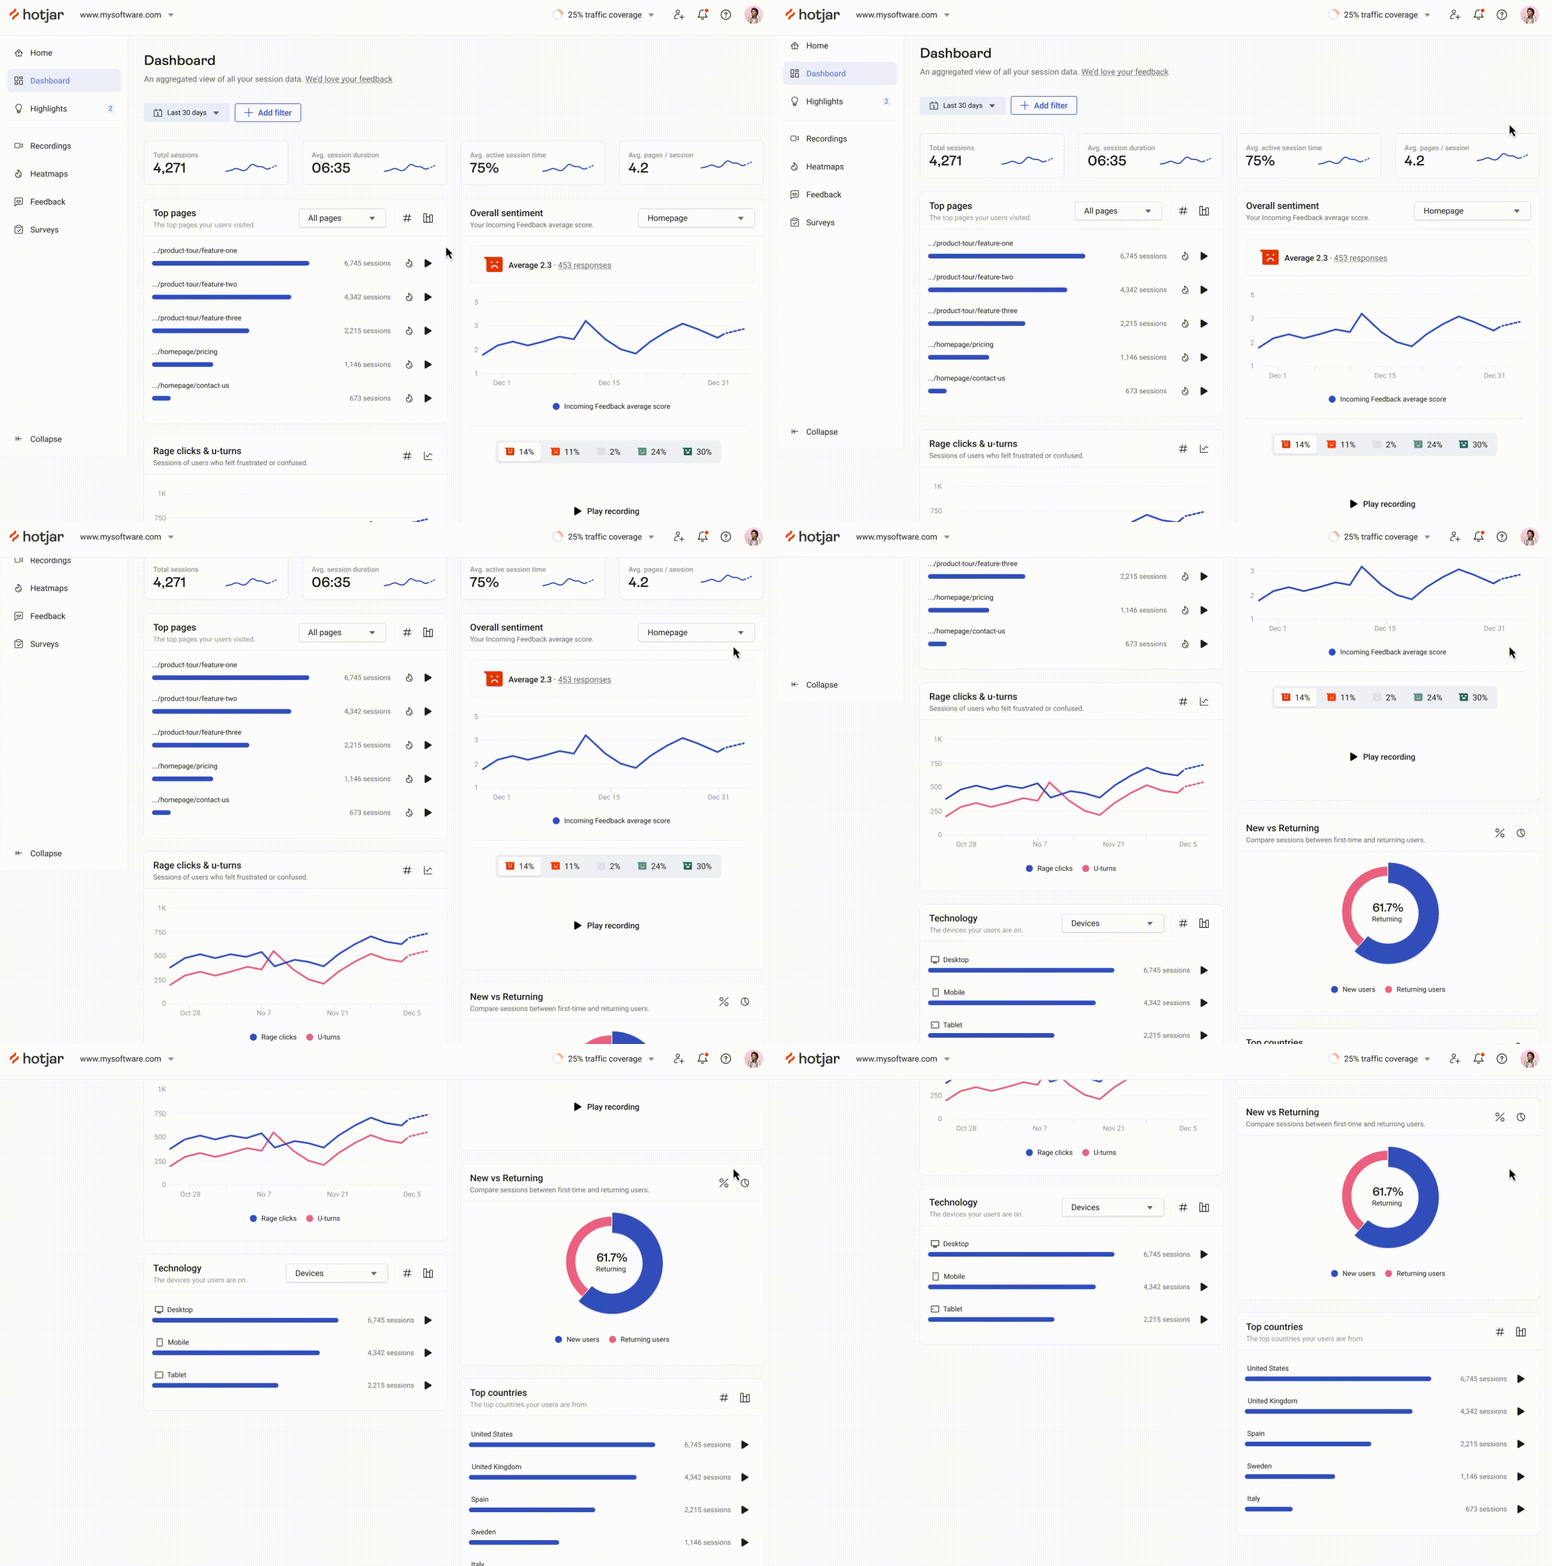
Hotjar is a user experience analytics tool that enables teams to collect quantitative and qualitative data on how users engage with their products and websites.
Its key features include:
- Heatmaps (click map, scroll map, engagement zones map, and rage-clicks map).
- Session recordings.
- Funnel analysis.
- Polls and surveys.
Google Analytics
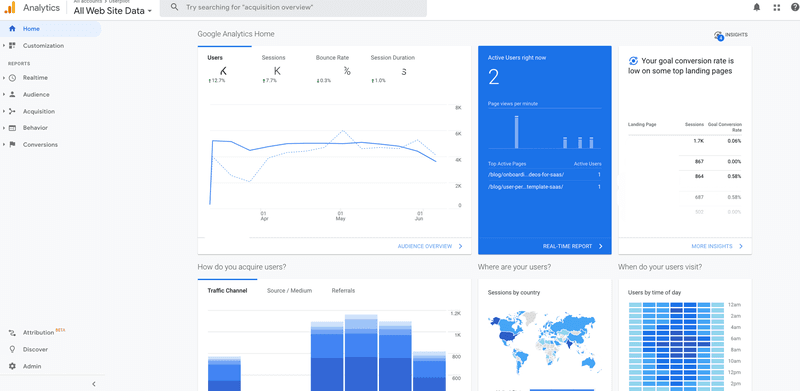
Google Analytics is a well-known free analytics platform used by marketers to track user engagement with their websites.
What metrics can you track with GA?
- Total number of visitors.
- Sessions.
- Pageviews.
- Average session duration.
- Bounce rate.
- New vs returning customers.
Conclusion
User engagement analysis gives businesses insights into which customers find which parts of the product valuable which allows them to prioritize their development efforts. It also helps them evaluate their engagement strategy and identify new opportunities to improve user experience.
To learn more about using Userpilot analytics to measure user engagement, book the demo!


