Data-driven design has been a hot topic among UX designers for some time now. But why do you really need to focus on adopting a data-driven design process?
The short answer is: Because you can’t create a successful product without first knowing what your customers want. To develop a product that keeps customers satisfied, your design must be backed by thorough user research and data.
Now that you understand the importance of data-driven design, let’s dive into the details. This article will help with that, guiding you on what data to collect and how to implement your data-driven decisions.
Try Userpilot Now
See Why 1,000+ Teams Choose Userpilot

What is data-driven design?
Data-driven design is the process of collecting, analyzing, and harnessing user data to make better-informed product development decisions. The idea is to continuously improve your design based on input from user interviews, feedback, and other sources of customer data.
This data-driven approach starkly contrasts with the “traditional” design process, where decisions are typically made based on the UX designer’s preferences or intuition.
Here’s an example to better understand the data-driven design process:
Suppose you discover that new users are more likely to churn after the first week. Further analytics data and segmentation reveal that users who completed the onboarding process are more likely to stay.
This unlocks a valuable data-driven insight: if you want to retain more new users, you need to improve your onboarding and make sure all users complete it.
Why does data-driven design matter to UX?
Data-driven design results in countless benefits since all your decisions are based on real-life user data and preferences instead of guesswork. Let’s dig deeper into some of these advantages to understand why the data-driven approach is central to UX:
- Customer-centric experience: Understanding how users interact with your product allows you to create better experiences that truly meet their needs.
- Improved usability: Analyzing data can help reveal friction areas and user pain points that you should focus on to improve navigation and usability.
- Increased engagement: Collected data can be used to tailor the product experience for different user segments, thereby driving engagement and aiding feature discovery.
- Greater retention: Regular user analytics enable you to constantly improve your product, keeping it aligned with user needs. As a result, you end up reducing churn and driving retention.
Types of data designers can use
There are two main types of data that UX designers can utilize: qualitative and quantitative. Here is an overview of both types to help you understand, with examples.
Quantitative user data
Quantitative data includes all the numerical data related to user behavior and patterns that can be measured and analyzed statistically.
You can collect quantitative data through automated surveys, event tracking, and various analyses, such as funnel or path analysis.
Analyzing quantitative data is useful for measuring product performance through objective quantitative metrics. Some common metrics include calculating the trial-to-paid conversion rate or measuring average session length to understand user engagement levels.
Qualitative user data
Qualitative data involves non-numerical insights gathered from customer interactions and user feedback.
Such data is helpful for providing greater context and understanding of user behavior. In other words, it aids in uncovering the “why” behind user actions, which is not possible if you solely rely on quantitative facts.
Examples of qualitative data include user interviews to explore their needs and surveys with open-ended questions for detailed feedback.
The top data sources for data-driven design
Within both qualitative and quantitative methods of data collection, there are some key data sources that all UX designers must know of. Let’s look at what they are, and how to collect and interpret them.
User analytics
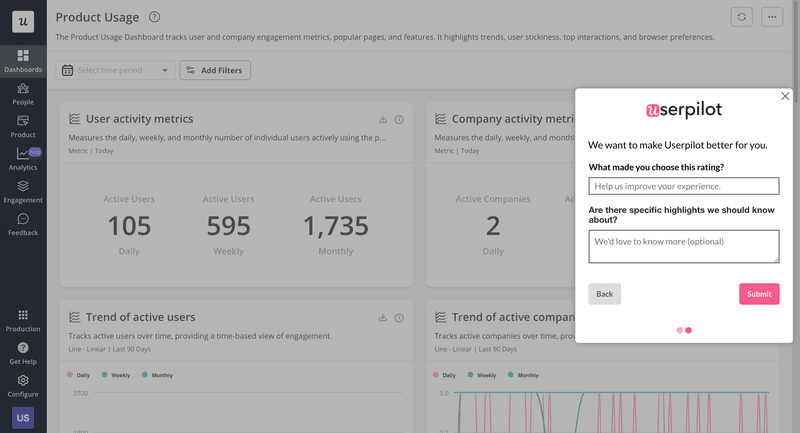
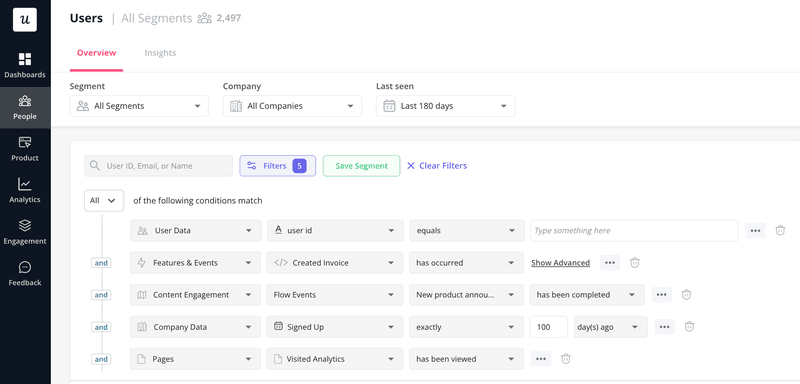
User analytics includes all the metrics and behavioral data collected from users interacting with your product or service. Such data helps uncover valuable insights about how users navigate, where they spend the most time, what actions they take, etc.
To help with data collection and interpretation, you can also adopt user analytics tools like Userpilot. These enable you to seamlessly track user actions, sessions, and engagement. Other ways of collecting user analytics data include:
- Implementing tracking codes.
- Setting up event tracking.
- Analyzing user flows.
- Identifying drop-off points.
- Understanding user engagement patterns.
Surveys and feedback
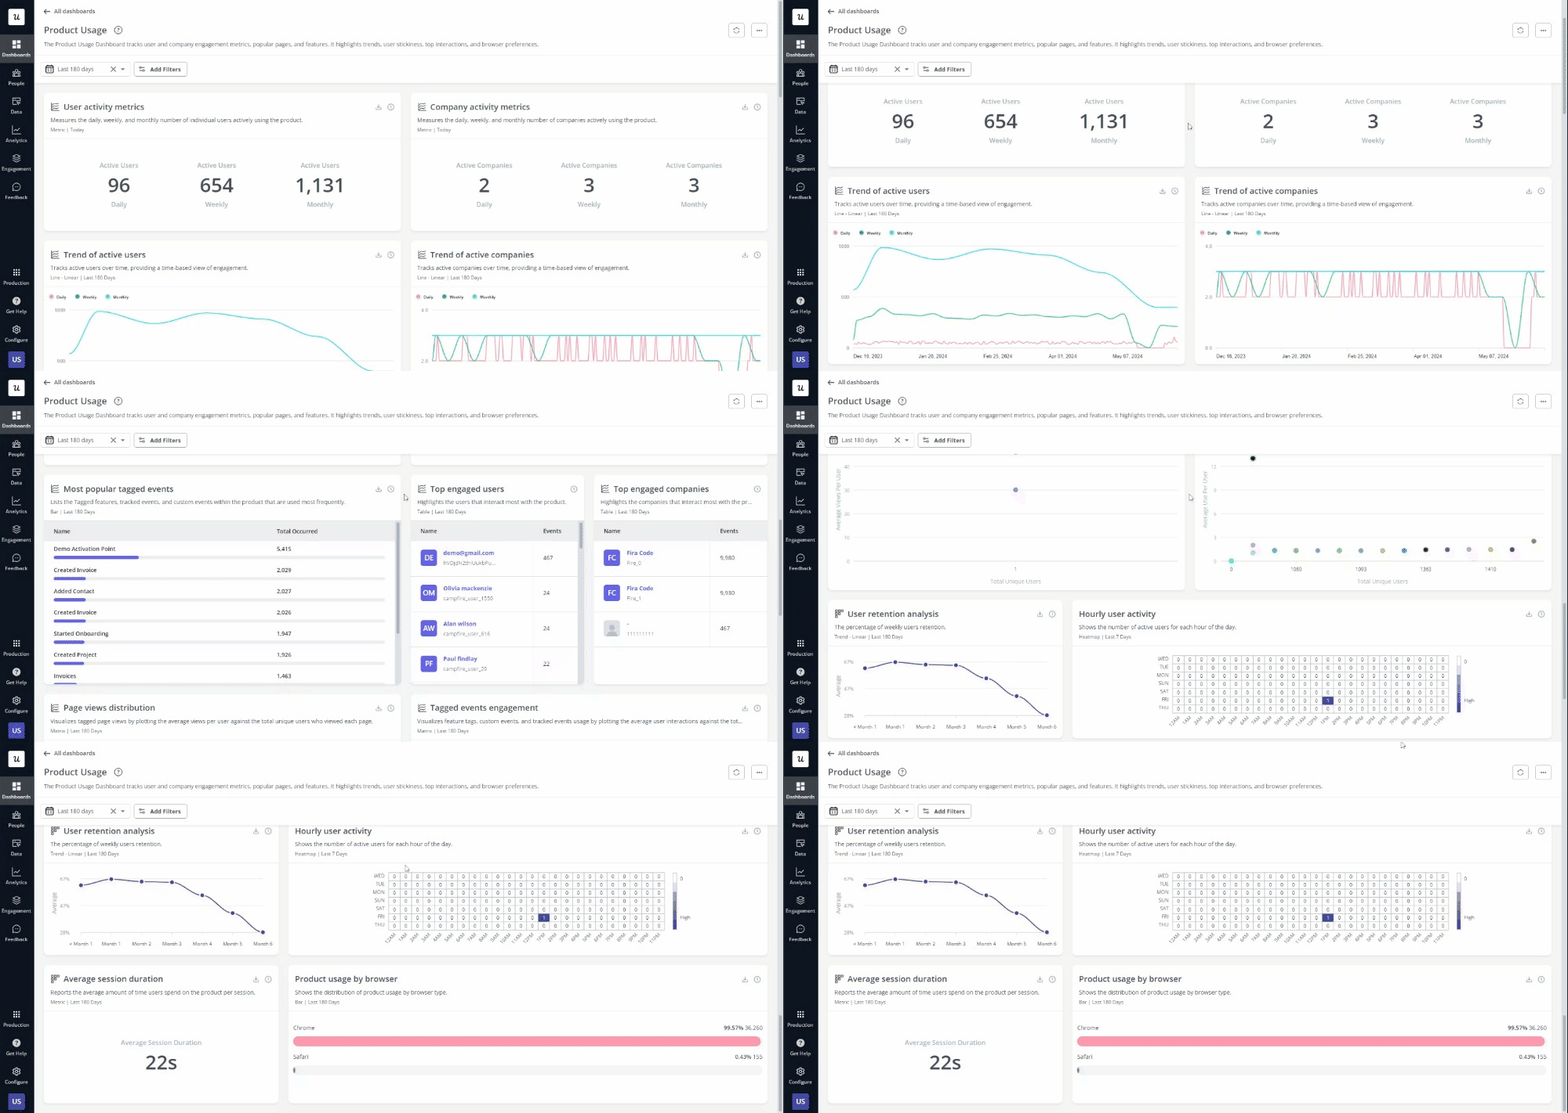
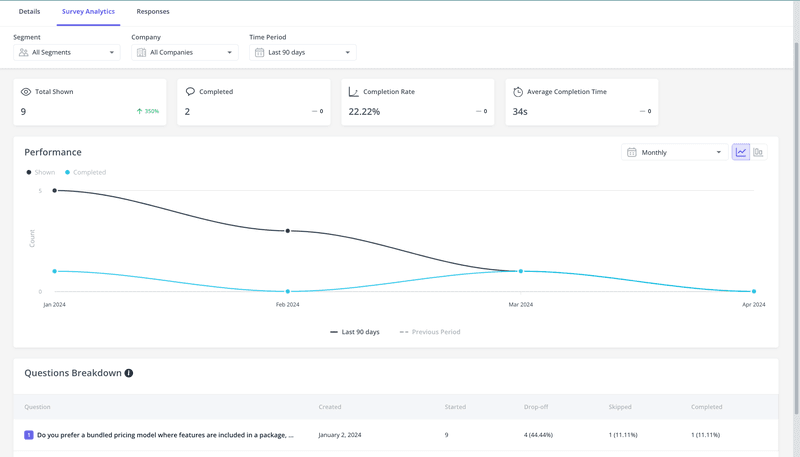
Next, surveys and questionnaires are a great way of collecting direct input from users regarding their experiences and satisfaction. Plus, you can use surveys and feedback forms to collect both qualitative and quantitative data.
In-depth interviews are another useful source of feedback collection. Similarly, there’s also Customer Development (CustDev), focused on uncovering customer needs and testing prototypes and ideas through specialized extensive interviews.
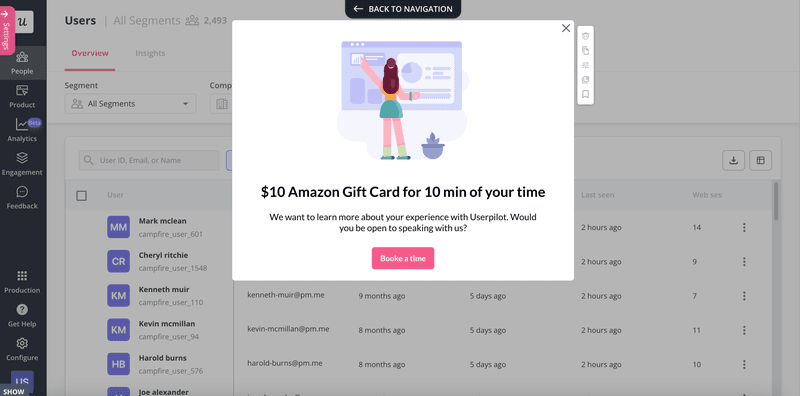
The great thing about surveys is that they can be sent to a large audience via email, website pop-ups, or in-app prompts. For interviews, you can send users targeted invite emails. After collecting the data, use statistical analysis to identify trends, common problems, and user preferences.
A/B testing
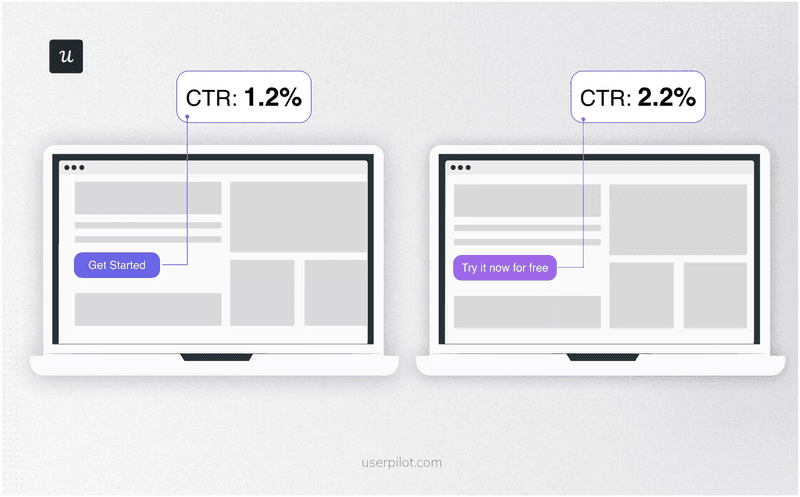
A/B testing entails creating two versions of a design to compare and determine which one performs better. However, running such experiments on your own can be hard. So, consider using A/B testing software like Userpilot that can automatically split traffic between versions to measure performance.
To analyze experiment results, the first step is collecting performance metrics. Next, compare these metrics for the two versions, such as conversion rates, engagement and satisfaction levels, and statistical significance.
The one with the best performance represents what users want and what you should implement in your data-driven design.
Usability testing
Usability testing is a user research method for evaluating a product’s ease of use and identifying improvement areas by testing it with real users.
To perform usability testing, conduct sessions where you observe users’ interactions as they complete tasks within your product. These sessions can be of multiple types, like moderated or unmoderated and remote or in-person.
Next, analyzing the results will help you uncover user experience issues, pain points, and inefficiencies. Based on these findings, you can refine your design process appropriately to improve your product’s usability.
Market research
User research is key to perfecting your data-driven design. However, your customer-centric focus shouldn’t lead you to ignore everything else.
Instead, ensure that you regularly conduct market research, gathering information on market conditions, competitors, and your target audience.
Helpful resources for market research include publicly available industry reports and trends, product websites for competitor analysis, and online databases.
Simply accessing all this data isn’t enough, though. You must understand the market positioning of various competitor products, identify gaps, and use this knowledge to inform strategic design decisions.
Implementing data-driven decisions in UX design
Now, it’s time to put together your UX design strategy backed by data-driven decision-making and analytics. To do so, let’s take a look at the basic steps necessary to ensure that user needs are accurately met and satisfied.
1. Define your objectives
The first step in implementing data-driven decisions is goal-setting, which means defining the overall goals of your UX design project. Start by identifying specific outcomes to achieve, like improving user satisfaction, increasing conversion rates, or reducing drop-off rates.
Next, determine relevant metrics, like user engagement, task completion rate, and bounce rate, to measure success.
Lastly, review past performance data to establish baseline metrics for comparison with new designs.
2. Collect user data
Start by selecting relevant data sources to focus on, user analytics, surveys, or session recordings.
Try configuring tools like Userpilot and Google Analytics to help develop A/B and usability tests, and deploy surveys to gather qualitative data.
Collecting data is a continuous process, so ensure all data is stored in an organized manner. Use data management tools for this purpose, to collate and categorize data for easy analysis.
3. Interpret and analyze your data
A crucial part of the data-driven design process is analyzing all the quantitative and qualitative data collected.
Use analytics tools to quickly assess metrics like user flow, conversion rates, and engagement statistics. Similarly, use tools for statistical analysis of A/B test results to determine the significance of the findings.
Pay equal attention to user feedback, reviewing survey responses and usability test observations to identify common problems and suggestions. Lastly, combine quantitative and qualitative data for a more comprehensive understanding of user behavior and preferences.
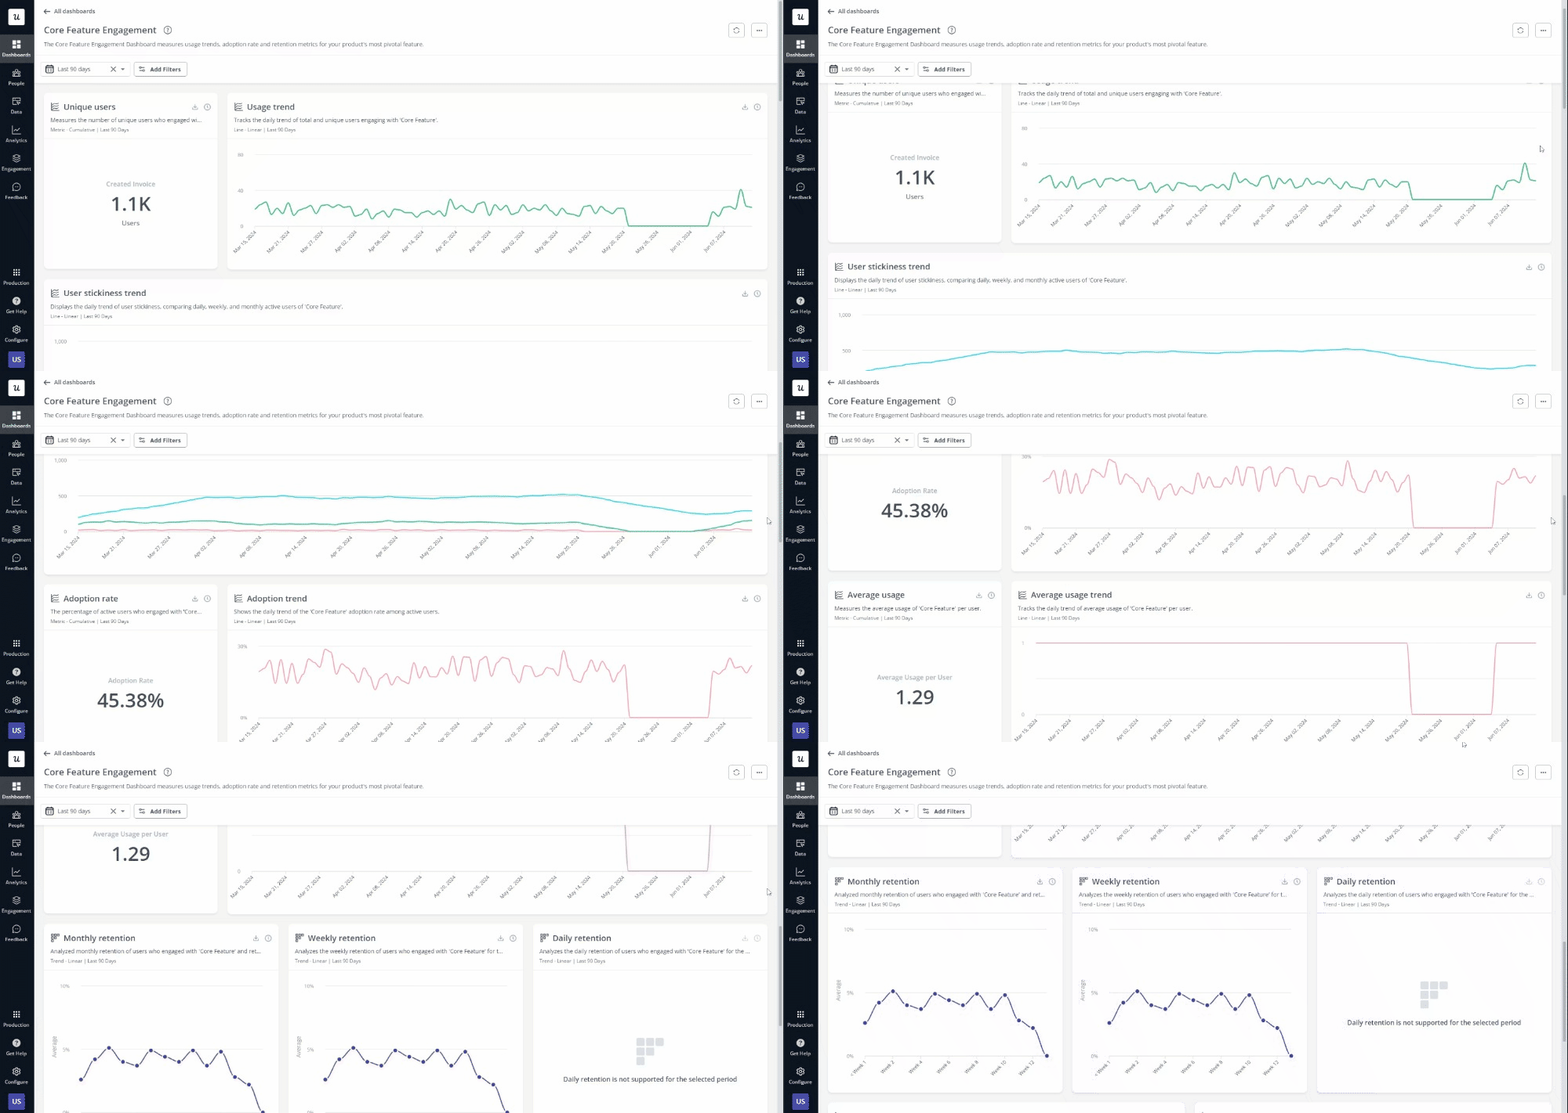
4. Act on your findings
Finally, implement your decisions based on data insights by identifying and then prioritizing specific design changes or improvements based on impact and feasibility. Prepare presentations and reports for stakeholders, using visual aids like charts and graphs to communicate recommendations clearly.
After approval, make the necessary adjustments, involving design and development teams early on to ensure a smooth transition.
However, the job isn’t over after implementation!
Track how the design changes perform to see if they achieve the desired outcomes. Continuously collect data to assess the effectiveness of changes and identify new improvement areas, making iterative enhancements to the UX design.
Conclusion
Focusing on data-driven design is crucial for creating user-centric products that meet customer needs. By setting clear goals, continuously collecting and analyzing user data, and implementing informed design changes, you can enhance your UX design in no time.
Remember to leverage diverse data sources instead of a single one for the greatest impact. A few important ones to keep in mind include user analytics, surveys, feedback forms, A/B testing, and usability analytics.
Want to get started implementing your own data-driven design? Get a Userpilot Demo and see how you can improve user satisfaction.


