As a product manager, intuition only takes you so far. You can design a feature that feels right, but until you understand how users actually interact with it, you’re just guessing. That’s why product analytics has become such an essential part of how my team at Userpilot works.
When we release something new, I really dig into how users behave. Do they explore the feature the way we wanted? Do they get stuck halfway? Are they coming back to it regularly? All those answers live inside your product analytics data.
For product managers and product teams, this data fills in the gaps that customer interviews and surveys can’t. It shows real user behavior: the clicks, the drop-offs, the paths users take in the product. With the right product analytics tools, you can turn those patterns into actionable insights that lead to better design and data-driven decisions.
Let’s break this down further. In this post, I’ll explain what product analytics is, why it matters for PMs, and how we at Userpilot use it to build experiences that keep our users happy.
What is product analytics?
At its core, product analytics is the practice of collecting, watching, and understanding data about how people use a product or service. It’s about tracking every click, every input, every swipe, every user interaction that takes place in your app.
Unlike tools like Google Analytics that focus on web traffic, product analytics tools let you look deeper at in-app behavior.
Think of it this way: when we build a product, we create a user journey. Product analytics helps us map that journey. It tells us where users start, where they go next, where they get stuck, and what features they use most often. We do this by setting up a way to track these actions, which we call “events.”
For example, if you want to know how many times someone clicks a “Save” button, you set up an event for “save_button_click.” Over time, collecting behavioral data like this helps us build a clear, numbers-based view of how users engage.
At Userpilot, for instance, our platform lets us automatically capture events like clicks, text inputs, and form submissions. This auto-capture feature starts collecting historical data from the moment we install Userpilot, giving us real-time insights into user behavior without any manual setup beforehand. This raw event tracking data is the foundation for understanding our users at a deep level.
When you pair this with qualitative data like user feedback, surveys, or interviews, product analytics gives you an even more complete picture of your users!
Why does product analytics matter?
While I think that gut instinct plays a big role in product design, if you want the truth, you need data. That’s the real benefit from product analytics: it replaces all the guesswork with clarity. It lets you turn assumptions into something you can test, measure, and act on with real, useful product data.
Instead of wondering how your users cover the customer journey, you can actually see it. With product analytics solutions, you can track all kinds of usage data, see which features drive more user engagement, and quickly spot areas for improvement. It’s all very real, tangible, and actionable.
Different teams look for different answers in data. But for me, it’s about answering three fundamental questions:
How much time do users spend on key features?
Which paths do they take to reach their goals, and are those paths efficient?
What actions do they perform most, and which ones are they ignoring?
These insights are powerful. They help us at Userpilot understand our users better and see how every design choice we make impacts their experience. Instead of making decisions in the dark based purely on intuition, product analytics gives us the quantitative data to validate our thinking (or prove it wrong). That’s how product managers close the gap between assumptions about user behavior and reality.
A strong product analytics platform also makes you better at spotting and reducing user friction, which is anything that prevents users from reaching their goals. This direct insight helps you make your product an essential part of your users’ daily work, improving product usage, adoption, and overall customer satisfaction.
What is the difference between product analytics and data analytics?
The difference between product analytics and data analytics is mainly about focus and scope.
Product analytics looks specifically at how users interact with a digital product or service. It tracks user actions, feature adoption, and engagement across the customer journey so teams can improve product performance and retention.
Data analytics, on the other hand, takes a broader view. It studies all types of business data (from finance and operations to marketing) to find trends and guide business objectives.
In short, product analytics tools offer specialized insights for product managers and product teams, while data analytics systems are part of wider business intelligence and web analytics efforts. Both rely on quantitative and qualitative data, but product analytics gives a more detailed, actionable view of how users experience your product.
How do you implement product analytics?
So, how do we put product analytics to work in practice? Let me walk you through some of the ways my team at Userpilot leverages these insights every single day:
1. Understand how users interact across the user journey
We start by visualizing how users move through our product. This helps us understand overall user behavior and see how different user groups move through the customer journey.
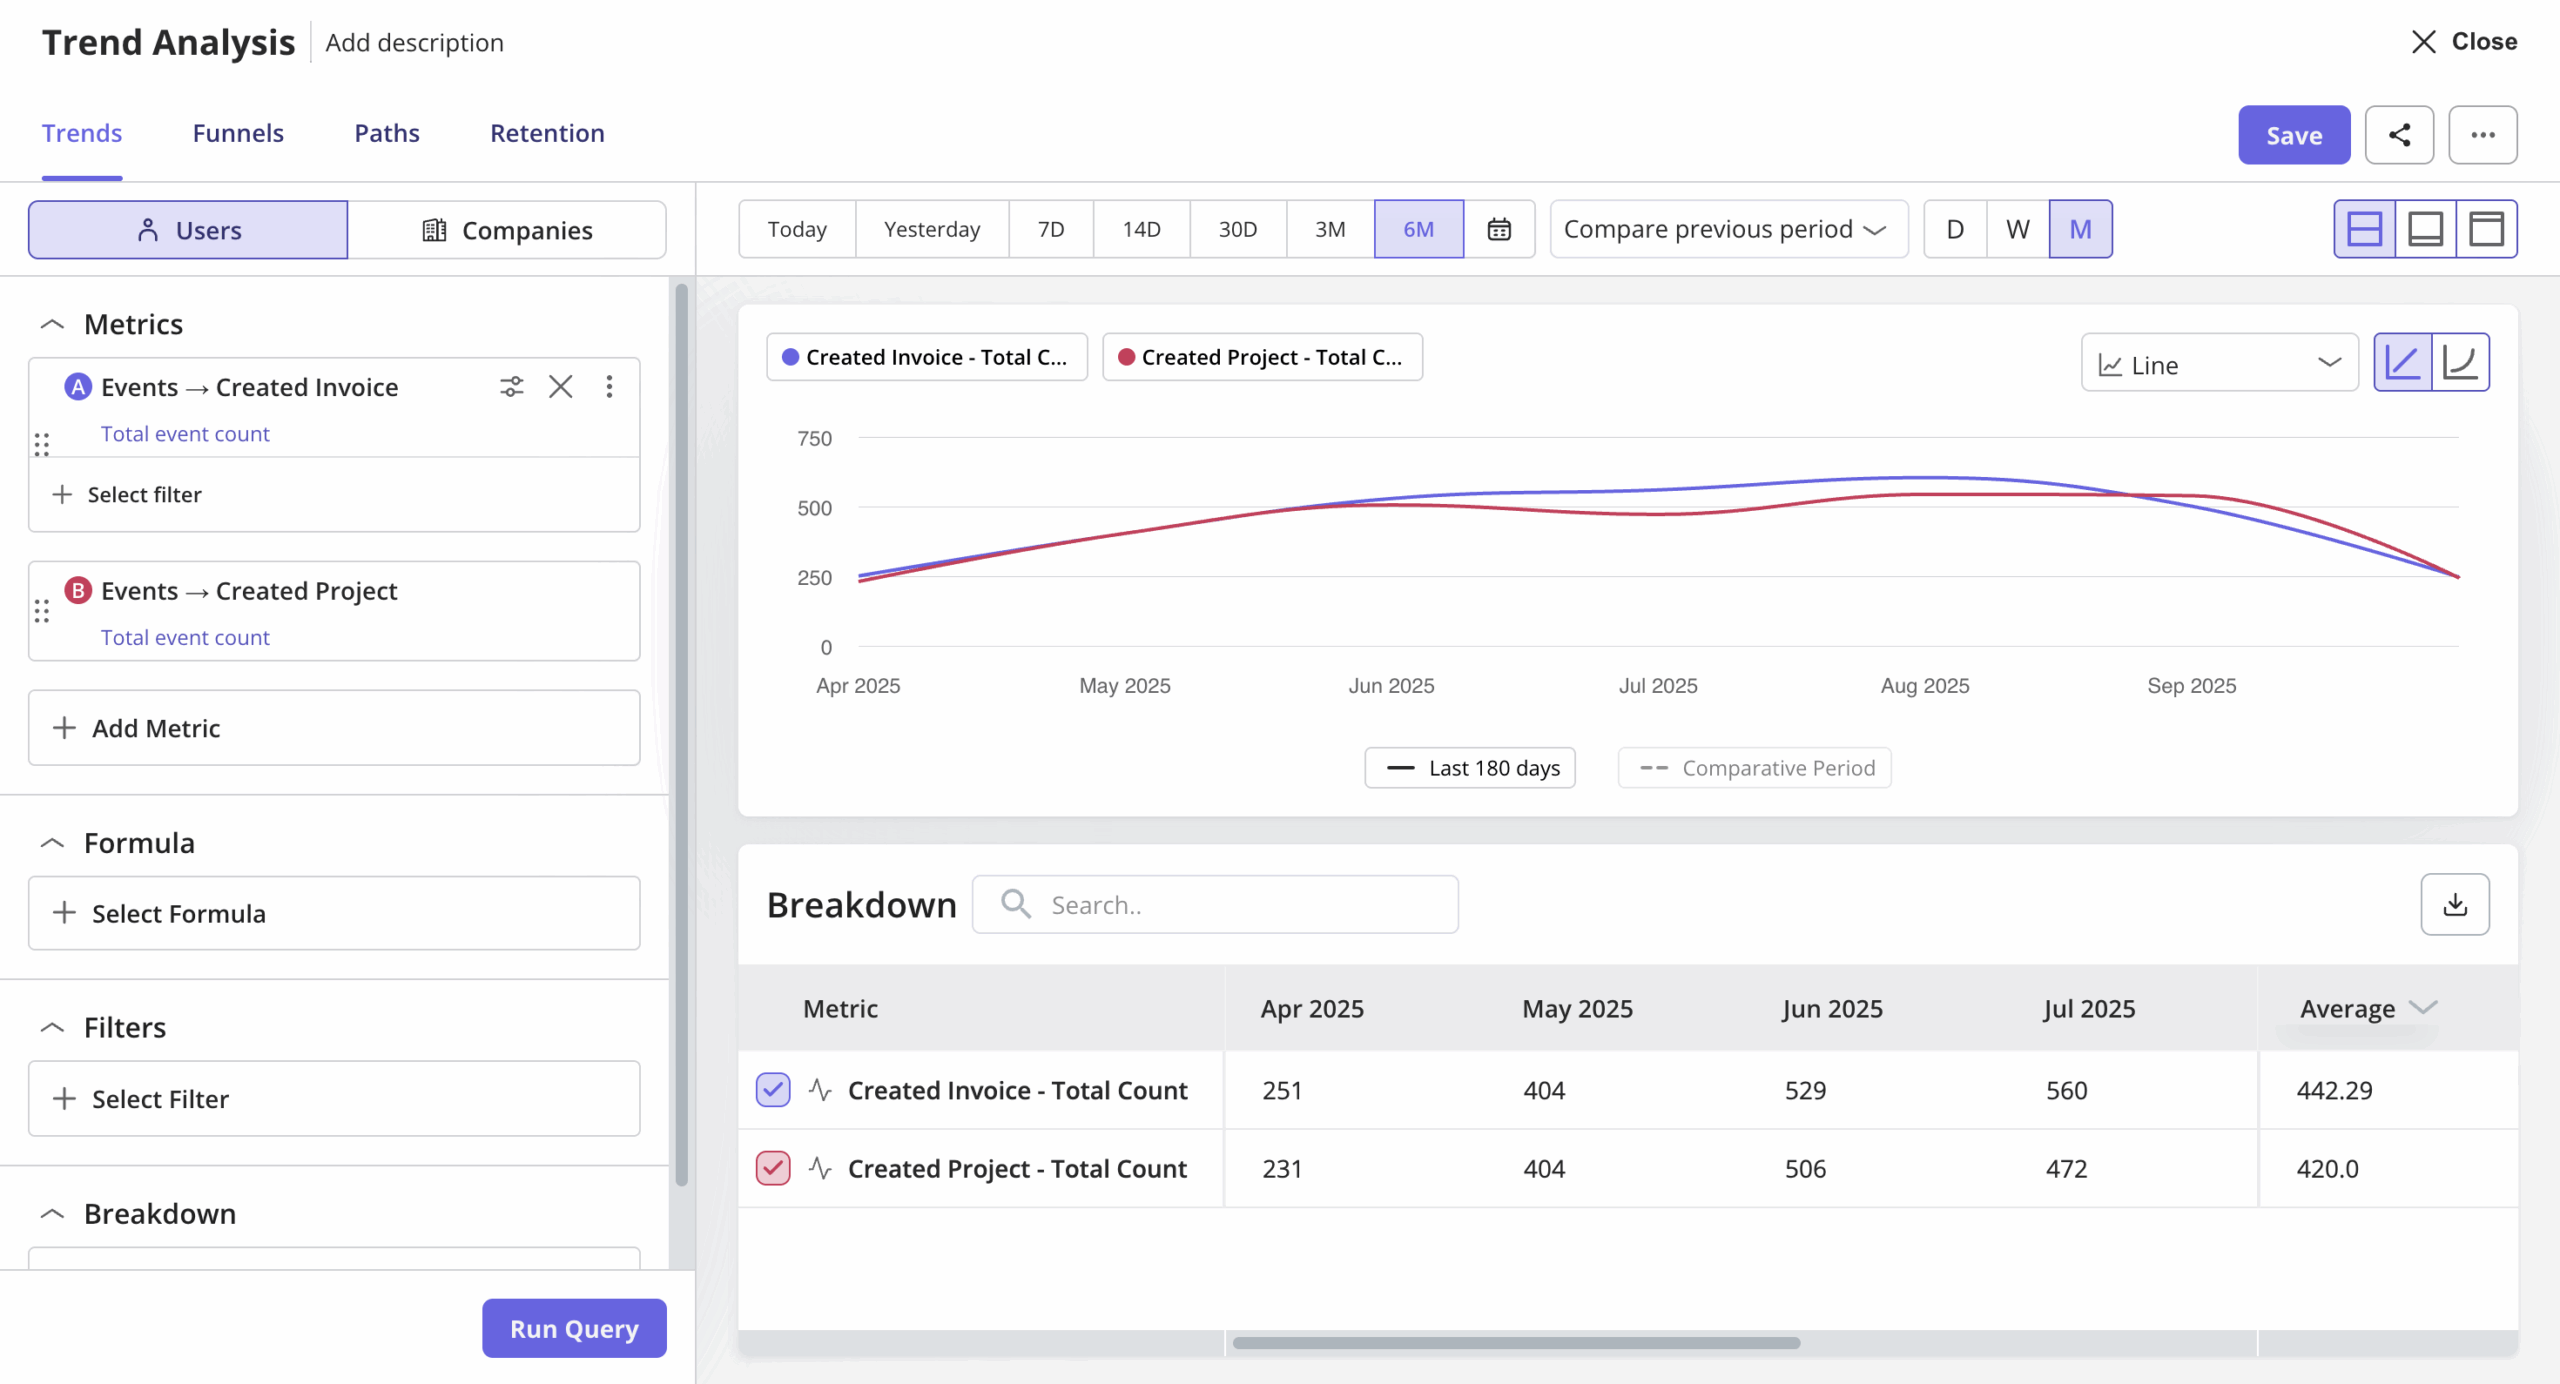
For example, our funnel analysis tools allow us to map out a sequence of steps, from a new user signing up to completing their first project. We can track how many users reach each milestone, identify where they drop off, and analyze key metrics that show what’s working.
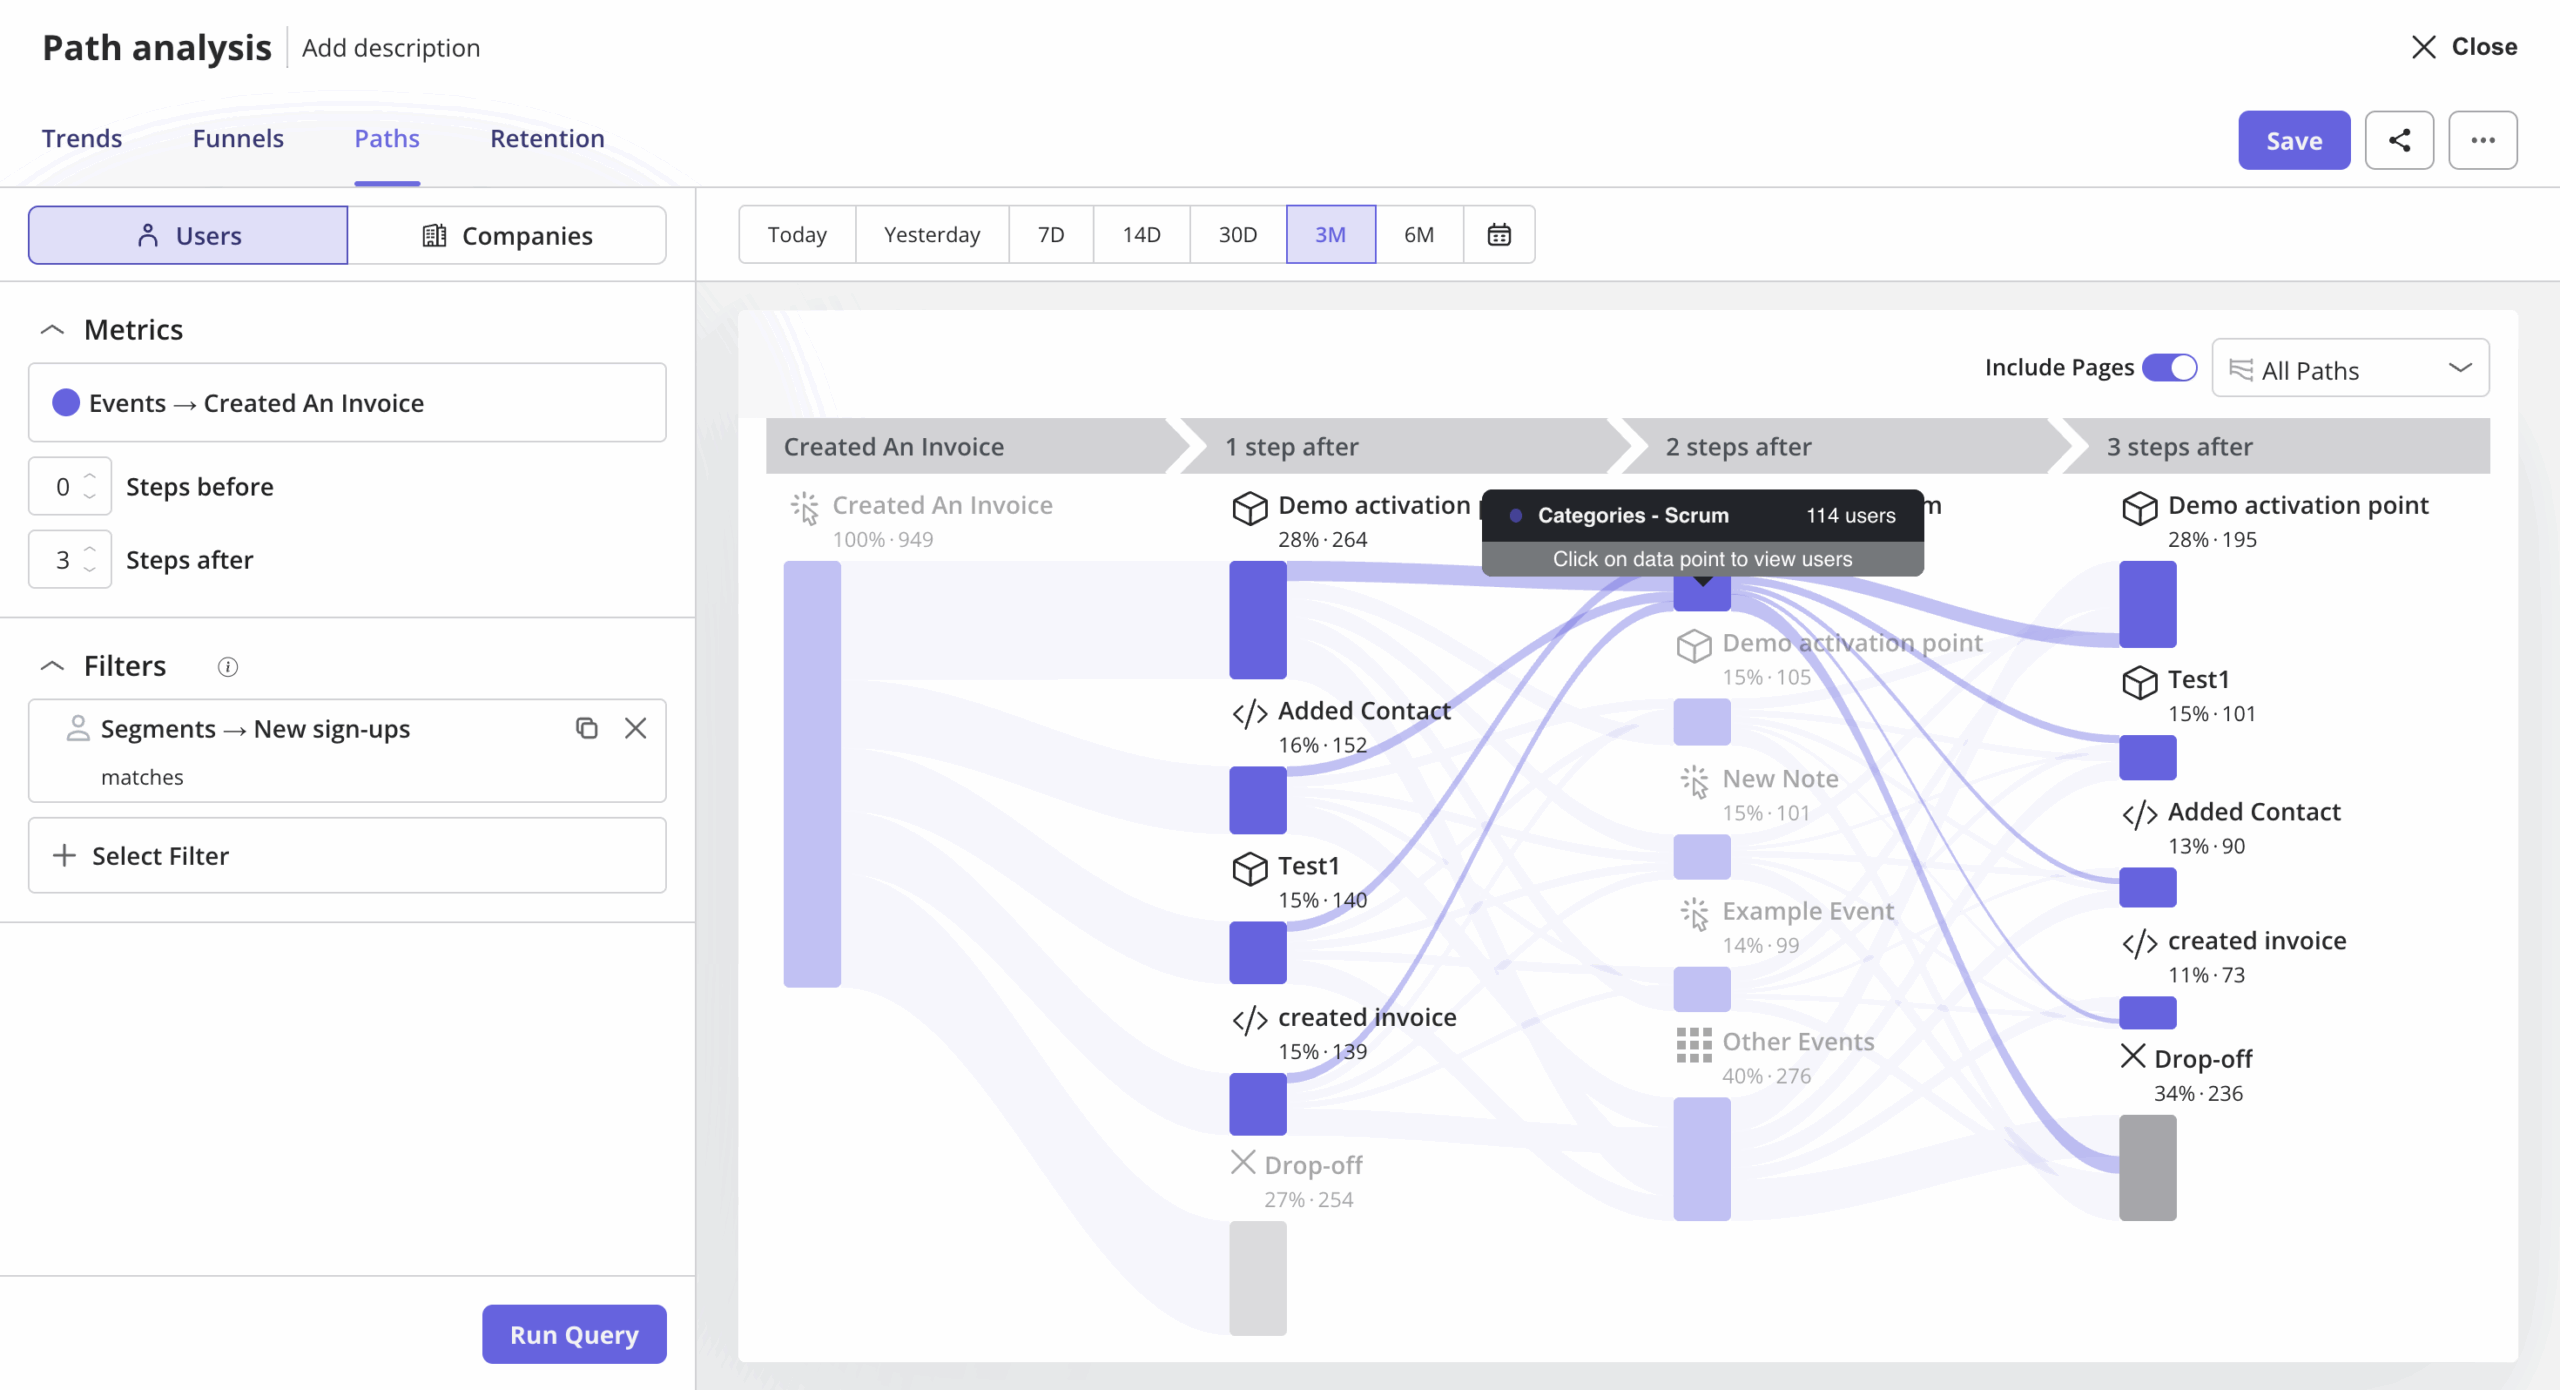
But not every journey is linear. That’s why we also use path analysis to explore all the different routes users take before or after a key action. This often reveals unexpected patterns in user activity and behaviors, helping us find friction points that we would’ve missed otherwise.
To really dig deep, we pair this with session replay. Numbers tell us what happened, but session replay shows us how it happened. I find this incredibly useful as a product designer. Watching a user’s actual session helps me understand user struggles and see exactly where our design might be falling short.
Together, these tools are the foundation of our product analytics system. They give us all the detailed data we need to make informed decisions for the best user engagement, retention, and product performance possible.
2. Track user behavior to measure engagement and adoption
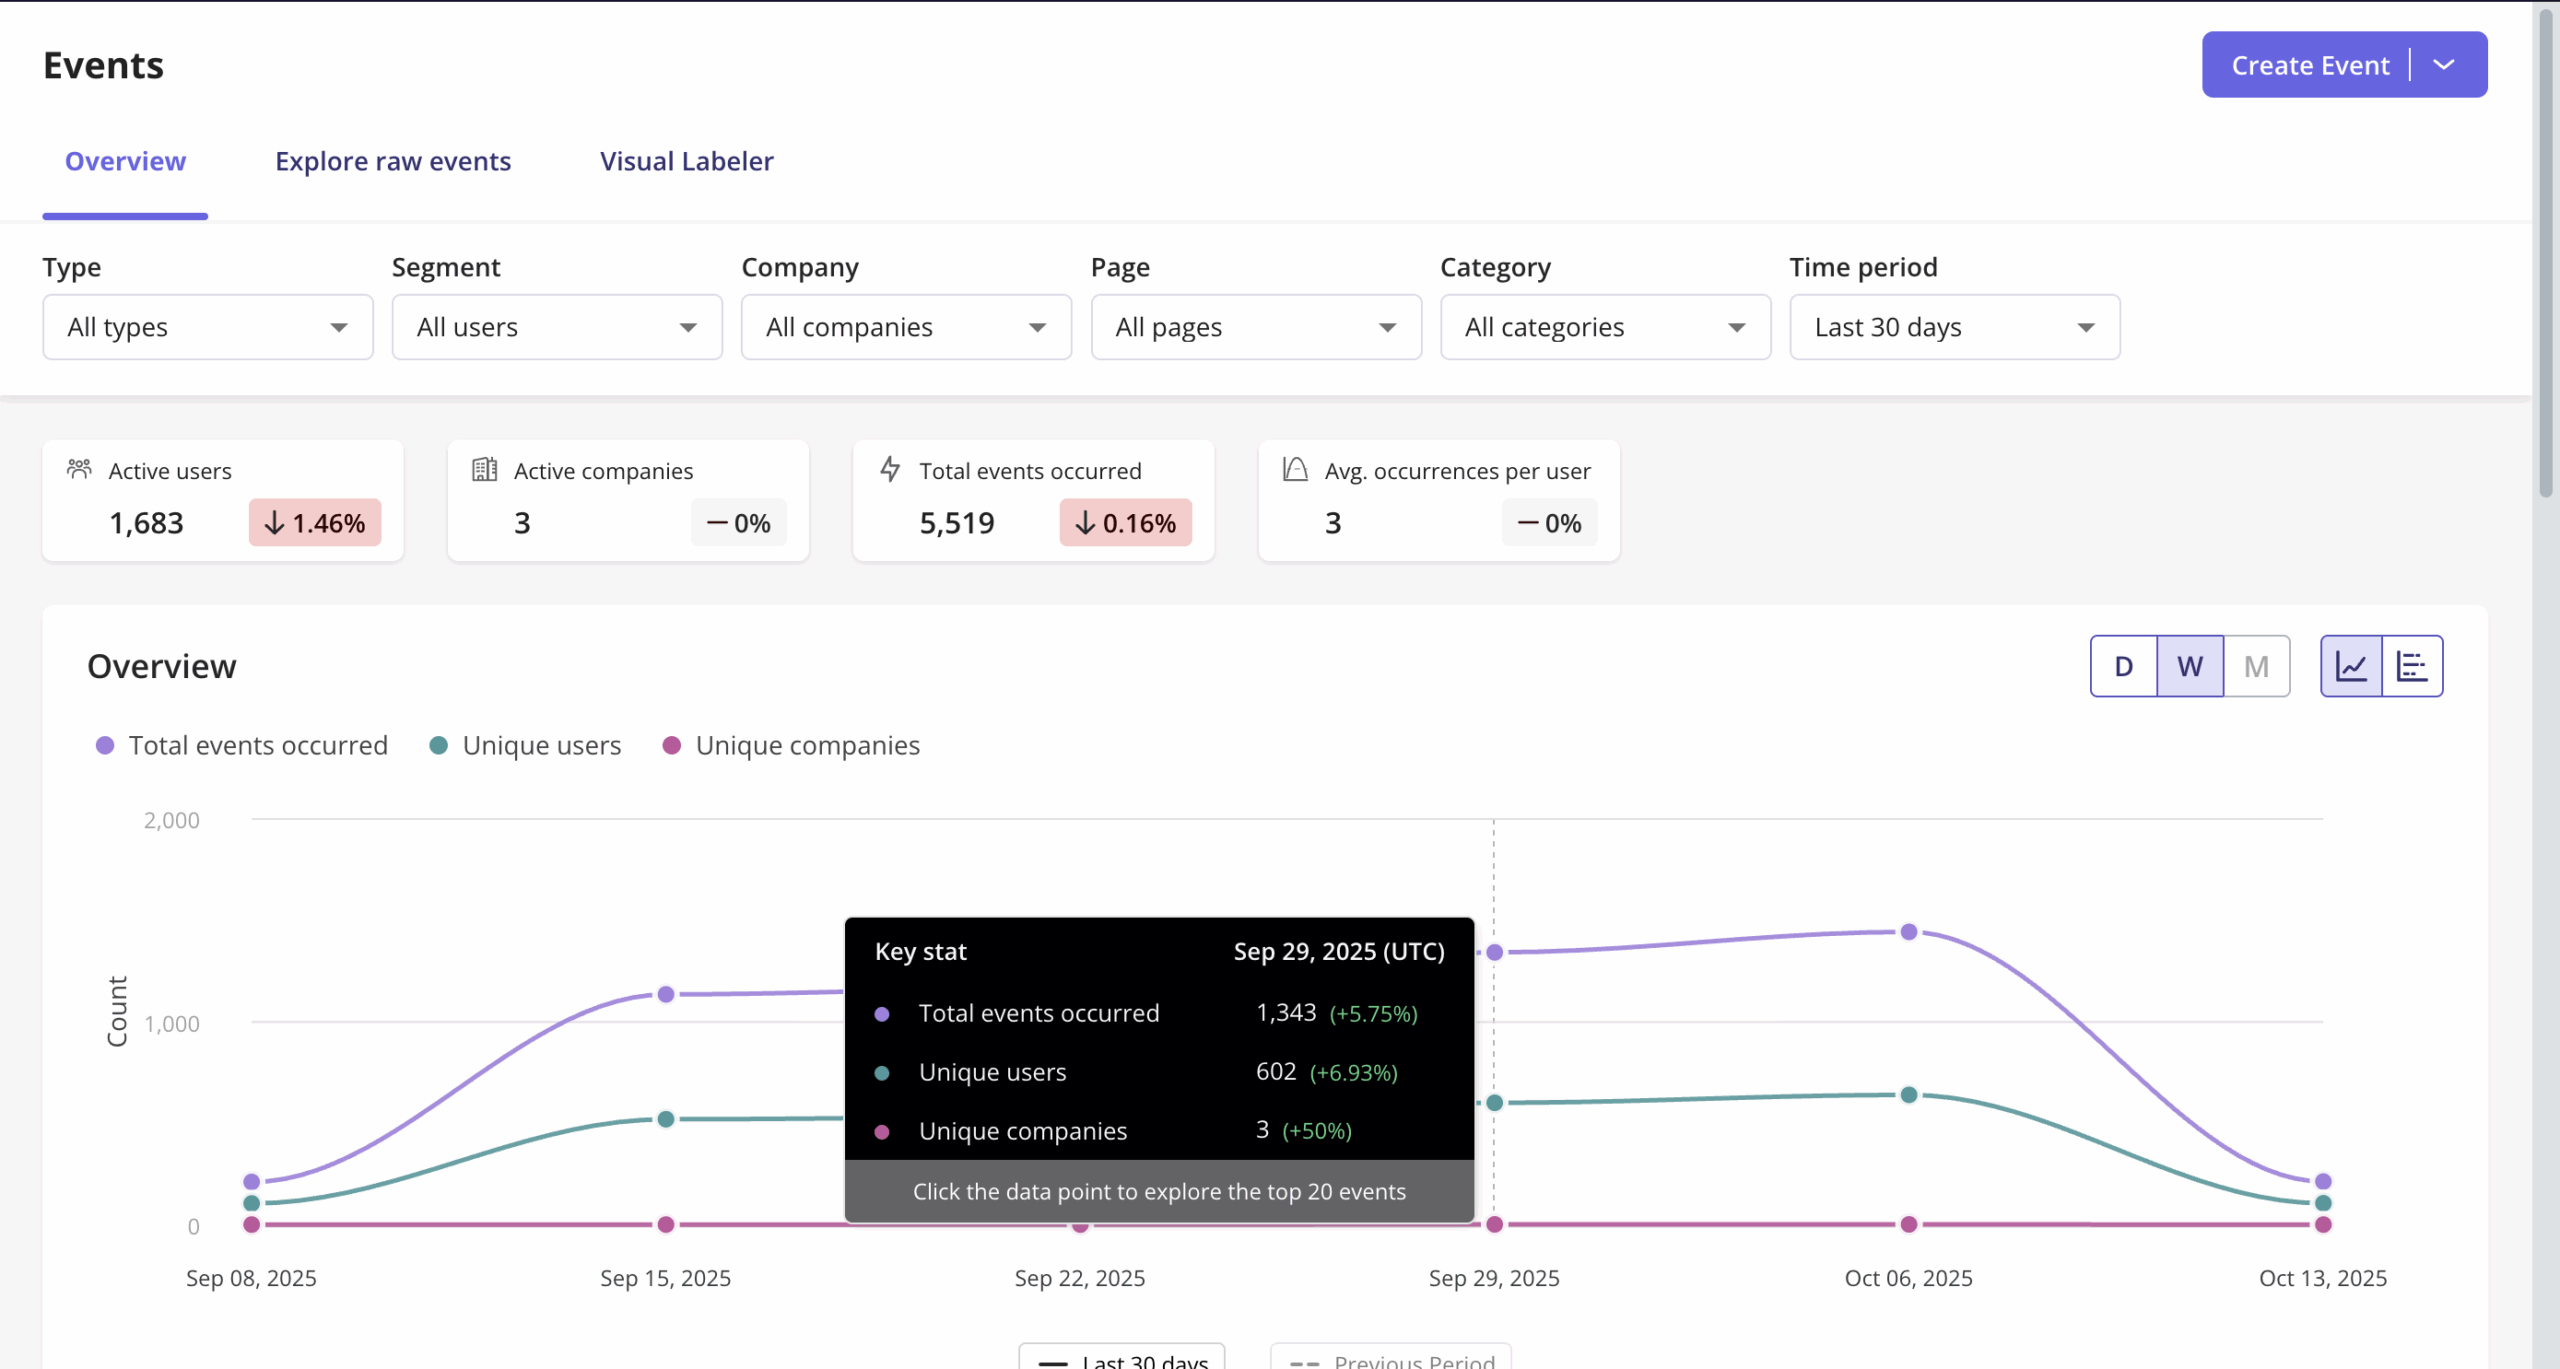
Once we understand the journeys, we focus on specific metrics. We track product usage metrics to measure how engaged users are with individual features. For example, our Core Feature Engagement Dashboard shows us usage trends for the features that matter most. We find important insights about which parts of the product users find valuable and which might need a redesign or better in-app guidance.
We also keep a close eye on Daily Active Users (DAU), Weekly Active Users (WAU), and Monthly Active Users (MAU). These metrics tell us about user stickiness, specifically how often users return to our product. If these numbers are low, it signals a need to enhance the core product experience or improve our customer engagement strategies.
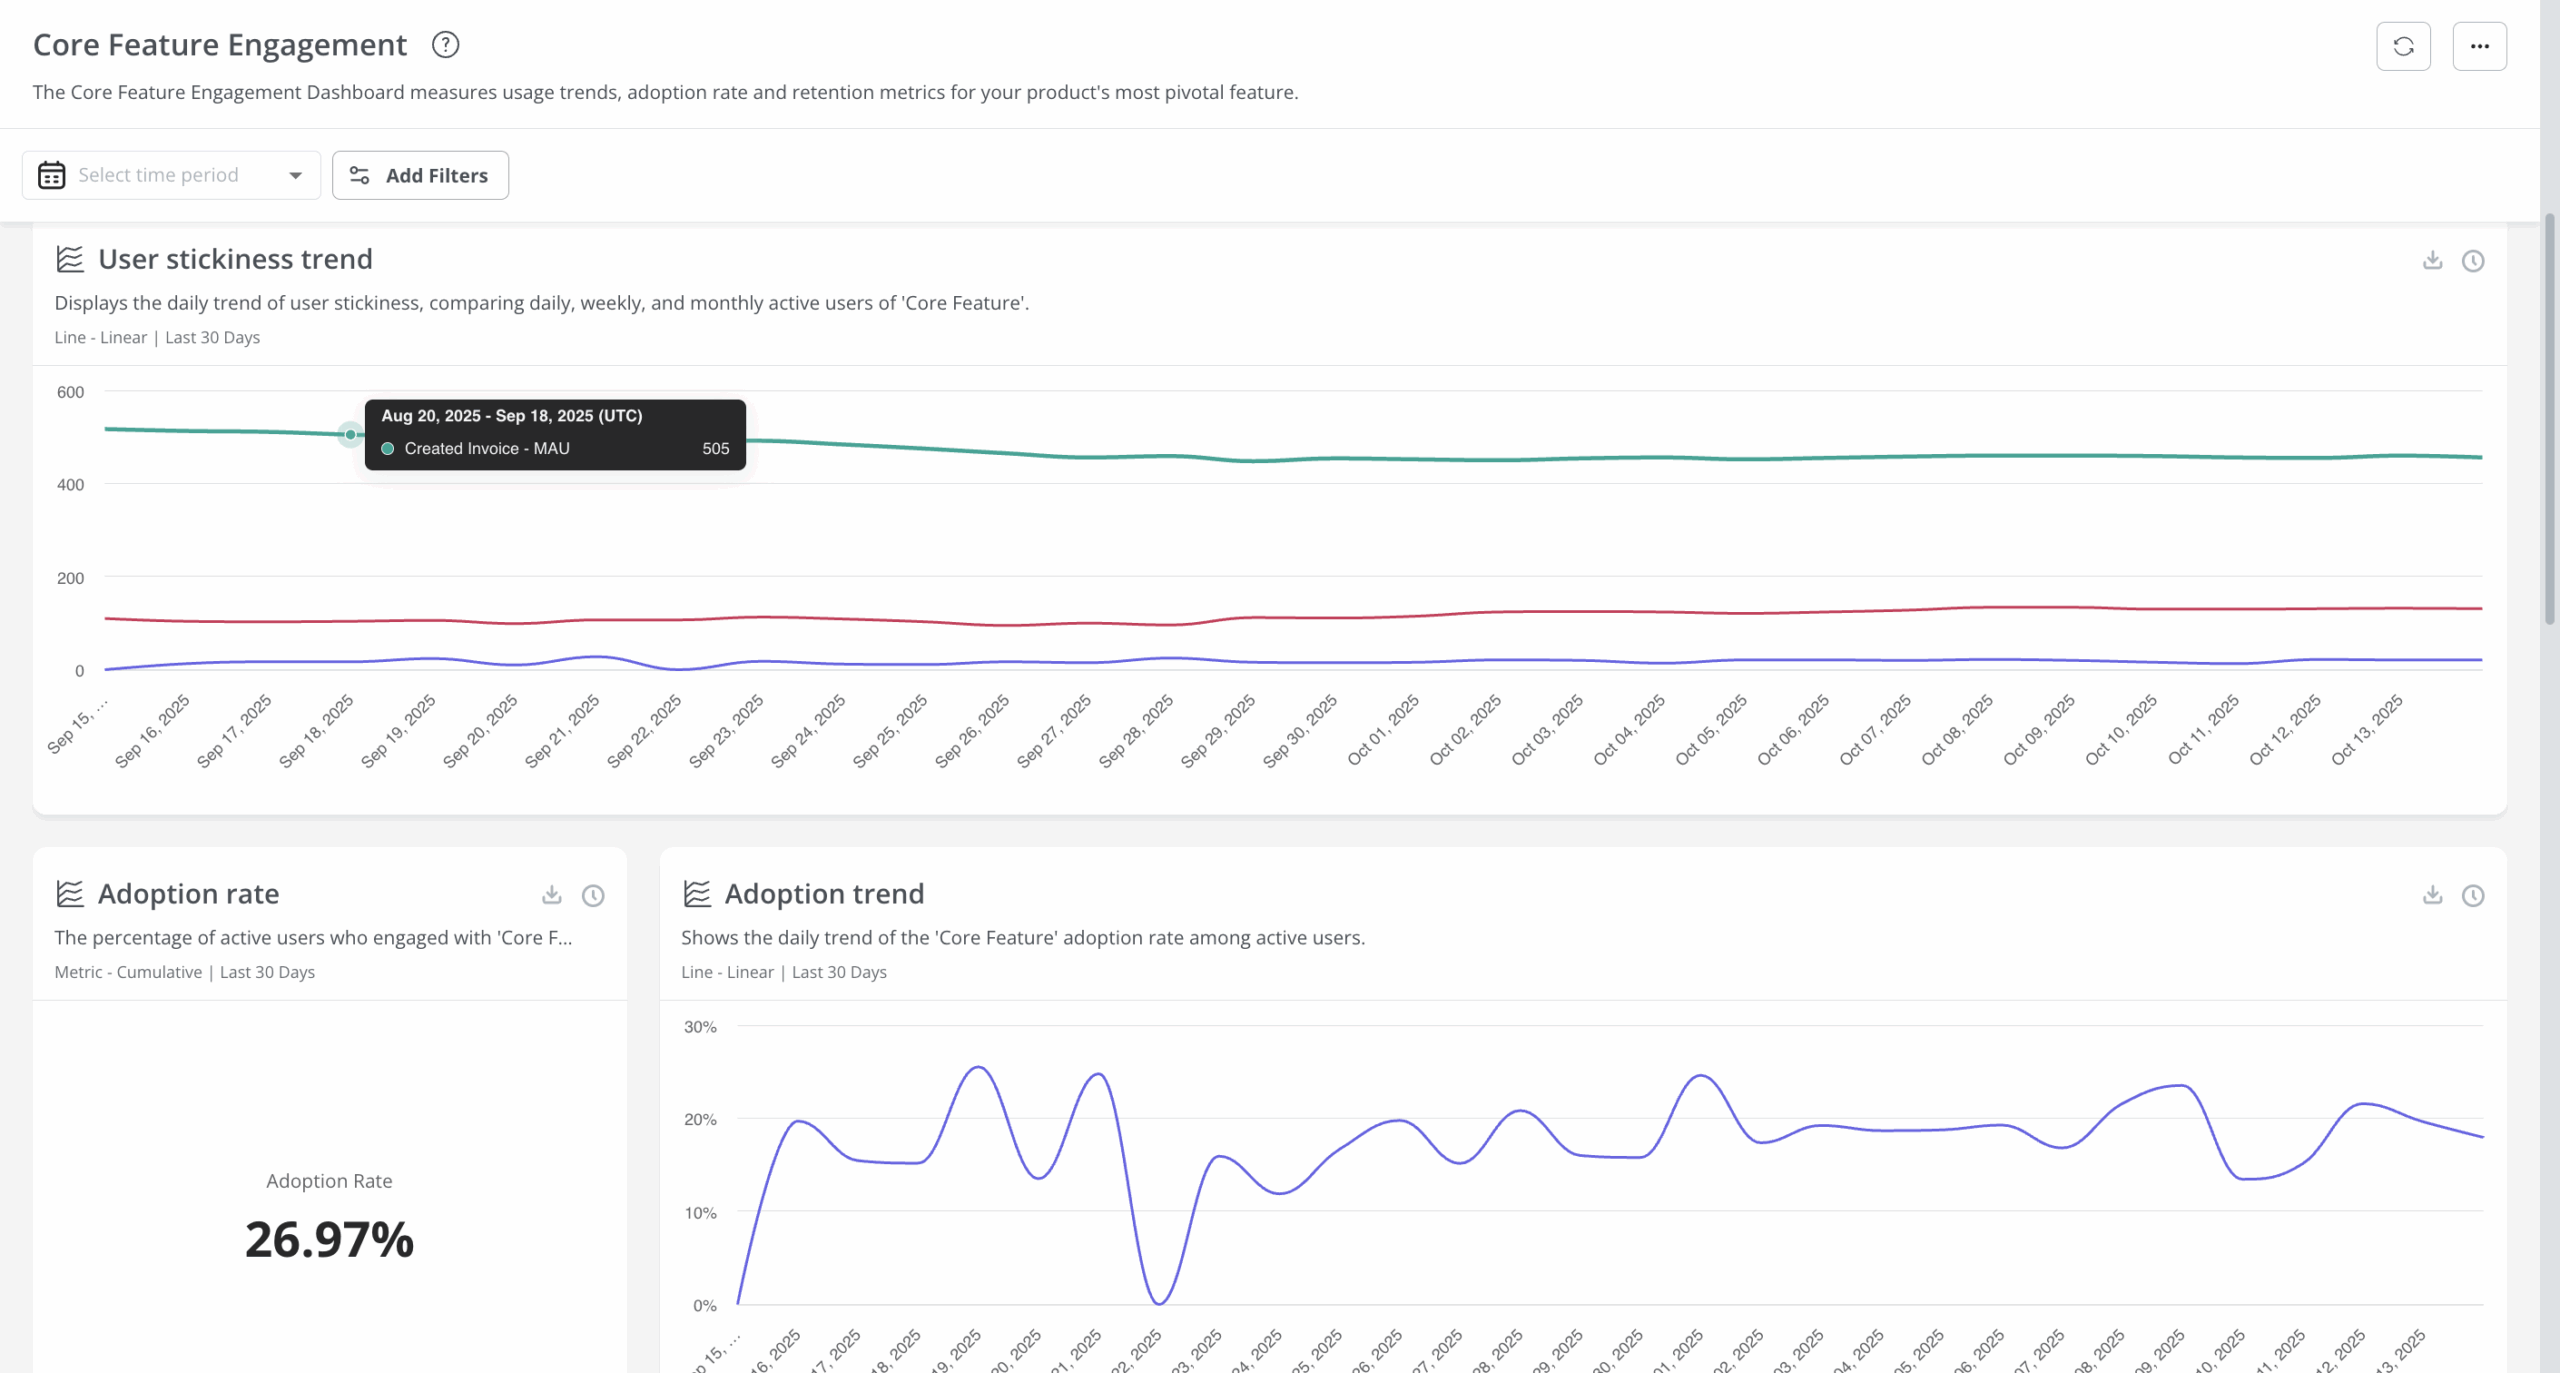
If you’re using tools like Userpilot, this process becomes a lot easier. The platform automatically collects product analytics data and then visualizes it in intuitive dashboards. You can track which features or flows drive the most engagement, identify high-value customers, and analyze adoption patterns without writing any code whatsoever.
Companies like Cyberbiz have seen this in action. Their team used Userpilot’s analytics to guide a major admin panel redesign. They tracked page views and session durations to find the features that mattered most and see how users behaved after each update. With this data-driven approach, Cyberbiz improved feature adoption, reduced support tickets, and made faster, more confident product decisions.
As Wei-Di Huang, Senior Product Manager at Cyberbiz, put it:
This launch is quite successful compared to others because the support tickets are low… In Userpilot, we can connect user data and the feedback together to see the feedback from a specific user.
But we’re taking this a step further! We’re adding AI-powered analytics so that finding insights can become even faster and more actionable. With the upcoming AI Generate and AI Insights capabilities, you’ll be able to ask questions in natural language, like “Which features saw a drop in engagement this week?” and instantly get breakdowns by segment, geography, or plan. The AI will detect anomalies, correlate user behavior, and even generate ready-to-use reports or in-app flows.
These new features will make the analysis process that much quicker and be a huge help to product managers and customer success teams in making more informed decisions. It’s just one more way Userpilot is becoming an ideal product analytics solution for teams to go from just tracking data to acting on it.
3. Gather targeted feedback
You need metrics to know what actions your users are taking. But there is no substitute for letting those users actually explain to you what motivates those actions, and how they feel about the experience.
That’s qualitative data, and at Userpilot, we use in-app feedback tools like NPS surveys to capture it. These simple surveys, often triggered contextually, tell us how likely users are to recommend our product, segmenting them into Promoters, Passives, and Detractors. For example, a low NPS score from a Detractor means we need to dig deeper into their experience to understand their pain points, perhaps with follow-up questions.
As a product designer, I often review NPS responses alongside our product analytics metrics. For example, if a Detractor reports frustration, I’ll dig into their recent user behavior (with session replays, for example) to see what might have caused it. Over time, I’ll find patterns: usability issues, onboarding friction, or feature discoverability.
Those insights are what help product managers and product teams successfully connect quantitative and qualitative data, find hidden pain points, and optimize product performance.
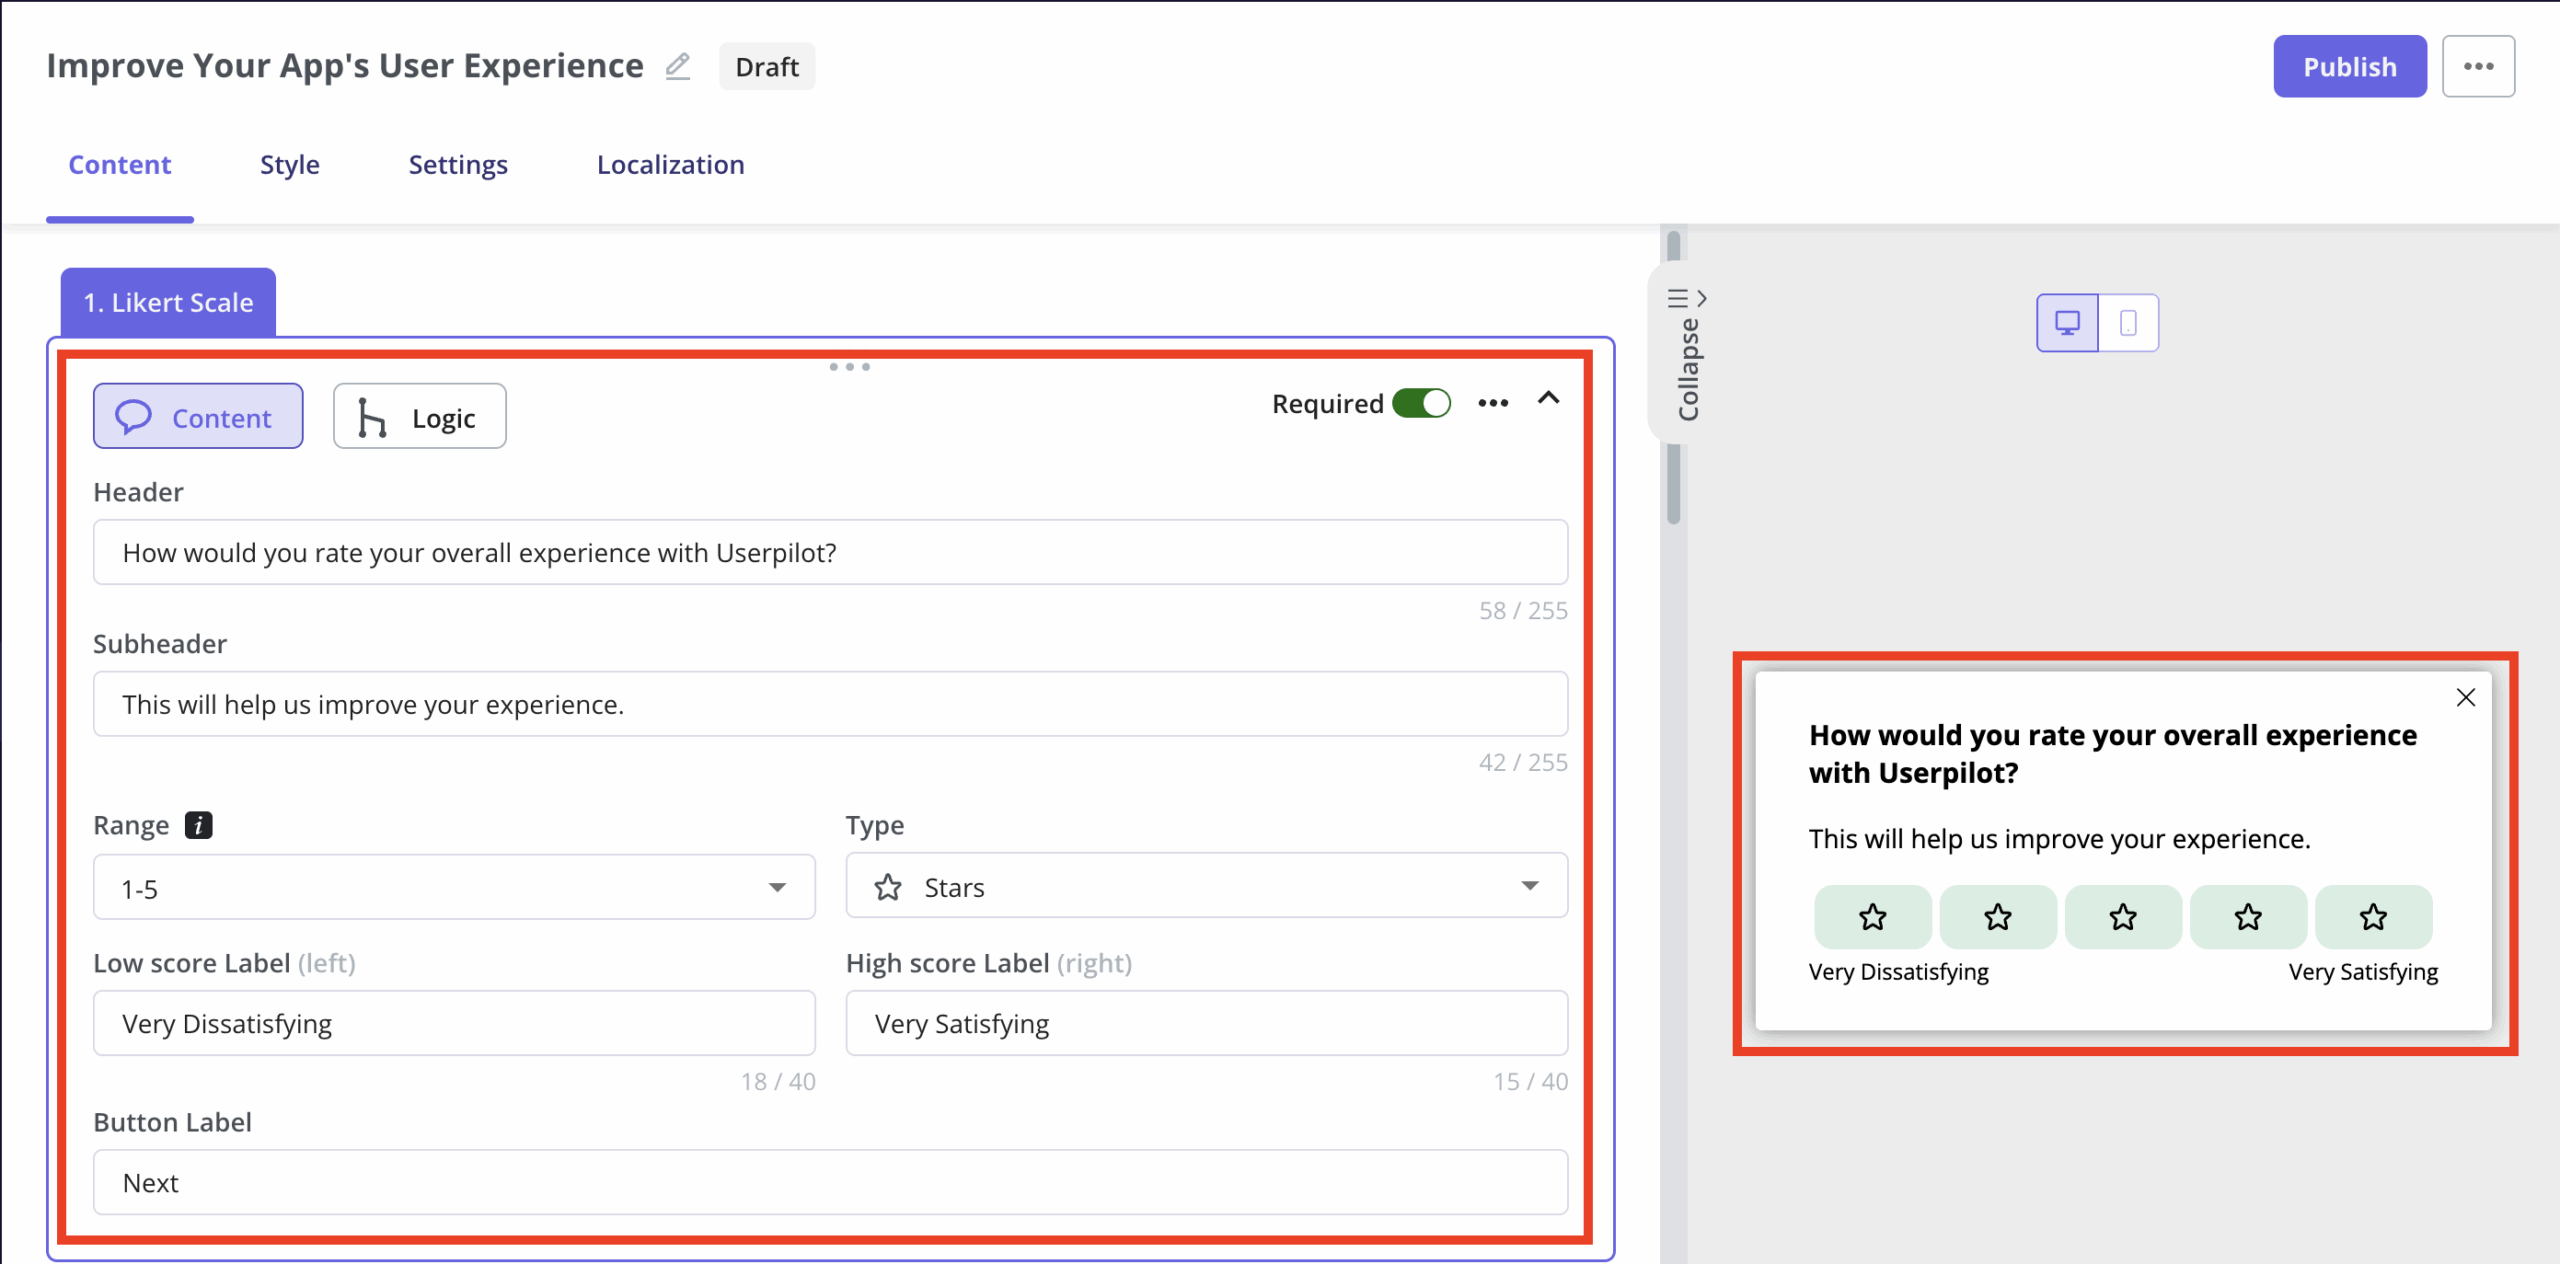
Beyond NPS, we also use in-app surveys to collect feedback on new features, usability, and satisfaction. The responses directly inform our development priorities and help us improve experiences on both web apps and mobile apps. Our surveys can include multiple choice, open text, or Likert scale questions, and they can even be set up with survey logic to show questions based on previous answers, making the feedback process smoother for the user.
We’re now working on making this process even faster. Soon, Userpilot’s AI Insights will automatically summarize open-ended survey responses, spot common themes, and link them to behavioral metrics. This will help teams analyze data faster and turn feedback into actionable product analytics. It’ll also help them connect their survey results more easily with performance indicators like user retention and customer loyalty.
4. Test and iterate
Building a great product is an ongoing process of experimentation. We use A/B testing to validate ideas and measure the impact of design or UX changes. For example, we might compare two onboarding flows to see which one leads to higher customer activation rates or improves overall business value.
If you’re using Userpilot, this is a very simple process because it already has experimentation features built in. So you can set up, launch, and measure A/B tests for flows without any extra software development kit or complex setup. You can monitor how different versions perform, track product analytics metrics, and quickly see how those variations affect key performance indicators like adoption or engagement.
This data-driven mindset has helped many of our customers, too. Smoobu, for instance, used Userpilot to experiment with in-app walkthroughs for new users. Their team tested two variations of a sign-up flow and saw a 17 % increase in conversions among users who experienced the guided walkthrough. As Dasha Frantz, Product Designer at Smoobu, explained:
Userpilot allows us the flexibility to move fast, experiment, and really understand what users need. It’s helped us speed up processes and create a smoother user experience.

This iterative approach, part of a lean experimentation framework, lets us fail fast and learn quickly. Instead of launching a major redesign based on a hunch, we test small changes, measure their impact with product analytics, and then double down on what works. It’s a simple but powerful cycle, backed by solid data and continuously monitoring user behavior through our digital insights platform.
How to get started with product analytics
If you’re looking to embrace product analytics, here’s how I’d advise you to get started:
1. Choose the right product analytics solutions
You need tools that can capture rich behavioral data, visualize user journeys, and allow for easy segmentation.
At Userpilot, we built our product analytics software with product managers and product teams in mind. It automatically captures in-app events, session replays, and feature usage without needing extra setup or tech support.
Apart from autocapture, here’s what else it includes:
Dashboards & reports: Get an overview of feature adoption, activation trends, and key indicators that show what’s working.
Segmentation: Filter and analyze product analytics data by behavior, company, or plan to find patterns that drive engagement.
Session replay: Watch how users interact in real time so you can understand the context behind usage metrics and friction points.
AI-powered insights (coming soon): Summarize trends, detect anomalies, and surface correlations faster with built-in intelligence.
You can also connect your analytics with broader data management platforms and business intelligence tools to get a complete view of your product’s performance. This lets you tie engagement and usage patterns to bigger outcomes like customer lifetime value and overall business growth.
But I think what truly sets Userpilot apart is its ability to do more than product analytics. Once you’re done gathering data, you can immediately act on it. Because Userpilot also offers an engagement layer, you can build in-app experiences directly from your insights.
For example, if your dashboard data shows that new users drop off before completing setup, you can instantly trigger a checklist or tooltip flow to guide them through the missing step. It’s a quick, easy way to optimize user journeys and improve adoption across your marketing channels without switching around tools.
2. Plan your data strategy
I feel like this is a good time to mention that even the best product analytics tools won’t help if you don’t know what you’re looking for. Before jumping into custom dashboards, take the time to plan how analytics fits into your overall decision-making process.
A solid data strategy gives your work direction. It defines what kind of information matters, how it’ll be used, and who’s responsible for interpreting it. That kind of clarity is what keeps you from drowning in reports or chasing vanity metrics.
Think of your analytics software as a support system, rather than the strategy itself. The real value of product analytics comes from using it with purpose and consistency, not just collecting numbers for the sake of it.
We talk about this more in our Guide to Product Analytics, but the idea is that analytics is about having direction, not just collecting data. A well-defined purpose helps make sure that every insight you collect gets your product closer to actual business outcomes.
3. Define goals and key metrics
Once you’ve got a clear strategy, you need to decide what success will look like for your product. Start by defining what you want to achieve: is it improving activation, increasing retention, or boosting adoption? Then, choose key metrics that can actually measure that progress. For instance, activation might be tied to the number of users completing a setup flow, while retention could track how often they return after a week or a month.
Once your goals and metrics are clear, product analytics basically becomes your feedback loop. You can see how users behave, measure how each change impacts those metrics, and then adjust your approach based on evidence instead of assumptions.
What I find exciting is how AI is beginning to make this process even simpler. Soon, Userpilot’s AI will be able to analyze performance automatically: flagging when a key metric dips, spotting unusual patterns, and even suggesting actions to get back on track.
4. Foster a data-driven culture
Product analytics shouldn’t be a siloed effort. That’s why you need to empower everyone on your team to access and understand the data, not just product managers or analysts. When designers, marketers, and engineers can see what’s working (and what’s not), it becomes that much easier to make quick, informed decisions together.
At Userpilot, we know how powerful this can be. We use Userpilot to build custom analytics dashboards so we can visualize data in meaningful ways, and easily share it for everything from discussing trends to celebrating wins. This really helps build team trust in the data and keeps everyone aligned around the same key performance indicators.
Accelerate your product analytics process with Userpilot!
If you want your product team to make smarter, faster product decisions, data isn’t enough. You also need a system that helps you act on it. That’s exactly what we’re building at Userpilot.
From product analytics tools and dashboards to AI-powered insights and in-app engagement features, Userpilot helps product managers move easily from analysis to action. You can track how users behave, identify trends, and instantly create experiences that drive adoption and growth, all in one platform.
Ready to see it in action? Book a Userpilot demo and find out how it can help you accelerate your product analytics process.